Surrey County Council election, 2017

Last updated
Surrey County Council election, 2017

Flag of Surrey.svg


  2013 4 May 2017 2021  

All 81 seats to Surrey County Council
41 seats needed for a majority

  First party Second party Third party
  Cllr David Hodge CBE.jpg
Leader David Hodge
Party Conservative Liberal Democrat RA
Leader's seat Warlingham
Last election 58 9 8
Seats won 61 9 5
Seat changeIncrease2.svg3 -Decrease2.svg3

  Fourth party Fifth party Sixth party
 
Party Independents Green Labour
Last election 1 1 1
Seats won 4 1 1
Seat changeIncrease2.svg 3 - -

Surrey UK local election 2017 map.svg

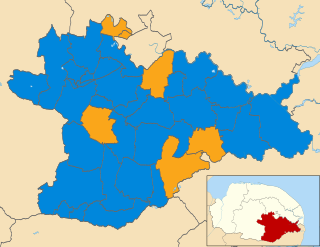
Map showing the results of the 2017 Surrey County Council elections.

Council control before election


Conservative

Council control after election


Conservative

The 2017 Surrey County Council election took place as part of the 2017 local elections in the UK. [1] All 81 councillors were elected for single-member electoral divisions for a four-year term. The electoral system used is first-past-the-post voting.

Surrey County Council British administrative authority

Surrey County Council is the county council administering certain services in the non-metropolitan county of Surrey in England. The council is composed of 81 elected Councillors, the majority of whom are members of the Conservative party. The leader of the council is Tim Oliver.

The wards and electoral divisions in the United Kingdom are electoral districts at sub-national level represented by one or more councillors. The ward is the primary unit of English electoral geography for civil parishes and borough and district councils, electoral ward is the unit used by Welsh principal councils, while the electoral division is the unit used by English county councils and some unitary authorities. Each ward/division has an average electorate of about 5,500 people, but ward-population counts can vary substantially. As at the end of 2014 there were 9,456 electoral wards/divisions in the UK.

Contents

The result was Conservative councillors formed an increased majority on the council at the equivalent loss of three seats formerly won by UKIP. Two tied second-largest party groupings of councillors were unaltered as to their seats, on net balance. These were Liberal Democrats and an informal alliance of Independent and Residents Association councillors: nine councillors each. The balance of two councillors continued as one Labour Party and one Green Party of England and Wales member.

Conservative Party (UK) Political party in the United Kingdom

The Conservative Party, officially the Conservative and Unionist Party, is a centre-right political party in the United Kingdom. Presently led by Theresa May, it has been the governing party since 2010. It presently has 314 Members of Parliament in the House of Commons, 249 members of the House of Lords, and 18 members of the European Parliament. It also has 31 Members of the Scottish Parliament, 12 members of the Welsh Assembly, eight members of the London Assembly and 9,008 local councillors. One of the major parties of UK politics, it has formed the government on 45 occasions, more than any other party.

Liberal Democrats (UK) Political party in the United Kingdom

The Liberal Democrats are a liberal, centrist political party in the United Kingdom. They presently have 11 Members of Parliament in the House of Commons, 96 members of the House of Lords, and one member of the European Parliament. They also have five Members of the Scottish Parliament and a member each in the Welsh Assembly and London Assembly. The party reached the height of its influence in the early 2010s, forming a junior partner in a coalition government from 2010 to 2015. It is presently led by Vince Cable.

The Labour Party is a centre-left political party in the United Kingdom which has been described as an alliance of social democrats, democratic socialists and trade unionists. The party's platform emphasises greater state intervention, social justice and strengthening workers' rights. Labour is a full member of the Party of European Socialists and Progressive Alliance, and holds observer status in the Socialist International. As of 2017, the party was considered the "largest party in Western Europe" in terms of party membership, with more than half a million members.

Results summary

Surrey County Council election, 2017 [2]
PartySeatsGainsLossesNet gain/lossSeats %Votes %Votes+/−
  Conservative 61 +3 48.7 148,534
  Liberal Democrat 9 0 23.0 70,139
Independents and Residents' Associations 9 0 9.7 29,446
  Labour 1 0 9.5 29,047
  Green 1 0 4.2 12,795
  UKIP 0 -3 4.9 14,935

Division Results

An asterisk * indicates an incumbent seeking re-election.

Addlestone

Addlestone
PartyCandidateVotes%±
Conservative John Furey* 1804 54 +14.4
Labour June Tilbury 648 19 -1.4
UKIP Nicolas Wood 356 11 -20.9
Liberal Democrat Chelsea Whyte 324 10 +4
Green Richard Miller 232 7 n/a
Majority 1156 35 +27.3
Turnout 3364 31 +6
Conservative hold Swing

Ash

Ash
PartyCandidateVotes%±
Conservative Marsha Molesey* 1,675 60 +13
Liberal Democrat Caroline Johnson 528 19 -1
Labour Jacob Armani 249 9 -3
UKIP Kyle Greaves 192 7 -14
Green Neil Jameson 152 5 n/a
Majority 1147 41 +15
Turnout 2796 28 0
Conservative hold Swing

Ashford

Ashford
PartyCandidateVotes%±
Conservative Naz Islam 1725 47 +3
UKIP Paul West 591 16 -17
Labour Rebecca Geach 564 15 -2
Independent Frank Ayres 357 10 n/a
Liberal Democrat Thomas Fidler 271 7 +2
Green Rupert Jackson 177 5 n/a
Majority 1134 31 +20
Turnout 3685 34 +6.57
Conservative hold Swing

Ashtead

Ashtead
PartyCandidateVotes%±
Independent Christopher Townsend* 2763 54 +1
Conservative Chris Hunt 1777 35 +4
Liberal Democrat Sebastian Bate 225 4 +2
Labour Susan Gilchrist 194 4 0
Green Tony Cooper 123 2 n/a
Majority 986 19 -3
Turnout 5082 45 +6.49
Independent hold Swing

At the previous election the UKIP candidate polled 11%

Bagshot, Windlesham and Chobham

Bagshot, Windlesham and Chobham
PartyCandidateVotes%±
Conservative Mike Goodman* 2437 62 +8
Liberal Democrat Sam Kay 679 17 +6
Green Andrew Willgoss 579 15 n/a
Labour Paul Edwards 219 6 -8
Majority 1758 45 +13
Turnout 3914 36 +8
Conservative hold Swing

In the previous election the UKIP candidate polled 22%.

Banstead, Woodmansterne & Chipstead

Banstead, Woodmansterne & Chipstead
PartyCandidateVotes%±
Conservative Ken Gulati* 2414 67 +17
Liberal Democrat James Fowler 529 15 +7
Labour Evan Gregory 276 8 n/a
UKIP Gillian Grant 238 7 -26
Green Phil Wilson 165 5 -4
Majority 1885 52 +35.2
Turnout 3622 33 +7
Conservative hold Swing

Bookham and Fetcham West

Bookham and Fetcham West
PartyCandidateVotes%±
Conservative Clare Curran* 3256 51 +6
Liberal Democrat Raj Haque 2604 41 +15
Green Damian McDevitt 288 4 n/a
UKIP Marjorie Dixon 253 4 -19
Majority 652 10 -10
Turnout 6401 54 +15
Conservative hold Swing

Camberley East

Camberley East
PartyCandidateVotes%±
Conservative Bill Chapman* 2233 71 +19
Liberal Democrat David Whitcroft 511 16 n/a
Labour Bernard Collins 402 13 -5
Majority 1722 56 +34
Turnout 3146 29 +6
Conservative hold Swing

At the previous election the UKIP candidate polled 30%.

Camberley West

Camberley West
PartyCandidateVotes%±
Conservative Charlotte Morley 1839 51 +6
Labour Richard Claridge 621 17 -14
Independent David Allen 394 11 n/a
Liberal Democrat Morgan Rise 328 9 n/a
Independent Frances Halstead 300 8 n/a
UKIP Damian Heads 151 4 -20
Majority 1218 34 +20
Turnout 3633 31 +3
Conservative hold Swing

Caterham Hill

Caterham Hill
PartyCandidateVotes%±
Liberal Democrat Chris Botten 1738 44 -2
Conservative Rod Stead 1726 44 +15
Labour Eddington Pindura 262 7 +1
UKIP Joe Branco 197 5 -15
Majority 12 0 -17.5
Turnout 3923 36 +3
Liberal Democrat hold Swing

Caterham Valley

Caterham Valley
PartyCandidateVotes%±
Liberal Democrat David Lee 1589 47 +21
Conservative Michael Cooper 1343 40 =0.5
Labour Mark Wood 242 7 -1
UKIP Jeffrey Bolter 172 5 -16
Majority 246 7
Turnout 3346 36 +6
Liberal Democrat gain from Conservative Swing

In the previous election a Green Party candidate polled 5%.

Chertsey

Chertsey
PartyCandidateVotes%±
Conservative Mark Nuti 1978 59 +17
Labour Arran Neathey 650 19 -7.7
Liberal Democrat Sylvia Whyte 381 11 n/a
UKIP Bill Bruno 326 10 -21.4
Majority 1328 40 +29.5
Turnout 3335 31 +3
Conservative hold Swing

Cobham

Cobham
PartyCandidateVotes%±
Conservative Mary Lewis* 2290 67 +10
Liberal Democrat David Bellchamber 679 20 +9
Labour Lana Hylands 254 7 0
UKIP Elaine Kingston 175 5 -19
Majority 1611 47 +14
Turnout 3398 33 +7.15
Conservative hold Swing

Cranleigh & Ewhurst

Cranleigh & Ewhurst
PartyCandidateVotes%±
Conservative Andrew Povey 2094 54 +3
Liberal Democrat Richard Cole 1098 28 +14
UKIP Roseleen Egan 362 9 -17
Labour Luke Wenman 334 9 0
Majority 996 26 +1
Turnout 3888 37 +4
Conservative hold Swing

Dorking Hills

Dorking Hills
PartyCandidateVotes%±
Liberal Democrat Hazel Watson* 2906 57 +11
Conservative David Mir 1675 33 +6
Green Jacquetta Fewster 231 4 -1
UKIP David Payne 167 3 -16
Labour Emma Davies 155 3 0
Majority 1231 24 +5
Turnout 5134 48 +7
Liberal Democrat hold Swing

Dorking Rural

Dorking Rural
PartyCandidateVotes%±
Conservative Helyn Clack* 2580 54 +14
Liberal Democrat Roger Abbott 1695 35 +1
UKIP Geoff Cox 248 5 -16
Green Jeff Zie 164 3 n/a
Labour Angus Rendall 125 3 -3
Majority 885 19 +13
Turnout 4812 44 +3
Conservative hold Swing

Dorking South and the Holmwoods

Dorking South and the Holmwoods
PartyCandidateVotes%±
Liberal Democrat Stephen Cooksey* 2261 51 +9
Conservative Roger Jones 1466 33 +6
Green Chris Crook 256 6 n/a
UKIP Michael Foulston 205 5 -16
Labour Peter Horitz 204 5 -4
Majority 795 18 +3
Turnout 4392 42 +4
Liberal Democrat hold Swing

Earlswood and Reigate South

Earlswood and Reigate South
PartyCandidateVotes%±
Conservative Barbara Thomas* 1621 48 +15
Labour Graham Wildridge 633 19 -2
Liberal Democrat Moray Carey 488 14 +7
UKIP Brian Stiff 353 10 -21
Green Sue Fenton 235 9 +1
Majority 988 29 +27
Turnout 3330 33 +4.59
Conservative hold Swing

East Molesey and Esher

East Molesey & Esher
PartyCandidateVotes%±
Conservative Peter Szanto 2095 54 +13
Residents Elizabeth Cooper 1149 30 -11
Liberal Democrat Paul Nagle 318 8 +6
Labour Raymond Kelly 159 4
Green Laura Harmour 102 3 n/a
UKIP Trevor Marshall 66 2 -9
Majority 946 24 +24
Turnout 3889 40 +11.39
Conservative gain from Residents Swing 12

Egham

Egham
PartyCandidateVotes%±
Conservative Yvonna Lay* 1104 49 +6.5
Labour Fiona Dent 464 21 +1
Liberal Democrat Jake Short 299 13 +3
UKIP David Roe 224 10 -18
Green Fergus Munro 147 7 n/a
Majority 640 28 +13.5
Turnout 2238 28 +7
Conservative hold Swing

Englefield Green

Englefield Green
PartyCandidateVotes%±
Conservative Marisa Heath* 1169 41 -2
Runnymeade Independent Residents Group Chris Fisher 809 29 n/a
Labour Ben Tozer 307 11 -5
Liberal Democrat Will Coles 255 9 +2
UKIP David Hunt 148 5 -19
Green Lee-Anne Lawrence 138 5 -5
Majority 360 12 -7.4
Turnout 2826 29 +9.5
Conservative hold Swing


Epsom Town & Downs

Epsom Town & Downs
PartyCandidateVotes%±
Conservative Tina Mountain* 1751 42 +3
Residents Clive Woodbridge 1321 32 +4
Liberal Democrat Julie Anne Morris 612 15 +4
Labour Veronica Monks 347 8
Green Theresa MacIntyre 138 3 n/a
Majority 430 10 -1
Turnout 4169 37 +4
Conservative hold Swing

At the last election the UKIP candidate polled 13%.

Epsom West

Epsom West
PartyCandidateVotes%±
Conservative Bernie Muir 1218 30 +17
Liberal Democrat Clare Clark 1144 28 0
Labour Kate Chinn 839 21 +1
Residents Barry Nash 717 18 -5
Green Janice Baker 165 4 n/a
Majority 74 2
Turnout 4083 37 +8
Conservative gain from Liberal Democrat Swing

At the last election the UKIP candidate polled 16%

Ewell

Ewell
PartyCandidateVotes%±
Residents John Beckett* 2579 66 +3
Conservative James Tarbit 732 19 +8
Labour Rosalind Godson 255 7 +2
Liberal Democrat Alison Kelly 234 6 +3
Green Susan McGrath 79 2 n/a
Majority 1847 47 0
Turnout 3879 33 +6
Residents hold Swing

In the previous election the UKIP candidate polled 16%

Ewell Court, Auriol & Cuddington

Ewell Court, Auriol & Cuddington
PartyCandidateVotes%±
Residents Eber Kington* 2708 68 +4
Conservative Karan Persand 776 19 +10
Labour Erica Gregory 254 6 0
Liberal Democrat Paul Coulter 180 4 +1
Green Lucy Barford 92 2 n/a
Majority 1932 49 +3
Turnout 4010 34 +6
Residents hold Swing

In the last election the UKIP candidate polled 18%.

Farnham Central

Farnham Central
PartyCandidateVotes%±
Farnham ResidentsAndy MacLeod175443n/a
Liberal Democrat Jo Aylwin 1085 27 +9
Conservative Pat Frost* 1,057 26 -7
Green Fiona Scimone 164 4 n/a
Majority 669 16 n/a
Turnout 4060 41 +11
Farnham Residents gain from Conservative Swing

At the past election the UKIP candidate polled 22%, the Independent candidate polled 18% and the Labour candidate polled 8%.

Farnham North

Farnham North
PartyCandidateVotes%±
Farnham ResidentsStephen Spence160645n/a
Conservative Mike Hodge 1274 36 +4
Liberal Democrat Rob Walton 437 12 +1
Green Dave Beynon 230 6 n/a
Majority 332 9 n/a
Turnout 3547 36 +5
Farnham Residents gain from Conservative Swing

In the previous election the UKIP candidate polled 31%, an Independent candidate polled 18% and Labour polled 7%.

Farnham South

Farnham South
PartyCandidateVotes%±
Conservative Robert Ramsdale 1526 39 -11
Farnham Residents John Ward 1463 37 n/a
Liberal Democrat Mark Turner 550 14 +4
Labour Andrew Jones 148 4 -3
Independent Mark Westcott 140 4 n/a
UKIP Jim Burroughs 86 2 -14
Majority 63 2 n/a
Turnout 3913 40 +6
Conservative hold Swing

Foxhills, Thorpe and Virginia Water

Foxhills, Thorpe and Virginia Water
PartyCandidateVotes%±
Conservative Mel Few* 2314 65 +12
Liberal Democrat Don Whyte 462 13 +7
Labour Jacqueline Fletcher 333 9 -3.4
UKIP Steve Gynn 321 9 -19.6
Green Tobias Horkan 116 3 n/a
Majority 1852 52 +27.6
Turnout 2314 34 +7
Conservative hold Swing

Frimley Green and Mytchett

Frimley Green and Mytchett
PartyCandidateVotes%±
Conservative Paul Deach 2103 61 +25
Liberal Democrat Cindy Ferguson 672 19 +1
Labour Jenniann Davies 267 8 -4
UKIP Paul Chapman 252 7 -26
Green Peter Barnett 129 4 n/a
Christian Party Juliana Brimicombe 52 1 n/a
Majority 1431 42 +39
Turnout 3475 33 +8
Conservative hold Swing

Godalming North

Godalming North
PartyCandidateVotes%±
Liberal Democrat Penny Rivers 1895 46 +25
Conservative Steve Cosser* 1656 40 -4
Green James Coope 349 8 n/a
UKIP Brian Egan 254 6 -13
Majority 239 6
Turnout 4154 37 +6
Liberal Democrat gain from Conservative Swing

In the previous election the Labour candidate polled 16%.

Godalming South, Milford & Witley

Godalming South, Milford & Witley
PartyCandidateVotes%±
Conservative Peter Martin 2484 62 +5
Liberal Democrat Paul Follows 952 24 +12
Labour Kate Townsend 542 14 +5
Majority 1532 38 +3
Turnout 3978 37 +4
Conservative hold Swing

In the previous election the UKIP candidate polled 22%.

Godstone

Godstone
PartyCandidateVotes%±
Conservative Rose Thorn 1646 47 +8.5
UKIP Helena Windsor* 949 27 -12.9
Liberal Democrat Tamzie Hollands 613 18 +6.2
Labour Linda Baharier 290 8 0
Majority 697 20 +18.6
Turnout 3498 37 +4
Conservative gain from UKIP Swing

Goldsworth East and Horsell Village

Goldsworth East and Horsell Village
PartyCandidateVotes%±
Conservative Colin Kemp* 1934 43 +7
Liberal Democrat John Doran 1876 42 +8
Labour John Scott-Morgan 463 10 -2
UKIP Tim Read 241 5 -13
Majority 58 1 -1
Turnout 4514 41 +8
Conservative hold Swing


Guildford East

Guildford East
PartyCandidateVotes%±
Conservative Graham Ellwood* 1910 45 -5
Liberal Democrat George Potter 1495 35 +10
Labour Richard Mithen 505 12 +2
Green Sam Peters 304 7 n/a
Majority 415 10 -15
Turnout 4214 41 +5
Conservative hold Swing

At the last election the UKIP candidate polled 15%.

Guildford North

Guildford North
PartyCandidateVotes%±
Liberal Democrat Angela Goodwin 1564 42 +7
Conservative David Snipp 1250 33 +9
Labour Anne Rouse 724 19 -1
Green Paul Stevenson 206 6 n/a
Majority 314 9 -2
Turnout 3744 34 +7
Liberal Democrat hold Swing

At the last election the UKIP candidate polled 21%.

Guildford South-East

Guildford South-East
PartyCandidateVotes%±
Conservative Mark Brett-Warburton* 2073 51 -2
Liberal Democrat Leonie Anderson 1641 40 +14
Labour Howard Smith 355 9 0
Majority 432 11 -16
Turnout 4069 40 +7
Conservative hold Swing

At the last election the UKIP candidate polled 12%.

Guildford South-West

Guildford South-West
PartyCandidateVotes%±
Liberal Democrat David Goodwin* 1975 51 +13
Conservative Bob Hughes 1128 31 -2
Labour Matthew Smith 330 9 -4
Green Mark Bray-Parry 208 6 n/a
Peace Chapel Kabir 34 1 -3
Majority 847 20 +15
Turnout 3675 37 +8
Liberal Democrat hold Swing

At the last election the UKIP candidate polled 13%.

Guildford West

Guildford West
PartyCandidateVotes%±
Liberal Democrat Fiona White* 955 43 +8
Labour Co-op George Dokimakis 573 26 +2
Conservative Adrian Chandler 567 26 +10
Green Jo Purvis 71 3 n/a
Peace John Morris 38 2 -3
Socialist (GB) Adam Buick 12 1 n/a
Majority 382 17 +6
Turnout 2216 29 +9
Liberal Democrat hold Swing

At the last election the UKIP candidate polled 21%.

Haslemere

Haslemere
PartyCandidateVotes%±
Conservative Richard Hampson 1849 53 +18
Liberal Democrat John Robini 990 28 +20
Green Jon Taylor 304 9 n/a
Labour Kim Hemmingway 200 6 +1
UKIP Gail Weingartner 164 5 -12
Majority 859 25 +25
Turnout 3507 37 +2
Conservative gain from Independent Swing

At the last election the Independent candidate polled 35%.

Heatherside and Parkside

Heatherside and Parkside
PartyCandidateVotes%±
Conservative Edward Hawkins 2041 54 +2
Liberal Democrat John Skipper 638 17 +2
Independent David Ivison* 466 12 n/a
Labour Jill Coles 216 6 -2
UKIP Hazel Prowse 179 5 -20
Green Yvonne Greenwood 153 4 n/a
Independent Barrie Cullen 75 2 n/a
Majority 1403 37 +10
Turnout 3768 36 +10
Conservative gain from Independent Swing

In the 2013 election David Ivison won the seat for the Conservatives

Hersham

Hersham
PartyCandidateVotes%±
Conservative John O'Reilly 2146 54 +14
Hersham Village Society Roy Green 981 25 -10
Labour Peter Ramsbottom 296 8 +1
Liberal Democrat Michael Smith 287 7 +3
Green Olivia Palmer 230 6 n/a
Majority 1165 29 +24
Turnout 3940 38 +5.2
Conservative hold Swing

In the previous election a UKIP candidate polled 14%

Hinchley Wood, Claygate & Oxshott

Hinchley Wood, Claygate & Oxshott
PartyCandidateVotes%±
Conservative Mike Bennison* 2395 50
Liberal Democrat Alastair Coomes 2269 47 +17
UKIP Bernard Collignon 157 3 -12
Majority 126 3 -17
Turnout 4821 40 +7.52
Conservative hold Swing

Horley East

Horley East
PartyCandidateVotes%±
Conservative Graham Knight 1990 60 +13
Labour Linda Mabbett 494 15 +4
UKIP Malcolm Brighting 386 12 -19
Liberal Democrat Judith Sykes 298 9 0
Green David Scoffield 172 5 n/a
Majority 1496 45 +29
Turnout 3340 32 +7.52
Conservative hold Swing

Horley West, Salfords and Sidlow

Horley West, Salfords and Sidlow
PartyCandidateVotes%±
Conservative Kay Hammond* 1,697 55 +13
Labour Tom Turner 434 14 0
UKIP Joseph Fox 429 14 -22
Liberal Democrat Geoffrey Southall 215 12 +3
Green Muriel Passmore 155 5 n/a
Majority 1263 41 +35
Turnout 2930 32 +6.28
Conservative hold Swing

Horsleys

Horsleys
PartyCandidateVotes%±
Conservative Julie Iles 2450 54 -6
Liberal Democrat Paul Kennedy 1731 38 +26
Green Ann James 134 3 n/a
UKIP Robert Cane 108 2 -19
Labour Carolyn Fiddes 108 2 -5
Majority 719 16 -23
Turnout 4531 46 +10
Conservative hold Swing

Knaphill and Goldsworth West

Knaphill and Goldsworth West
PartyCandidateVotes%±
Conservative Saj Hussain* 2342 63 +14
Liberal Democrat Ann-Marie Barker 804 22 +2
Labour Peter Ford 356 10 +3
UKIP Troy De Leon 203 5 -10
Majority 1538 41 +12
Turnout 3705 34 +1
Conservative hold Swing

At the preceding election, an Independent candidate polled 10%.


Laleham and Shepperton

Laleham and Shepperton
PartyCandidateVotes%±
Conservative Richard Walsh* 2171 54 +1
Independent Stuart Boyle 665 17 n/a
Labour Jon Button 396 10 -2
Liberal Democrat Richard Dunn 349 9 +1
UKIP Brian Catt 271 7 -21
Green Peter Hughes 155 4 n/a
Majority 1506 37 +12
Turnout 4007 39 +8
Conservative hold Swing

Leatherhead and Fetcham East

Leatherhead and Fetcham East
PartyCandidateVotes%±
Conservative Tim Hall* 2295 53 +11
Liberal Democrat Clare Malcolmson 1259 29 +8
Labour Marc Green 354 8 0
UKIP Michael Heelas 251 6 -22
Green Julian Everett 148 3 n/a
Majority 1036 24 +10
Turnout 4307 37 +5.5
Conservative hold Swing

Lightwater, West End and Bisley

Lightwater, West End and Bisley
PartyCandidateVotes%±
Conservative David Mansfield 2109 55 +3
Independent Graham Alleway 627 16 n/a
Liberal Democrat Rob Beere 613 16 +7
Labour Mick Sheehan 223 6 -5
Green Sharon Galliford 139 4 n/a
UKIP Piotr Farbiszewski 128 3 -25
Majority 1482 39 +25
Turnout 3839 33 +7
Conservative hold Swing

Lingfield

Lingfield
PartyCandidateVotes%±
Conservative Lesley Steeds 2853 69 +13.8
Liberal Democrat Dave Wilkes 635 15 n/a
UKIP Richard Grant 378 9 -16
Labour Elizabeth Warwick-Ching 286 7 0
Majority 2218 54 +28.8
Turnout 4152 34 +1
Conservative hold Swing

At the previous election the Independent candidate polled 30%.

Lower Sunbury & Halliford

Lower Sunbury & Halliford
PartyCandidateVotes%±
Conservative Tim Evans* 1945 51 +14
Liberal Democrat Sandra Dunn 1211 32 -2
Labour Sean Beatty 319 8 n/a
UKIP Redvers Cunningham 223 6 -23
Green Steve Trafford 102 3 n/a
Majority 734 19 +16
Turnout 3800 36 +7
Conservative hold Swing

Merstham and Banstead South

Merstham and Banstead South
PartyCandidateVotes%±
Conservative Bob Gardner* 1647 55 +11
Labour Stewart Dack 489 16 -2
Liberal Democrat Christopher Howell 416 16 +5
UKIP Leigh Jones 275 9 -19
Green Kumari Lane 185 6 n/a
Majority 1158 39 +23
Turnout 3012 30 +4.67
Conservative hold Swing

Nork and Tattenhams

Nork and Tattenhams
PartyCandidateVotes%±
Residents Nick Harrison* 2470 64 +10
Conservative Alex Clarke 971 25 +9
Liberal Democrat Stephen Gee 184 5 +2
Labour Kimberley Griffin 166 4 +1
Green Alistair Morten 78 2
Majority 1499 39 +3
Turnout 3869 32 +4
Residents' Association hold Swing

At the previous election the UKIP candidate polled 18%.

Oxted

Oxted
PartyCandidateVotes%±
Conservative Cameron McIntosh 2457 50 +5.4
Liberal Democrat Craig Shepherd 878 18 +9
Labour Katherine Saunders 698 14 +2.7
UKIP Christopher Dean 478 10 -19.3
Green Benedict Southworth 362 7 +1
Majority 1579 32 +16.7
Turnout 4873 41 +5
Conservative hold Swing


Redhill East

Redhill East
PartyCandidateVotes%±
Green Jonathan Essex 1849 53 +3
Conservative Frank Kelly 879 25 +3
Labour Toby Brampton 350 10 -2
Liberal Democrat Stuart Holmes 250 7 +3
UKIP Laurence Clack 134 4 -9
Majority 970 28 0
Turnout 3462 34 +5
Green hold Swing

Redhill West and Meadvale

Redhill West and Meadvale
PartyCandidateVotes%±
Conservative Natalie Bramhall* 1661 43 +13
Green Rob Jarrett 862 22 +1
Liberal Democrat Peter Lambell 769 20 +2
Labour David Heydon 425 11 0
UKIP Tim Pearson 158 4 -15
Majority 799 21 +12
Turnout 3875 38 +5.77
Conservative hold Swing

Reigate

Reigate
PartyCandidateVotes%±
Conservative Zully Grant-Duff* 2157 52 +3
Liberal Democrat John Vincent 1263 31 +13
Green Liz Wakefield 283 7 -1
Labour Robin Spencer 257 6 -3
UKIP Phyll Cambridge 149 4 =12
Majority 894 21 -10
Turnout 4109 39 +8
Conservative hold Swing

Shalford

Shalford
PartyCandidateVotes%±
Conservative Matt Furniss 2036 55 n/a
Liberal Democrat James Steel 480 13 -24
Guildford Greenbelt Group Nick Norton 401 11 n/a
UKIP George Johnson* 312 8 -43
Labour Mark Redhead 241 7 -2
Green Fran Aslin 208 6 n/a
Majority 1556 42 +28
Turnout 3678 35 +8
Conservative gain from UKIP Swing

Shere

Shere
PartyCandidateVotes%±
Conservative Keith Taylor* 2207 62 +5
Liberal Democrat Tom Hunt 713 20 +9
Green Vicki Elcoate 391 11 n/a
Labour Robin Woof 256 7 -2
Majority 1494 42 +8
Turnout 3567 37 +3
Conservative hold Swing

At the previous election the UKIP candidate polled 23%.

Staines

Staines
PartyCandidateVotes%±
Conservative Sinead Mooney 1455 41 -6
UKIP Denise Saliagopoulos* 718 20 -2
Labour John Johnston 589 16 +3
Liberal Democrat Nichola Cornes 571 16 +7
Green Elizabeth Mansfield 208 6 -2
TUSC Matt Clarke 46 1 n/a
Majority 737 21 -4
Turnout 3587 34 +8
Conservative hold Swing

Staines South & Ashford West

Staines South & Ashford West
PartyCandidateVotes%±
Conservative Denise Turner-Stewart* 1914 53 +15
Labour Suzanne Gulbrandson 589 16 -4
UKIP Chris Beresford 530 15 -23
Liberal Democrat Christopher Bateson 448 12 +8
Green Anoma Jacobs 118 3 n/a
Majority 1325 37 37
Turnout 3599 33 +5
Conservative hold Swing

Stanwell & Stanwell Moor

Stanwell & Stanwell Moor
PartyCandidateVotes%±
Labour Robert Evans * 1294 46 +11
Conservative John Boughtflower 1080 38 +13
UKIP Gerald Gravett 318 11 -13
Liberal Democrat Terrence Lewis 114 4 -1
Majority 214 8 -2
Turnout 2806 26 +2
Labour hold Swing

At the preceding election an Independent candidate polled 11%.

Sunbury Common & Ashford Common

Sunbury Common & Ashford Common
PartyCandidateVotes%±
Conservative Alison Griffiths 1406 44 +23
Liberal Democrat Ian Beardsmore* 1041 33 -7
Labour Susan Bryer 402 13 -1
UKIP Peter Appleford 266 8 -17
Green Paul Jacobs 80 3 n/a
Majority 356 11 -4
Turnout 3195 28 +6
Conservative gain from Liberal Democrat Swing

Tadworth, Walton and Kingswood

Tadworth, Walton and Kingswood
PartyCandidateVotes%±
Conservative Jeffrey Harris 2596 71 +18
Liberal Democrat Stephen Kulka 313 9 +2
UKIP Valerie Moore 285 8 -24
Labour David Burnley 260 7 n/a
Green Roger Ponsford 202 6 -2
Majority 2283 62 +41
Turnout 3656 33 +6.27
Conservative hold Swing

The Byfleets

The Byfleets
PartyCandidateVotes%±
Conservative Richard Wilson* 1536 41 -9
Independent John Edwin Bond 1203 32 n/a
Liberal Democrat Anne Roberts 650 18 0
Labour Alex Wilks 198 5 -3
UKIP Lyn Sage 122 3 -17
Majority 333 9 -21
Turnout 3709 37 +7
Conservative hold Swing

The Dittons

The Dittons
PartyCandidateVotes%±
Residents Nick Darby 2515 57 +2
Conservative Bruce Finch 1001 23 +5
Liberal Democrat Gerard Doherty 724 16 +10
Labour Rosemary Rendall 201 5 -1
Majority 1514 34 -3
Turnout 4441 38 +8.99
Residents hold Swing

In the previous election a UKIP candidate polled 14%

Walton

Walton
PartyCandidateVotes%±
Conservative Rachael Lake* 1813 53 +16
Liberal Democrat Chris Elmer 753 22 +19
Labour Richard Leonard 620 18 +7
UKIP David Ions 257 7 -9
Majority 1060 31 +26
Turnout 3443 30 +4.75
Conservative hold Swing

In the previous election a Walton Society candidate polled 32%

Walton South & Oatlands

Walton South & Oatlands
PartyCandidateVotes%±
Conservative Tony Samuels* 2351 62 +5
Liberal Democrat Adriana Dredge 862 23 +12
Labour Warren Weertman 378 10 -2
UKIP Simon Kadwill-Kelly 194 5 -15
Majority 1489 39 +2
Turnout 3785 34 +7.01
Conservative hold Swing

Warlingham

Warlingham
PartyCandidateVotes%±
Conservative David Hodge* 2265 56 +13.6
Liberal Democrat Charles Lister 1165 29 +7.2
UKIP Roger Bird 403 10 -21.5
Labour Jenifer Dugdale 146 5 +1
Majority 1100 27 +16
Turnout 3979 40 +6
Conservative hold Swing

Waverley Eastern Villages

Waverley Eastern Villages
PartyCandidateVotes%±
Conservative Victoria Young* 2519 68 +9
Liberal Democrat Fabian Cole 755 20 +9
Labour Lewis Curtis 246 7 -2
UKIP Woodruff Walker 177 5 -17
Majority 1764 48 +11
Turnout 3697 37 +5
Conservative hold Swing

Waverley Western Villages

Waverley Western Villages
PartyCandidateVotes%±
Conservative David Harmer* 2345 71 +10
Liberal Democrat Geoffrey Whitby 585 18 +8
Green Susan Ryland 361 11 n/a
Majority 1760 53 +14
Turnout 3291 35 +3
Conservative hold Swing

In the previous election the UKIP candidate polled 22% and the Labour candidate polled 7%.

West Ewell

West Ewell
PartyCandidateVotes%±
Residents Jan Mason* 1592 51 +2
Conservative Stephen Pontin 729 23 +8
Labour Rob Geleit 462 15 +2
Liberal Democrat Julia Kirkland 270 9 +4
Green David Kidd 97 3 n/a
Majority 863 28 -3
Turnout 3150 27 +3
Residents hold Swing

At the last election the UKIP candidate polled 18%.

West Molesey

West Molesey
PartyCandidateVotes%±
Residents Ernest Mallett* 1763 49 -22
Conservative Steve Bax 1201 34 +24
Labour Jamal Ajjane 264 7 +5
Liberal Democrat Alastair Sturgis 194 5 +2
Green Sarah Spencer-Bowdage 142 4 n/a
Majority 562 15 -43
Turnout 3564 35 +7.84
Residents hold Swing

In the previous election the UKIP candidate polled 13%

Weybridge

Weybridge
PartyCandidateVotes%±
Conservative Tim Oliver 2069 50 +18
Liberal Democrat Vicki Macleod 1492 36 +15
Labour Stephanie Franklin 222 5
UKIP Timothy Pope 180 4 +13
Green Lesley Tilling 156 4 n/a
Majority 577 14 +7
Turnout 4119 36 +8.05
Conservative hold Swing

Woking North

Woking North [3]
PartyCandidateVotes%±
Conservative Ben Carasco* 1913 44 +8
Labour Mohammad Khan 1666 39 +7
Liberal Democrat Henry Kay 535 12 -5
UKIP Judith Squire 193 4 -10
Majority 247 5 +1
Turnout 4307 41 +4
Conservative hold Swing

Woking South

Woking South [3]
PartyCandidateVotes%±
Liberal Democrat Will Forster* 2271 54 +11
Conservative Paul Saper 1423 34 +5
Labour Christopher Martin 343 8 0
UKIP Richard Squire 193 5 -12
Majority 848 20 +6
Turnout 4230 38 +7
Liberal Democrat hold Swing

Woking South East

Woking South East [3]
PartyCandidateVotes%±
Conservative Liz Bowes* 2341 62 +4
Liberal Democrat Liam Lyons 954 25 +12
Labour Geoff O'Shea 299 8 -2
UKIP Robin Milner 174 5 -14
Majority 1387 37 -2
Turnout 3768 38 +6.5
Conservative hold Swing

Woking South West

Woking South West
PartyCandidateVotes%±
Conservative Ayesha Azad 1873 55 +7
Liberal Democrat Chris Took 940 28 +8
Labour William James Sellers 391 11 0
UKIP Terry Knight 200 6 -15
Majority 933 27 0
Turnout 3404 36 +7
Conservative hold Swing

Woodham and New Haw

Woodham and New Haw
PartyCandidateVotes%±
Conservative Mary Angell* 2015 63 +15.7
Liberal Democrat Jennifer Coulon 372 12 +3
Labour Philip Martin 330 10 -3
UKIP Valerie Woodhouse 288 9 -21.9
Green Martin Robson 193 6 n/a
Majority 1643 51 +35
Turnout 3198 32 +4
Conservative hold Swing

Worplesdon

Worplesdon
PartyCandidateVotes%±
Conservative Keith Witham* 2691 69 +18
Liberal Democrat Paul Hienkens 658 17 0
Labour Dominic Stone 359 9 0
Green Eugene Suggett 182 5 n/a
Majority 2033 52 +23
Turnout 3890 36 +4
Conservative hold Swing

At the previous election the UKIP candidate polled 22%.

Related Research Articles

Thanet District Council in Kent, England is elected every four years.

2011 South Norfolk District Council election

The elections to South Norfolk District Council were held on Thursday 5 May 2011 along with various other local elections around England, elections to the Scottish Parliament, National Assembly of Wales and Northern Ireland Assembly, and a referendum on whether to adopt the Alternative Vote electoral system for elections to the House of Commons. All 46 council seats were up for election. The previous council was controlled by the Conservatives, with the Liberal Democrats being the only opposition.

2013 United Kingdom local elections

The 2013 United Kingdom local elections took place on Thursday 2 May 2013. Elections were held in 35 English councils: all 27 non-metropolitan county councils and eight unitary authorities, and in one Welsh unitary authority. Direct mayoral elections took place in Doncaster and North Tyneside. These elections last took place on the 4 June 2009 at the same time as the 2009 European Parliament Elections, except for County Durham, Northumberland and the Anglesey where elections last took place in 2008.

2013 Norfolk County Council election

The Norfolk County Council election took place across Norfolk on 2 May 2013, coinciding with local elections for all county councils in England. The results were announced the following day, Friday 3 May 2013. The result brought to an end 12 years of Conservative administration, who finished three seats short of a majority after losing 20 seats, leaving the Council in no overall control (NOC). UKIP and the Labour Party both made gains of 14 and 11 seats respectively. The Liberal Democrats and the Green Party both lost three seats each, whilst an independent won a single seat in North Norfolk.

2013 West Sussex County Council election

The West Sussex County Council election, 2013 took place on 2 May 2013, as part of the United Kingdom local elections, 2013. All 71 electoral divisions were up for election, which returned one county councillor each by first-past-the-post voting for a four-year term of office. At this election, the Conservative Party was seeking to retain overall control of the council, and the Liberal Democrats to maintain their position as the main opposition party.

2013 Hampshire County Council election

An election to Hampshire County Council took place on 2 May 2013 as part of the United Kingdom local elections, 2013. 78 councillors were elected from 75 electoral divisions, which returned either one or two county councillors each by first-past-the-post voting for a four-year term of office. The electoral divisions were the same as those of the previous election in 2009. No elections were held in Portsmouth and Southampton, which are unitary authorities outside the area covered by the County Council. The election saw the Conservative Party retain overall control of the council, with a reduced majority of five councillors.

2013 Surrey County Council election

The Surrey County Council election, 2013 took place on 2 May 2013 as part of the United Kingdom local elections, 2013. 81 electoral divisions returned one county councillor each by first-past-the-post voting for a four-year term of office. Following a review, new electoral division boundaries were introduced for this election, increasing the number of councillors from 80 to 81.

2013 Hertfordshire County Council election

An election to Hertfordshire County Council took place on 2 May 2013 as part of the United Kingdom local elections, 2013. 77 electoral divisions elected one county councillor each by first-past-the-post voting for a four-year term of office. The electoral divisions were the same as those used at the previous election in 2009.

2013 Staffordshire County Council election

An election to Staffordshire County Council took place on 2 May 2013 as part of the United Kingdom local elections, 2013. 62 electoral divisions returned one county councillor each by first-past-the-post voting for a four-year term of office. Following a boundary review, new electoral division boundaries were established for this election. No elections were held in Stoke-on-Trent, which is a unitary authority outside the area covered by the County Council. The council continues to be administered on the Leader and Cabinet model.

Elections for Boston Borough Council, which governs as a second-tier authority the Borough of Boston were held on Thursday 7 May 2015. Following Boundary Commission changes between this election and the previous in 2011 to the wards, 30 councillors were elected to serve 15 wards. The election was held on the same day as other local elections.

2015 Breckland District Council election

The 2015 Breckland District Council election took place on 7 May 2015 to elect members of Breckland District Council in England. This was on the same day as other local elections.

2016 Cannock Chase District Council election

Elections to Cannock Chase District Council took place on 5 May 2016. This election was held on the same day as other local elections as well as Police and Crime Commissioner elections. A total of 13 councillors were elected from all but two of the council's wards as a third of the council was up for election.

2017 United Kingdom local elections

The 2017 United Kingdom local elections were held on Thursday 4 May 2017. Local elections were held across Great Britain, with elections to 35 English local authorities and all councils in Scotland and Wales.

2017 East Sussex County Council election

The 2017 East Sussex County Council election took place on 4 May 2017 as part of the 2017 local elections in the United Kingdom. All councillors were to be elected from electoral divisions by first-past-the-post voting for a four-year term of office.

2017 Norfolk County Council election

The 2017 Norfolk County Council election took place on 4 May 2017 as part of the 2017 local elections in the United Kingdom.

2017 Worcestershire County Council election

The 2017 Worcestershire County Council election took place on 4 May 2017 as part of the 2017 local elections in the United Kingdom. All 57 councillors were elected from 53 electoral divisions which returned either one or two county councillors each by first-past-the-post voting for a four-year term of office. The Conservatives extended their majority in the council, gaining ten seats, largely at the expense of Labour and UKIP, who lost six seats between them; the Conservative majority increased from one seat to eleven. The number of seats for the Liberal Democrats and Green remained the same, with the Conservatives gaining the remaining five seats from independent politicians and candidates from smaller parties. The Conservatives lost one seat, Alvechurch, to an independent. The Liberals lost their only seat, St Chads in the Wyre Forest district, after they decided not to field any candidates; the Liberal Democrats held the seat, however. UKIP lost all their seats in this election to the Conservatives.

2017 Cornwall Council election

The 2017 Cornwall Council election was held on 4 May 2017 as part of the 2017 local elections in the United Kingdom. 122 councillors were elected from the 121 electoral divisions of Cornwall Council, which returned either one or two councillors each by first-past-the-post voting for a four-year term of office. Although originally scheduled to take place on the same day, the election in the Bodmin St Petroc ward was countermanded following the death of Liberal Democrat candidate Steve Rogerson and was held on 8 June.

2017 Welsh local elections

Local elections were held in Wales on Thursday 4 May 2017 to elect members of all 22 local authorities, including the Isle of Anglesey, which was last up for election in 2013 due to having its elections delayed for a year. These local elections were held alongside local elections in Scotland and parts of England.

Elections to Cannock Chase District Council took place on 3 May 2018 on the same day as other local elections in England. A third of the council was up for election, meaning a total of 13 councillors were elected from all but two of the council's wards.

2018 Sunderland City Council election

The 2018 Sunderland City Council election took place on 3 May 2018 to elect members of Sunderland City Council in England. The election took place on the same day as other local elections.

References