East Sussex County Council election, 2017

Last updated
East Sussex County Council election, 2017
Flag of East Sussex.svg
  2013 4 May 20172021 

All 50 seats to East Sussex County Council
26 seats needed for a majority

 First partySecond party
 
Party Conservative Liberal Democrat
Seats before229
Seats won3011
Seat changeIncrease2.svg8Increase2.svg2

 Third partyFourth party
 
Party Labour UKIP
Seats before78
Seats won40
Seat changeDecrease2.svg3Decrease2.svg8

East Sussex UK local election 2017 map.svg
Map showing the results of the 2017 East Sussex County Council election.

Council control before election

No Overall Control

Council control after election

Conservative Party (UK)

The 2017 East Sussex County Council election took place on 4 May 2017 as part of the 2017 local elections in the United Kingdom. [1] All councillors were to be elected from electoral divisions by first-past-the-post voting for a four-year term of office.

East Sussex County Council British administrative body

East Sussex County Council is the local authority for the non-metropolitan county of East Sussex.

The wards and electoral divisions in the United Kingdom are electoral districts at sub-national level represented by one or more councillors. The ward is the primary unit of English electoral geography for civil parishes and borough and district councils, electoral ward is the unit used by Welsh principal councils, while the electoral division is the unit used by English county councils and some unitary authorities. Each ward/division has an average electorate of about 5,500 people, but ward-population counts can vary substantially. As at the end of 2014 there were 9,456 electoral wards/divisions in the UK.

Contents

Boundary changes to the electoral divisions will take effect at this election after a review of the county by the Local Government Boundary Commission for England. [2] This has led to an increase in the size of the Council from 49 to 50 and the splitting of former multi-member divisions.

The Local Government Boundary Commission for England (LGBCE) is a parliamentary body established by statute to conduct boundary, electoral and structural reviews of local government areas in England. The LGBCE is independent of government and political parties, and is directly accountable to the Speaker's Committee of the House of Commons.

Results

The Conservatives took control of the council, with all UKIP's seats lost. Labour had a 3-seat loss, and the Liberal Democrats took 2 seats. [3]

Conservative Party (UK) Political party in the United Kingdom

The Conservative Party, officially the Conservative and Unionist Party, is a centre-right political party in the United Kingdom. The governing party since 2010, it is the largest in the House of Commons, with 314 Members of Parliament, and also has 249 members of the House of Lords, 18 members of the European Parliament, 31 Members of the Scottish Parliament, 12 members of the Welsh Assembly, eight members of the London Assembly and 9,008 local councillors.

Liberal Democrats (UK) Political party in the United Kingdom

The Liberal Democrats are a liberal political party in the United Kingdom. They presently have 11 Members of Parliament in the House of Commons, 96 members of the House of Lords, and one member of the European Parliament. They also have five Members of the Scottish Parliament and a member each in the Welsh Assembly and London Assembly. The party reached the height of its influence in the early 2010s, forming a junior partner in a coalition government from 2010 to 2015. It is presently led by Vince Cable.

Election results

East Sussex County Council election, 2017 [4]
PartySeatsGainsLossesNet gain/lossSeats %Votes %Votes+/−
  Conservative 30100+106045.669,748+14
  Liberal Democrat 1110+12222.834,893+8
  Labour 403-3614.722,488+0.3
  Independent 300±064.26,381-1
 No description200±042.43,724N/A
  UKIP 007-703.65,479-23.7
  Green 000±00.05.88,803+2.8

Eastbourne

Devonshire

Devonshire
PartyCandidateVotes%±
Liberal Democrat Steve Wallis* 1,424 49.2
Conservative Robert Whippy65722.7
Labour Paul Howard46316
UKIP Rachel Large2328.1
Green Linda Wintle1174
Majority
Turnout 2,89332.00
Liberal Democrat hold Swing

Hampden Park

Hampden Park
PartyCandidateVotes%±
Liberal Democrat Colin Swansborough 1339
Conservative Mozmil Hussain632
Labour Dave Poole345
Green Ivor Heuting119
Majority
Turnout 2,16029.1
Liberal Democrat hold Swing

Langney

Langney
PartyCandidateVotes%±
Liberal Democrat Alan Shuttleworth* 1646
Conservative Christopher Whippy561
UKIP Ian Garbutt160
Labour Lee Comfort144
Green Rosana Jimenez44
Majority
Turnout
Liberal Democrat hold Swing

Meads

Meads
PartyCandidateVotes%±
Conservative Barry Taylor* 2213
Liberal Democrat Robin Maxted918
Labour Jean Couture236
Green Sally Boys187
UKIP Christopher Holloway157
Majority
Turnout
Conservative hold Swing

Old Town

Old Town
PartyCandidateVotes%±
Liberal Democrat John Ungar* 2074
Conservative Vivienne de Havilland-Geraghty1123
Labour Jake Lambert342
Green Alex Hough184
Majority
Turnout
Liberal Democrat hold Swing

Ratton

Ratton
PartyCandidateVotes%±
Conservative Colin Belsey* 2054
Liberal Democrat Marcus von Thiele697
Labour John Lambert256
UKIP Rex Kosters181
Green Pippa Oliphant95
Majority
Turnout
Conservative hold Swing

St Anthony's

St Anthony's
PartyCandidateVotes%±
Liberal Democrat David Tutt* 1834
Conservative Jamie Hollywood847
Labour Jackie Ferguson192
UKIP Colin Horscroft150
Green Nick Symons60
Majority
Turnout
Liberal Democrat hold Swing

Sovereign

Sovereign
PartyCandidateVotes%±
Conservative David Elkin* 1998
Liberal Democrat Kate Daly829
Labour Natasha Duursma195
Green Hugh Patrick83
Majority
Turnout
Conservative hold Swing

Upperton

Upperton
PartyCandidateVotes%±
Liberal Democrat Pat Rodohan* 1634
Conservative Diane Mulkeirins1254
Labour Paul Richards241
Green Dorothy Forsyth138
UKIP Amanda Sheehan116
Majority
Turnout
Liberal Democrat hold Swing

Hastings

Ashdown and Conquest

Ashdown and Conquest
PartyCandidateVotes%±
Conservative Peter Pragnell* 1599
Labour Co-op Eileen Masters720
Liberal Democrat Robert Wakeford190
Green Gabriel Carlyle71
Majority
Turnout
Conservative hold Swing

Baird and Ore

Baird and Ore
PartyCandidateVotes%±
Conservative Laurie Loe 1182
Labour Kim Forward1111
Liberal Democrat Katy Hunter-Burbridge112
Green Judy Scott97
Majority
Turnout
Conservative gain from Labour Swing

Braybrooke and Castle

Braybrooke and Castle
PartyCandidateVotes%±
Labour Godfrey Daniel* 1848
Conservative Rob Cooke684
Liberal Democrat Xan Brooker371
Green Andrea Needham252
Majority
Turnout
Labour hold Swing

Central St Leonards and Gensing

Central St Leonards and Gensing
PartyCandidateVotes%±
Labour Trevor Webb* 1520
Conservative Graeme Williams784
Green Paul Homer280
Liberal Democrat Tony Seymour247
Majority
Turnout
Labour hold Swing

Hollington and Wishing Tree

Hollington and Wishing Tree
PartyCandidateVotes%±
Labour Phil Scott* 1289
Conservative John Rankin795
Liberal Democrat Stephen Milton108
Green Arkady Johns103
Majority
Turnout
Labour hold Swing

Maze Hill and West St Leonards

Maze Hill and West St Leonards
PartyCandidateVotes%±
Conservative Matthew Beaver 1391
Labour Steve Thorpe807
Liberal Democrat Eve Montgomery285
Independent Diane Granger112
Green Thaddeus Skews94
Majority
Turnout
Conservative gain from Labour Swing

Old Hastings and Tressell

Old Hastings and Tressell
PartyCandidateVotes%±
Labour Tania Charman 1414
Conservative Claire Hammill740
Green Julia Hilton284
Liberal Democrat John Faulkner163
Majority
Turnout
Labour hold Swing

St Helens and Silverhill

St Helens and Silverhill
PartyCandidateVotes%±
Conservative Martin Clarke 1643
Labour Judy Rogers1228
Liberal Democrat Stewart Rayment258
Green Sally Phillips129
Majority
Turnout
Conservative gain from Labour Swing

Lewes

Chailey

Chailey
PartyCandidateVotes%±
Conservative Jim Sheppard* 1957
Liberal Democrat Peter Gardiner784
Labour Nicholas Belcher311
Green Holly Atkins200
Majority
Turnout
Conservative hold Swing

Lewes

Lewes
PartyCandidateVotes%±
Independent Ruth O'Keeffe 2370
Liberal Democrat Oliver Henman757
Labour Emily Clarke568
Green Tony Rowell302
Conservative Jane Slater263
Socialist Howard Pilott19
Majority
Turnout 52.61
Independent hold Swing

Newhaven and Bishopstone

Newhaven and Bishopstone
PartyCandidateVotes%±
Liberal Democrat Darren Grover1239
Conservative Pater Charlton1194
Labour Andrew Bryant319
UKIP Ian Buchanan227
Green Mark Bullock101
Independent Laurence Pulling92
Majority
Turnout 37.12
Liberal Democrat hold Swing

Ouse Valley West and Down

Ouse Valley West and Down
PartyCandidateVotes%±
Liberal Democrat Sarah Jane Osborne1722
Conservative Roy Burman1253
Labour Jerry Gould205
Green Anthony Shuster144
Majority
Turnout 43.09
Liberal Democrat gain from UKIP Swing

Peacehaven

Peacehaven
PartyCandidateVotes%±
Conservative Nigel Enever 1446
Labour Ciarron Clarkson720
UKIP Phil Howson310
Liberal Democrat Lee St Clair118
Green Lesley Orr77
Majority
Turnout
Conservative gain from UKIP Swing

Ringmer and Lewes Bridge

Ringmer and Lewes Bridge
PartyCandidateVotes%±
Liberal Democrat Philip Daniel1492
Green Johnny Denis1385
Conservative Paul Gander1116
Labour Belinda Chapman412
UKIP Tony Best121
Majority
Turnout 52.95
Liberal Democrat hold Swing

Seaford North

Seaford North
PartyCandidateVotes%±
Conservative Phil Boorman1767
Liberal Democrat Ian Cairns1000
Labour John Edson260
UKIP Eric Woodward232
Green Mary De Pleave119
Majority
Turnout 39.62
Conservative gain from UKIP Swing

Seaford South

Seaford South
PartyCandidateVotes%±
Liberal Democrat Carolyn Lambert* 1670
Conservative Sam Adeniji1494
Labour Steve Floor277
UKIP Pete Leeming172
Green Emily O'Brien105
Majority
Turnout 42.35
Liberal Democrat hold Swing

Telscombe

Telscombe
PartyCandidateVotes%±
Conservative Andy Smith 1575
Labour Julie Anne Vaughan723
UKIP Deborah Holt226
Liberal Democrat Charlie Carr222
Green Zoe Nicholson108
Majority
Turnout 33.14
Conservative gain from UKIP Swing

Rother

Battle and Crowhurst

Battle and Crowhurst
PartyCandidateVotes%±
Liberal Democrat Kathryn Field* 1465
Conservative Alistair Douglas1080
Labour Antonia Berelson357
UKIP Michael Phillips132
Majority
Turnout 40.23
Liberal Democrat hold Swing

Bexhill East

Bexhill East
PartyCandidateVotes%±
Independent Charles Clark* 919
Conservative Gillian Johnson801
Labour Roger McCarthy362
Liberal Democrat Diane Smith306
UKIP Geoffrey Bastin216
Majority
Turnout 32.98
Independent hold Swing

Bexhill North

Bexhill North
PartyCandidateVotes%±
Conservative Michael Ensor* 1275
Labour Andy Batsford798
Independent Helen Bridger382
UKIP Trevor Clements245
Liberal Democrat Graham Martin-Royle146
Turnout 35.50
Conservative hold Swing

Bexhill South

Bexhill South
PartyCandidateVotes%±
Conservative Simon Elford 1952
Labour Richard Sage741
Liberal Democrat Vivienne Bond459
UKIP Sheila Allen-Rodgers186
Majority
Turnout 35.83
Conservative gain from UKIP Swing

Bexhill West

Bexhill West
PartyCandidateVotes%±
Independent Stuart Earl* 2056
Conservative Martin Kenward1356
Labour Samuel Coleman290
Liberal Democrat Joel Kemp227
UKIP Alf Lovell148
Majority
Turnout 46.31
Independent hold Swing

Brede Valley and Marsham

Brede Valley and Marsham
PartyCandidateVotes%±
Conservative Carl Maynard* 2016
Labour Andy Ives414
Liberal Democrat Ian Stone408
UKIP Lynne Hehir173
Majority
Turnout 38.51
Conservative hold Swing

Northern Rother

Northern Rother
PartyCandidateVotes%±
Conservative Angharad Davies* 1719
Liberal Democrat Sue Prochak782
Labour Larry Hyett241
UKIP Edward Tuddenham177
Majority
Turnout 40.78
Conservative hold Swing

Rother North West

Rother North West
PartyCandidateVotes%±
Conservative John Barnes* 1686
UKIP Edward Smith157
Liberal Democrat Mary Varrall623
Labour Sara Watson254
Majority
Turnout 36.43
Conservative hold Swing

Rye and Eastern Rother

Rye and Eastern Rother
PartyCandidateVotes%±
Conservative Keith Glazier* 1697
UKIP Alison Phillips204
Labour Co-op Nigel Jennings641
Liberal Democrat Derek Greenup318
Green Adam Smith197
Majority
Turnout 38.48
Conservative hold Swing

Wealden

Alfriston, East Hoathly & Hellingly

Alfriston, East Hoathly & Hellingly
PartyCandidateVotes%±
Conservative Nick Bennett* 1706
Liberal Democrat Chris Bowers568
Green Kay Syrad217
Labour Anthony Fielding199
UKIP Chris Magness192
Majority
Turnout 38.02
Conservative hold Swing


At the previous election the UKIP candidate polled 29.4%

Crowborough North and Jarvis Brook

Crowborough North and Jarvis Brook
PartyCandidateVotes%±
Conservative Richard Stogdon* 1546
Liberal Democrat Karen Shaw439
Labour Sarah Newman292
Green Colin Stocks225
Majority1007
Turnout 32.27
Conservative hold Swing

Crowborough South and St Johns

Crowborough South and St Johns
PartyCandidateVotes%±
Conservative Sylvia Tidy* 1774
Liberal Democrat Adrian Morris441
Labour Brendan Clegg198
Green Gabrielle Symonds159
Majority
Turnout
Conservative hold Swing

Forest Row and Groomsbridge

Forest Row and Groomsbridge
PartyCandidateVotes%±
Conservative Francis Whetstone* 1468
Green Keith Obbard1406
Liberal Democrat Tessa Younger331
Majority
Turnout
Conservative hold Swing

At the previous election this seat also had UKIP and Labour candidates, who polled 28.9% and 5.7% respectively.

Hailsham Market

Hailsham Market
PartyCandidateVotes%±
Conservative Bob Bowdler 943
Liberal Democrat Alexa Clarke609
Labour Louise Orbell401
UKIP Laurence Keeley*353
Majority
Turnout
Conservative gain from UKIP Swing

Hailsham New Town

Hailsham New Town
PartyCandidateVotes%±
Conservative Gerard Fox 1283
Liberal Democrat Gavin Blake-Coggins634
Labour Mark Osborn364
Green Charlotte Still166
Majority
Turnout 29.51
Conservative hold Swing

Heathfield and Mayfield

Heathfield and Mayfield
PartyCandidateVotes%±
Conservative Rupert Simmons* 2217
Liberal Democrat Fraser Kerr374
Labour David Newman347
Green Clare Whistler202
Majority
Turnout 36.18
Conservative hold Swing

Maresfield and Buxted

Maresfield and Buxted
PartyCandidateVotes%±
Conservative Roy Galley* 2381
Liberal Democrat James Edwards453
Green Ian Tysh310n/a
Labour Gareth Looker278
Majority
Turnout
Conservative hold Swing

Pevensey and Stone Cross

Pevensey and Stone Cross
PartyCandidateVotes%±
Conservative Tom Liddiard 1161
UKIP Mike Pursglove*431
Independent Daniel Brookbank366
Liberal Democrat Wendy Dash272
Labour Tim MacPherson169
Green Iona Rowan59
Majority
Turnout
Conservative gain from UKIP Swing

Polegate and Watermill

Polegate and Watermill
PartyCandidateVotes%±
No descriptionDaniel Shing*1810
Conservative David Watts1017
Liberal Democrat Steve Murphy225
UKIP Bernie Goodwin175
Labour Alex Mthobi135
Green Peter Wright62
Majority
Turnout 38.91
No description hold Swing


Uckfield North

Uckfield North
PartyCandidateVotes%±
Conservative Claire Dowling* 1350
Liberal Democrat Paul Sparks815
Labour Robert Williams268
Green Melissa Tysh102
Majority
Turnout 35.54
Conservative hold Swing

Uckfield South with Framfield

Uckfield South with Framfield
PartyCandidateVotes%±
Conservative Chris Dowling* 1558
Liberal Democrat Paul Meakin552
Labour William Ball314
Green Pamela Tysh176
Majority
Turnout 37.41
Conservative hold Swing

At the last election the UKIP candidate polled 32.2%.

Wealden East

Wealden East
PartyCandidateVotes%±
Conservative Bill Bentley* 1973
Liberal Democrat Paul Coleshill614
Labour Jane Vinnicombe326
UKIP Hannah Shoubridge282
Green Eve Ashley257
Majority
Turnout 38.94
Conservative hold Swing

Wealden North East

Wealden North East
PartyCandidateVotes%±
Conservative Bob Standley* 1926
Liberal Democrat Beverley Johnstone407
Green Beth Martin285
Labour Christopher Morris206
Majority
Turnout 36.82
Conservative hold Swing

Willingdon and South Downs

Willingdon and South Downs
PartyCandidateVotes%±
No descriptionStephen Shing*1914
Conservative Douglas Murray1309
Liberal Democrat Christopher Hartley292
UKIP Maureen Goodwin124
Labour Jill Shacklock110
Green Jennifer Howells97
Majority
Turnout
No description hold Swing

Related Research Articles

Henley (UK Parliament constituency) Parliamentary constituency in the United Kingdom

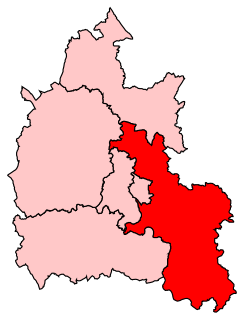
Henley is a constituency in Oxfordshire represented in the House of Commons of the UK Parliament since 2008 by John Howell, a member of the Conservative Party.

Copeland (UK Parliament constituency) Parliamentary constituency in the United Kingdom

Copeland is a constituency in the House of Commons of the UK Parliament created in 1983. The constituency is represented in Parliament by Trudy Harrison, of the Conservatives since a by-election in February 2017 and was retained at the snap 2017 general election four months later. The seat had been held by Labour candidates between 1983-2015.

Lewes District council in East Sussex, England is elected every four years. Since the last boundary changes in 2003, 41 councillors are elected from 21 wards.

Thanet District Council in Kent, England is elected every four years.

2013 West Sussex County Council election

The West Sussex County Council election, 2013 took place on 2 May 2013, as part of the United Kingdom local elections, 2013. All 71 electoral divisions were up for election, which returned one county councillor each by first-past-the-post voting for a four-year term of office. At this election, the Conservative Party was seeking to retain overall control of the council, and the Liberal Democrats to maintain their position as the main opposition party.

2013 East Sussex County Council election

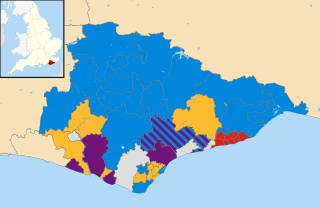
The East Sussex County Council election, 2013 took place on 2 May 2013 as part of the United Kingdom local elections, 2013. All 49 councillors of East Sussex County Council were elected from 44 electoral divisions, which return either one or two councillors each by first-past-the-post voting for a four-year term of office. The electoral divisions were the same as those used at the previous election in 2009. No elections were held in Brighton and Hove, which is a unitary authority outside the area covered by the County Council.

2013 Hampshire County Council election

An election to Hampshire County Council took place on 2 May 2013 as part of the United Kingdom local elections, 2013. 78 councillors were elected from 75 electoral divisions, which returned either one or two county councillors each by first-past-the-post voting for a four-year term of office. The electoral divisions were the same as those of the previous election in 2009. No elections were held in Portsmouth and Southampton, which are unitary authorities outside the area covered by the County Council. The election saw the Conservative Party retain overall control of the council, with a reduced majority of five councillors.

2013 Surrey County Council election

The Surrey County Council election, 2013 took place on 2 May 2013 as part of the United Kingdom local elections, 2013. 81 electoral divisions returned one county councillor each by first-past-the-post voting for a four-year term of office. Following a review, new electoral division boundaries were introduced for this election, increasing the number of councillors from 80 to 81.

2013 Hertfordshire County Council election

An election to Hertfordshire County Council took place on 2 May 2013 as part of the United Kingdom local elections, 2013. 77 electoral divisions elected one county councillor each by first-past-the-post voting for a four-year term of office. The electoral divisions were the same as those used at the previous election in 2009.

2013 Essex County Council election

An election to Essex County Council took place on 2 May 2013 as part of the United Kingdom local elections, 2013. 75 councillors were elected from 70 electoral divisions, which returned either one or two county councillors each by first-past-the-post voting for a four-year term of office. The electoral divisions were the same as those used at the previous election in 2009. No elections were held in Thurrock or Southend-on-Sea, which are unitary authorities outside the area covered by the County Council.

2013 Staffordshire County Council election

An election to Staffordshire County Council took place on 2 May 2013 as part of the United Kingdom local elections, 2013. 62 electoral divisions returned one county councillor each by first-past-the-post voting for a four-year term of office. Following a boundary review, new electoral division boundaries were established for this election. No elections were held in Stoke-on-Trent, which is a unitary authority outside the area covered by the County Council. The council continues to be administered on the Leader and Cabinet model.

2013 Buckinghamshire County Council election

An election to Buckinghamshire County Council took place on 2 May 2013 as part of the United Kingdom local elections, 2013. 49 councillors were elected from electoral divisions which returned one county councillor each by first-past-the-post voting for a four-year term of office. Following a boundary review, the size of the council was reduced from 57 to 49 members for this election. No elections were held in Milton Keynes, which is a unitary authority outside the area covered by the County Council. The council continues to be administered on the Leader and Cabinet model. The Conservative Party won a reduced majority on the council.

2013 Northamptonshire County Council election

An election to Northamptonshire County Council took place on 2 May 2013 as part of the United Kingdom local elections, 2013. Following a boundary review, the number of county councillors was reduced from 73 to 57 from this election. All members were elected by first-past-the-post voting from single-member electoral divisions for a four-year term of office. The Conservative Party held on to their overall majority, having held overall control of the council since 2005.

2017 Lancashire County Council election

An election to Lancashire County Council took place on 4 May 2017 as part of the 2017 local elections across the UK. All 84 councillors were elected for single-member and dual-member divisions for a four-year term of office. The system of voting used is first-past-the-post. Elections are held in all electoral divisions across the present ceremonial county, excepting Blackpool and Blackburn with Darwen which are unitary authorities.

2017 United Kingdom local elections

The 2017 United Kingdom local elections were held on Thursday 4 May 2017. Local elections were held across Great Britain, with elections to 35 English local authorities and all councils in Scotland and Wales.

2017 Essex County Council election

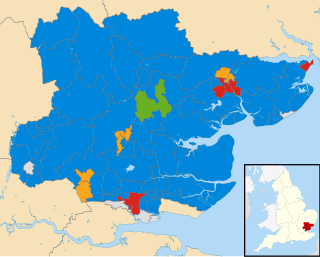
Elections to Essex County Council took place on 4 May 2017 as part of the 2017 local elections. All 75 councillors were elected from 70 electoral divisions, which each returned either one or two councillors by first-past-the-post voting for a four-year term of office.

2017 Lincolnshire County Council election

The 2017 Lincolnshire County Council election took place in non-metropolitan Lincolnshire on 4 May 2017 as part of the 2017 local elections in the United Kingdom. A total of 70 councillors were elected from each of the seven district councils that make up non-metropolitan Lincolnshire from 70 one member electoral divisions by first-past-the-post voting for a four-year term of office. The election did not include North Lincolnshire and North East Lincolnshire as they are separate unitary authorities.

2017 Surrey County Council election

The 2017 Surrey County Council election took place as part of the 2017 local elections in the UK. All 81 councillors were elected for single-member electoral divisions for a four-year term. The electoral system used is first-past-the-post voting.

2017 West Sussex County Council election

The 2017 West Sussex County Council election took place as part of the 2017 local elections in the UK. All councillors were elected for single-member electoral divisions for a four-year term. The voting system used was first-past-the-post.

2017 Cornwall Council election

The 2017 Cornwall Council election was held on 4 May 2017 as part of the 2017 local elections in the United Kingdom. 122 councillors were elected from the 121 electoral divisions of Cornwall Council, which returned either one or two councillors each by first-past-the-post voting for a four-year term of office. Although originally scheduled to take place on the same day, the election in the Bodmin St Petroc ward was countermanded following the death of Liberal Democrat candidate Steve Rogerson and was held on 8 June.

References

  1. "Upcoming elections & referendums". Electoral Commission. Retrieved 16 September 2016.
  2. "East Sussex County Council". Local Government Boundary Commission for England. Retrieved 16 September 2016.
  3. "East Sussex County Council - BBC News". BBC. Retrieved 5 May 2017.
  4. "East Sussex In Figures". [www.eastsussexinfigures.org.uk]. 5 May 2017. Retrieved 2017-05-05.