The 1998 Eastbourne Borough Council election took place on 7 May 1998 to elect members of Eastbourne Borough Council in East Sussex, England. One third of the council was up for election and the Liberal Democrats stayed in overall control of the council. [1]
Eastbourne is a town, seaside resort and borough in the non-metropolitan county of East Sussex on the south coast of England, 19 miles (31 km) east of Brighton. Eastbourne is immediately to the east of Beachy Head, the highest chalk sea cliff in Great Britain and part of the larger Eastbourne Downland Estate.
Borough status in the United Kingdom is granted by royal charter to local government districts in England, Wales and Northern Ireland. The status is purely honorary, and does not give any additional powers to the council or inhabitants of the district. In Scotland, similarly chartered communities were known as royal burghs, although the status is no longer granted.
East Sussex is a county in South East England. It is bordered by the counties of Kent to the north and east, Surrey to the north west and West Sussex to the west, and to the south by the English Channel.
After the election, the composition of the council was
2 seats were contested in Langney and Roselands wards after the resignation of the councillors Lesley Morris and John Ungar respectively. [2] Overall turnout at the election was 31.77%, down from 36.35% in 1996. [2]
Langney is a distinct part of Eastbourne, East Sussex and is on the eastern side of the popular seaside resort. The original village and priory have now been amalgamated with the main town of Eastbourne, and Langney was identified as a single self-contained polling ward within the borough of Eastbourne until 2002.
A Councillor is a member of a local government council.
Voter turnout is the percentage of eligible voters who cast a ballot in an election. Eligibility varies by country, and the voting-eligible population should not be confused with the total adult population. Age and citizenship status are often among the criteria used to determine eligibility, but some countries further restrict eligibility based on sex, race, or religion.
Party | Seats | Gains | Losses | Net gain/loss | Seats % | Votes % | Votes | +/− | |
---|---|---|---|---|---|---|---|---|---|
Liberal Democrat | 6 | 0 | 3 | -3 | 50.0 | 48.2 | 11,993 | ||
Conservative | 6 | 3 | 0 | +3 | 50.0 | 40.0 | 9,949 | ||
Labour | 0 | 0 | 0 | 0 | 0 | 10.2 | 2,549 | ||
Independent | 0 | 0 | 0 | 0 | 0 | 1.0 | 250 | ||
Liberal | 0 | 0 | 0 | 0 | 0 | 0.5 | 133 |
Party | Candidate | Votes | % | ± | |
---|---|---|---|---|---|
Conservative | Sheila Charlton | 737 | 42.8 | ||
Liberal Democrat | Beverley Berry | 735 | 42.7 | ||
Labour | Jacqueline Frisby | 249 | 14.5 | ||
Majority | 2 | 0.1 | |||
Turnout | 1,721 | 31.1 | |||
Conservative hold | Swing |
Party | Candidate | Votes | % | ± | |
---|---|---|---|---|---|
Liberal Democrat | Albert Leggett | 1,337 | 69.5 | ||
Conservative | Christian Usher | 399 | 20.7 | ||
Labour | Robert Rossetter | 188 | 9.8 | ||
Majority | 938 | 48.8 | |||
Turnout | 1,924 | 32.3 | |||
Liberal Democrat hold | Swing |
Party | Candidate | Votes | % | ± | |
---|---|---|---|---|---|
Liberal Democrat | Mary Pooley | 1,039 | 59.6 | ||
Labour | Alan French | 453 | 26.0 | ||
Conservative | Jeanie Sowerby | 251 | 14.4 | ||
Majority | 586 | 33.6 | |||
Turnout | 1,743 | 28.7 | |||
Liberal Democrat hold | Swing |
Party | Candidate | Votes | % | ± | |
---|---|---|---|---|---|
Liberal Democrat | Gary Potter | 1,413 | |||
Liberal Democrat | Robert Kerr | 1,383 | |||
Conservative | Ronald Hedger | 478 | |||
Conservative | Leonard Meladio | 412 | |||
Labour | Agnes Reid | 307 | |||
Independent | Steven Wallis | 250 | |||
Turnout | 4,243 | 23.1 | |||
Liberal Democrat hold | Swing | ||||
Liberal Democrat hold | Swing |
Party | Candidate | Votes | % | ± | |
---|---|---|---|---|---|
Conservative | Barry Taylor | 1,875 | 74.0 | ||
Liberal Democrat | Shirley Bloom | 658 | 26.0 | ||
Majority | 1,217 | 48.0 | |||
Turnout | 2,533 | 38.4 | |||
Conservative hold | Swing |
Party | Candidate | Votes | % | ± | |
---|---|---|---|---|---|
Conservative | Mark Neeham | 995 | 48.6 | ||
Liberal Democrat | Walter James | 900 | 43.9 | ||
Labour | John Morrison | 154 | 7.5 | ||
Majority | 95 | 4.6 | |||
Turnout | 2,049 | 37.1 | |||
Conservative gain from Liberal Democrat | Swing | ||||
Party | Candidate | Votes | % | ± | |
---|---|---|---|---|---|
Conservative | Frederick Higgins | 1,384 | 62.4 | ||
Liberal Democrat | John Harris | 444 | 20.0 | ||
Labour | John Pettigrew | 256 | 11.5 | ||
Liberal | Mona-Theresia Williamson | 133 | 6.0 | ||
Majority | 940 | 42.4 | |||
Turnout | 2,217 | 35.5 | |||
Conservative hold | Swing |
Party | Candidate | Votes | % | ± | |
---|---|---|---|---|---|
Liberal Democrat | Beryl Healy | 1,269 | |||
Liberal Democrat | Neil Stanley | 1,070 | |||
Conservative | Roger Gristwood | 434 | |||
Conservative | Roger Wesson | 383 | |||
Labour | Emile Habets | 222 | |||
Labour | Jonathan Pettigrew | 216 | |||
Turnout | 3,594 | 28.9 | |||
Liberal Democrat hold | Swing | ||||
Liberal Democrat hold | Swing |
Party | Candidate | Votes | % | ± | |
---|---|---|---|---|---|
Conservative | Robert Backhouse | 1,419 | 54.1 | ||
Liberal Democrat | James Gleeson | 907 | 34.6 | ||
Labour | John Carmody | 295 | 11.3 | ||
Majority | 512 | 19.5 | |||
Turnout | 2,621 | 33.8 | |||
Conservative gain from Liberal Democrat | Swing | ||||
Party | Candidate | Votes | % | ± | |
---|---|---|---|---|---|
Conservative | Robert Lacey | 1,182 | 53.0 | ||
Liberal Democrat | Brian Whitby | 838 | 37.6 | ||
Labour | Eileen Cronin | 209 | 9.4 | ||
Majority | 344 | 15.4 | |||
Turnout | 2,229 | 33.2 | |||
Conservative gain from Liberal Democrat | Swing | ||||
A by-election was held on 3 September 1998 in Ratton ward after the resignation of Scott Stevens. [2] Conservative Barbara Goodall gained the seat from the Liberal Democrats. [2]
By-elections, also spelled bye-elections, are used to fill elected offices that have become vacant between general elections.
The Conservative Party, officially the Conservative and Unionist Party, is a centre-right political party in the United Kingdom. The governing party since 2010, it is the largest in the House of Commons, with 314 Members of Parliament, and also has 249 members of the House of Lords, 18 members of the European Parliament, 31 Members of the Scottish Parliament, 12 members of the Welsh Assembly, eight members of the London Assembly and 9,008 local councillors.
Party | Candidate | Votes | % | ± | |
---|---|---|---|---|---|
Conservative | Barbara Goodall | 1,183 | 57.4 | ||
Liberal Democrat | Jon Harris | 741 | 36.0 | ||
Labour | Robert Rossetter | 134 | 6.5 | ||
Majority | 442 | 21.4 | |||
Turnout | 2,058 | 32.6 | |||
Conservative gain from Liberal Democrat | Swing | ||||
The 1998 Bolton Metropolitan Borough Council election took place on 7 May 1998 to elect members of Bolton Metropolitan Borough Council in Greater Manchester, England. One third of the council was up for election and the Labour party kept overall control of the council.
The 2006 Barnet Council election took place on 4 May 2006 to elect members of Barnet London Borough Council in London, England. The whole council was up for election and the Conservative party stayed in overall control of the council.
The 1998 Solihull Metropolitan Borough Council election took place on 7 May 1998 to elect members of Solihull Metropolitan Borough Council in the West Midlands, England. One third of the council was up for election and the council stayed under no overall control.
The 1998 Brent London Borough Council election took place on 7 May 1998 to elect members of Brent London Borough Council in London, England. The whole council was up for election and the Labour party gained overall control of the council from no overall control.
The 2006 Harrogate Council election took place on 4 May 2006 to elect members of Harrogate Borough Council in North Yorkshire, England. One third of the council was up for election and the Conservative party lost overall control of the council to no overall control.
The 1998 Pendle Borough Council election took place on 7 May 1998 to elect members of Pendle Borough Council in Lancashire, England. One third of the council was up for election and the Liberal Democrats stayed in overall control of the council.
The 2007 Maidstone Borough Council election took place on 3 May 2007 to elect members of Maidstone Borough Council in Kent, England. One third of the council was up for election and the council stayed under no overall control.
The 2008 Maidstone Borough Council election took place on 1 May 2008 to elect members of Maidstone Borough Council in Kent, England. One third of the council was up for election and the Conservative party gained overall control of the council from no overall control.
The 1999 Eastbourne Borough Council election took place on 6 May 1999 to elect members of Eastbourne Borough Council in East Sussex, England. One third of the council was up for election and the Liberal Democrats lost overall control of the council to no overall control.
The 2002 Eastbourne Borough Council election took place on 2 May 2002 to elect members of Eastbourne Borough Council in East Sussex, England. The whole council was up for election with boundary changes since the last election in 2000 reducing the number of seats by 3. The Liberal Democrats gained overall control of the council from the Conservative party.
The 2003 Eastbourne Borough Council election took place on 1 May 2003 to elect members of Eastbourne Borough Council in East Sussex, England. One third of the council was up for election and the Liberal Democrats stayed in overall control of the council.
The 2004 Eastbourne Borough Council election took place on 10 June 2004 to elect members of Eastbourne Borough Council in East Sussex, England. One third of the council was up for election and the Conservative party gained overall control of the council from the Liberal Democrats.
The 2006 Eastbourne Council election took place on 4 May 2006 to elect members of Eastbourne Borough Council in East Sussex, England. One third of the council was up for election and the Conservative party stayed in overall control of the council.
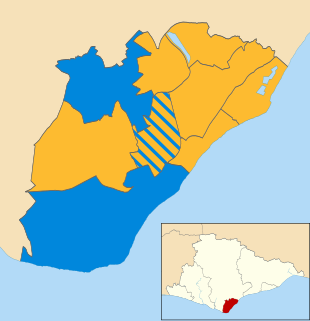
The 2007 Eastbourne Borough Council election took place on 3 May 2007 to elect members of Eastbourne Borough Council in East Sussex, England. The whole council was up for election and the Liberal Democrats gained overall control of the council from the Conservative party.
The 2011 Eastbourne Borough Council election took place on 5 May 2011 to elect members of Eastbourne Borough Council in East Sussex, England. The whole council was up for election and the Liberal Democrats stayed in overall control of the council.
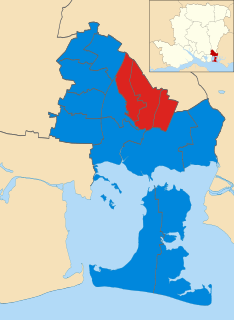
The 2012 Havant Borough Council election took place on 3 May 2012 to elect members of Havant Borough Council in Hampshire, England. One third of the council was up for election and the Conservative party stayed in overall control of the council.
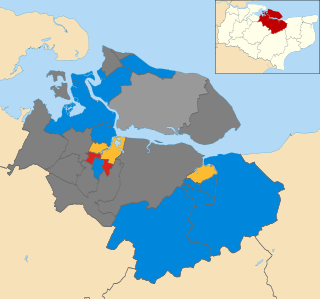
The 2008 Swale Borough Council election took place on 1 May 2008 to elect members of Swale Borough Council in Kent, England. One third of the council was up for election and the Conservative party stayed in overall control of the council.
The 2003 Christchurch Borough Council election took place on 1 May 2003 to elect members of Christchurch Borough Council in Dorset, England. The whole council was up for election after boundary changes reduced the number of seats by one. The Conservative party stayed in overall control of the council.
The 2007 Christchurch Borough Council election took place on 3 May 2007 to elect members of Christchurch Borough Council in Dorset, England. The whole council was up for election and the Conservative party stayed in overall control of the council.
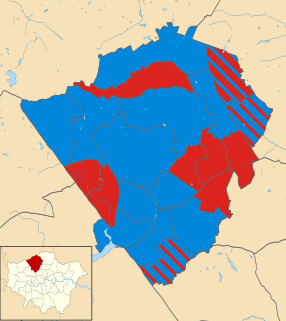
The 2018 Barnet Council election took place on 3 May 2018 to elect members of Barnet Borough Council in England. It took place on the same day as other local elections in 2018. In the last election, the Conservatives won control of the council with 32 seats, compared to 30 for Labour and 1 for the Liberal Democrats. On 15 March 2018, following the resignation of a Conservative councillor, the council was in a state of no overall control. The election on 3 May 2018 saw the Conservatives take back overall control with a majority of 13.