The 1999 Eastbourne Borough Council election took place on 6 May 1999 to elect members of Eastbourne Borough Council in East Sussex, England. One third of the council was up for election and the Liberal Democrats lost overall control of the council to no overall control. [1]
Eastbourne is a town, seaside resort and borough in the non-metropolitan county of East Sussex on the south coast of England, 19 miles (31 km) east of Brighton. Eastbourne is immediately to the east of Beachy Head, the highest chalk sea cliff in Great Britain and part of the larger Eastbourne Downland Estate.
Borough status in the United Kingdom is granted by royal charter to local government districts in England, Wales and Northern Ireland. The status is purely honorary, and does not give any additional powers to the council or inhabitants of the district. In Scotland, similarly chartered communities were known as royal burghs, although the status is no longer granted.
East Sussex is a county in South East England. It is bordered by the counties of Kent to the north and east, Surrey to the north west and West Sussex to the west, and to the south by the English Channel.
After the election, the composition of the council was
The Conservative party gained two seats from the Liberal Democrats to move the two parties level on 15 seats each. [3] [4] This was the first time the Liberal Democrats had not had a majority in eight years, [4] but they retained control through the mayor's casting vote. [3] Overall turnout at the election was 32.36%, slightly up on the 31.77% at the 1998 election. [3]
The Conservative Party, officially the Conservative and Unionist Party, is a centre-right political party in the United Kingdom. The governing party since 2010, it is the largest in the House of Commons, with 314 Members of Parliament, and also has 249 members of the House of Lords, 18 members of the European Parliament, 31 Members of the Scottish Parliament, 12 members of the Welsh Assembly, eight members of the London Assembly and 9,008 local councillors.
In England, the offices of mayor and lord mayor have long been ceremonial posts, with few or no duties attached to them. In recent years they have doubled as more influential political roles while retaining the ceremonial functions. A mayor's term of office denotes the municipal year. The most famous example is that of the Lord Mayor of the City of London.
A casting vote is a vote that someone may exercise to resolve a deadlock. A casting vote is typically by the presiding officer of a council, legislative body, committee, etc., and may only be exercised to break a deadlock. Examples of officers who hold casting votes are the Speaker of the British House of Commons and the President of the United States Senate.
Party | Seats | Gains | Losses | Net gain/loss | Seats % | Votes % | Votes | +/− | |
---|---|---|---|---|---|---|---|---|---|
Conservative | 5 | 2 | 0 | +2 | 50.0 | 46.0 | 9,992 | +6.0% | |
Liberal Democrat | 5 | 0 | 2 | -2 | 50.0 | 42.4 | 9,206 | -5.8% | |
Labour | 0 | 0 | 0 | 0 | 0 | 10.4 | 2,265 | +0.2% | |
Liberal | 0 | 0 | 0 | 0 | 0 | 0.7 | 149 | +0.2% | |
Green | 0 | 0 | 0 | 0 | 0 | 0.5 | 116 | +0.5% |
Party | Candidate | Votes | % | ± | |
---|---|---|---|---|---|
Conservative | Mark Roberts | 839 | 45.0 | +2.2 | |
Liberal Democrat | Brian Jones | 812 | 43.6 | +0.9 | |
Labour | Barrie Smith | 213 | 11.4 | -3.1 | |
Majority | 27 | 1.4 | +1.3 | ||
Turnout | 1,864 | 33.9 | +2.8 | ||
Conservative gain from Liberal Democrat | Swing | ||||
Party | Candidate | Votes | % | ± | |
---|---|---|---|---|---|
Liberal Democrat | Maurice Skilton | 1,219 | 61.5 | -8.0 | |
Conservative | John Stanbury | 615 | 31.0 | +10.3 | |
Labour | Steven Wallis | 148 | 7.5 | -2.3 | |
Majority | 604 | 30.5 | -18.3 | ||
Turnout | 1,982 | 34.1 | +1.8 | ||
Liberal Democrat hold | Swing |
Party | Candidate | Votes | % | ± | |
---|---|---|---|---|---|
Liberal Democrat | Olive Woodall | 1,035 | 58.4 | -1.2 | |
Labour | Alan French | 407 | 23.0 | -3.0 | |
Conservative | Jeanie Sowerby | 329 | 18.6 | +4.2 | |
Majority | 628 | 35.5 | +1.9 | ||
Turnout | 1,771 | 29.2 | +0.5 | ||
Liberal Democrat hold | Swing |
Party | Candidate | Votes | % | ± | |
---|---|---|---|---|---|
Liberal Democrat | Beverley Berry | 1,464 | 62.8 | ||
Conservative | Len Meladio | 567 | 24.3 | ||
Labour | Agnes Reid | 299 | 12.8 | ||
Majority | 897 | 38.5 | |||
Turnout | 2,330 | 23.5 | +0.4 | ||
Liberal Democrat hold | Swing |
Party | Candidate | Votes | % | ± | |
---|---|---|---|---|---|
Conservative | David Stevens | 1,841 | 73.8 | -0.2 | |
Liberal Democrat | Margaret Ticehurst | 358 | 14.4 | -11.6 | |
Labour | Peter Worster | 179 | 7.2 | +7.2 | |
Green | Sally Boys | 116 | 4.7 | +4.7 | |
Majority | 1,483 | 59.5 | +11.5 | ||
Turnout | 2,494 | 37.4 | -1.0 | ||
Conservative hold | Swing |
Party | Candidate | Votes | % | ± | |
---|---|---|---|---|---|
Liberal Democrat | Ron Parsons | 1,121 | 47.6 | +3.7 | |
Conservative | Sandie Howlett | 1,108 | 47.1 | -1.5 | |
Labour | James Brook | 125 | 5.3 | -2.2 | |
Majority | 13 | 0.6 | |||
Turnout | 2,354 | 42.6 | +5.5 | ||
Liberal Democrat hold | Swing |
Party | Candidate | Votes | % | ± | |
---|---|---|---|---|---|
Conservative | Barbara Goodall | 1,376 | 63.9 | +1.5 | |
Liberal Democrat | Jon Harris | 425 | 19.7 | -0.3 | |
Labour | Emile Habets | 204 | 9.5 | -2.0 | |
Liberal | Maria-Theresia Williamson | 149 | 6.9 | +0.9 | |
Majority | 951 | 44.2 | +1.8 | ||
Turnout | 2,154 | 34.7 | -0.8 | ||
Conservative hold | Swing |
Party | Candidate | Votes | % | ± | |
---|---|---|---|---|---|
Liberal Democrat | Neil Stanley | 1,293 | 66.5 | ||
Conservative | Roger Gristwood | 444 | 22.9 | ||
Labour | Jonathan Pettigrew | 206 | 10.6 | ||
Majority | 849 | 43.7 | |||
Turnout | 1,943 | 29.1 | +0.2 | ||
Liberal Democrat hold | Swing |
Party | Candidate | Votes | % | ± | |
---|---|---|---|---|---|
Conservative | Patrick Bowker | 1,499 | 54.2 | +0.1 | |
Liberal Democrat | Richard Ellis | 999 | 36.1 | +1.5 | |
Labour | Robert Rossetter | 267 | 9.7 | -1.6 | |
Majority | 500 | 18.1 | -1.4 | ||
Turnout | 2,765 | 34.4 | +0.6 | ||
Conservative gain from Liberal Democrat | Swing | ||||
Party | Candidate | Votes | % | ± | |
---|---|---|---|---|---|
Conservative | Graham Marsden | 1,374 | 66.3 | +13.3 | |
Liberal Democrat | Linda Beckmann | 480 | 23.2 | -14.4 | |
Labour | Eileen Cronin | 217 | 10.5 | +1.1 | |
Majority | 894 | 43.2 | +27.8 | ||
Turnout | 2,071 | 30.7 | -2.5 | ||
Conservative hold | Swing |
The 1999 Woking Council election took place on 6 May 1999 to elect members of Woking Borough Council in Surrey, England.
The 1999 Solihull Metropolitan Borough Council election took place on 6 May 1999 to elect members of Solihull Metropolitan Borough Council in the West Midlands, England. One third of the council was up for election and the council stayed under no overall control.
The 1998 Pendle Borough Council election took place on 7 May 1998 to elect members of Pendle Borough Council in Lancashire, England. One third of the council was up for election and the Liberal Democrats stayed in overall control of the council.
The 1999 Pendle Borough Council election took place on 6 May 1999 to elect members of Pendle Borough Council in Lancashire, England. One third of the council was up for election and the Liberal Democrats lost overall control of the council to no overall control.
The 2004 Pendle Borough Council election took place on 10 June 2004 to elect members of Pendle Borough Council in Lancashire, England. One third of the council was up for election and the Liberal Democrats gained overall control of the council from no overall control.
The 2007 Pendle Borough Council election took place on 3 May 2007 to elect members of Pendle Borough Council in Lancashire, England. One third of the council was up for election and the Liberal Democrats stayed in overall control of the council.
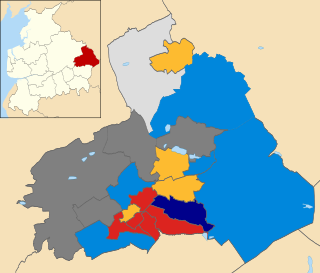
The 2008 Pendle Borough Council election took place on 1 May 2008 to elect members of Pendle Borough Council in Lancashire, England. One third of the council was up for election and the Liberal Democrats lost overall control of the council to no overall control.
The 1999 Sandwell Metropolitan Borough Council election took place on 6 May 1999 to elect members of Sandwell Metropolitan Borough Council in the West Midlands, England. One third of the council was up for election and the Labour party stayed in overall control of the council.
The 2010 Amber Valley Borough Council election took place on 6 May 2010 to elect members of Amber Valley Borough Council in Derbyshire, England. One third of the council was up for election and the Conservative party stayed in overall control of the council.
The 2007 Basingstoke and Deane Council election took place on 3 May 2007 to elect members of Basingstoke and Deane Borough Council in Hampshire, England. One third of the council was up for election and the Conservative party stayed in overall control of the council.
The 2000 Eastbourne Borough Council election took place on 4 May 2000 to elect members of Eastbourne Borough Council in East Sussex, England. One third of the council was up for election and the Conservative party gained overall control of the council from no overall control.
The 2002 Eastbourne Borough Council election took place on 2 May 2002 to elect members of Eastbourne Borough Council in East Sussex, England. The whole council was up for election with boundary changes since the last election in 2000 reducing the number of seats by 3. The Liberal Democrats gained overall control of the council from the Conservative party.
The 2003 Eastbourne Borough Council election took place on 1 May 2003 to elect members of Eastbourne Borough Council in East Sussex, England. One third of the council was up for election and the Liberal Democrats stayed in overall control of the council.
The 2004 Eastbourne Borough Council election took place on 10 June 2004 to elect members of Eastbourne Borough Council in East Sussex, England. One third of the council was up for election and the Conservative party gained overall control of the council from the Liberal Democrats.
The 2006 Eastbourne Council election took place on 4 May 2006 to elect members of Eastbourne Borough Council in East Sussex, England. One third of the council was up for election and the Conservative party stayed in overall control of the council.
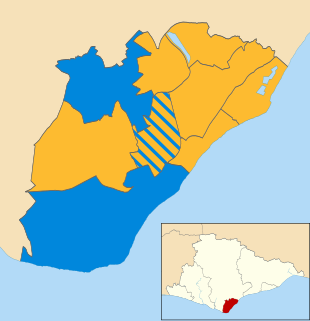
The 2007 Eastbourne Borough Council election took place on 3 May 2007 to elect members of Eastbourne Borough Council in East Sussex, England. The whole council was up for election and the Liberal Democrats gained overall control of the council from the Conservative party.
The 2011 Eastbourne Borough Council election took place on 5 May 2011 to elect members of Eastbourne Borough Council in East Sussex, England. The whole council was up for election and the Liberal Democrats stayed in overall control of the council.
The 2011 Wealden District Council election took place on 5 May 2011 to elect members of Wealden District Council in East Sussex, England. The whole council was up for election and the Conservative party stayed in overall control of the council.
The 2012 Pendle Borough Council election took place on 3 May 2012 to elect members of Pendle Borough Council in Lancashire, England. One third of the council was up for election and the council stayed under no overall control.
The 2015 Christchurch Borough Council election took place on 7 May 2015 to elect members of Christchurch Borough Council in Dorset, England. The whole council was up for election and the Conservative party stayed in overall control of the council.