The 1999 Wolverhampton Metropolitan Borough Council election took place on 6 May 1999 to elect members of Wolverhampton Metropolitan Borough Council in the West Midlands, England. One third of the council was up for election and the Labour party kept overall control of the council. [1] Overall turnout in the election was 30.63%. [2]
Wolverhampton is a city and metropolitan borough in the West Midlands, England. At the 2011 census, it had a population of 249,470. The demonym for people from the city is 'Wulfrunian'.
A metropolitan borough is a type of local government district in England, and is a subdivision of a metropolitan county. Created in 1974 by the Local Government Act 1972, metropolitan boroughs are defined in English law as metropolitan districts. However, all of them have been granted or regranted royal charters to give them borough status. Metropolitan boroughs have been effectively unitary authority areas since the abolition of the metropolitan county councils by the Local Government Act 1985. However, metropolitan boroughs pool much of their authority in joint boards and other arrangements that cover whole metropolitan counties, such as combined authorities.
The West Midlands is a metropolitan county in western-central England with a 2014 estimated population of 2,808,356, making it the second most populous county in England after Greater London. It came into existence as a metropolitan county in 1974 after the passage of the Local Government Act 1972, formed from parts of Staffordshire, Worcestershire and Warwickshire. The county itself is a NUTS 2 region within the wider NUTS 1 region of the same name. The county consists of seven metropolitan boroughs: the City of Birmingham, the City of Coventry and the City of Wolverhampton, as well as the boroughs of Dudley, Sandwell, Solihull and Walsall.
After the election, the composition of the council was
The results saw Labour keep its majority on the council but lose four seats to other parties. [4] The Conservatives gained seats in Bushbury, Merry Hill and Park wards, while the Liberal Democrats gained in Spring Vale. [4]
The Conservative Party, officially the Conservative and Unionist Party, is a centre-right political party in the United Kingdom. The governing party since 2010, it is the largest in the House of Commons, with 313 Members of Parliament, and also has 249 members of the House of Lords, 18 members of the European Parliament, 31 Members of the Scottish Parliament, 12 members of the Welsh Assembly, eight members of the London Assembly and 8,916 local councillors.
Bushbury is a suburb of Wolverhampton, West Midlands, England. It lies two miles north-east of Wolverhampton city centre, divided between the Bushbury North and Bushbury South and Low Hill wards.
Merry Hill is a suburb of Wolverhampton, West Midlands and a ward of Wolverhampton City Council. It is situated in the south-west of the city, bordering South Staffordshire and the Tettenhall Wightwick, Park, Graiseley and Penn wards. It forms part of the Wolverhampton South West constituency.
Party | Seats | Gains | Losses | Net gain/loss | Seats % | Votes % | Votes | +/− | |
---|---|---|---|---|---|---|---|---|---|
Labour | 12 | 0 | 4 | -4 | 60.0 | 47.7 | 26,620 | +0.6% | |
Conservative | 7 | 3 | 0 | +3 | 35.0 | 39.0 | 21,734 | +1.1% | |
Liberal Democrat | 1 | 1 | 0 | +1 | 5.0 | 11.5 | 6,396 | -1.4% | |
Liberal | 0 | 0 | 0 | 0 | 0 | 1.9 | 1,055 | +0.2% |
Party | Candidate | Votes | % | ± | |
---|---|---|---|---|---|
Labour | Thomas Turner | 1,191 | 66.1 | +0.8 | |
Conservative | Arthur Mills | 375 | 20.8 | +1.3 | |
Liberal Democrat | Edward Pringle | 236 | 13.1 | -2.0 | |
Majority | 816 | 45.3 | -0.5 | ||
Turnout | 1,802 | 22.1 | +1.4 | ||
Labour hold | Swing |
Party | Candidate | Votes | % | ± | |
---|---|---|---|---|---|
Labour | Margaret Benton | 1,292 | 53.4 | -0.8 | |
Conservative | Alwyne Murray | 907 | 37.5 | +0.0 | |
Liberal Democrat | Michael Rowan | 222 | 9.2 | +0.9 | |
Majority | 385 | 15.9 | -0.8 | ||
Turnout | 2,421 | 23.2 | -0.9 | ||
Labour hold | Swing |
Party | Candidate | Votes | % | ± | |
---|---|---|---|---|---|
Labour | Judith Rowley | 2,197 | 72.6 | -3.8 | |
Conservative | John Corns | 670 | 22.1 | +4.9 | |
Liberal Democrat | June Hemsley | 158 | 5.2 | -1.2 | |
Majority | 1,527 | 50.5 | -8.7 | ||
Turnout | 3,025 | 34.5 | +3.2 | ||
Labour hold | Swing |
Party | Candidate | Votes | % | ± | |
---|---|---|---|---|---|
Conservative | Christine Riddle | 1,295 | 49.3 | -1.7 | |
Labour | James O'Grady | 1,110 | 42.2 | +2.1 | |
Liberal Democrat | David Buckley | 224 | 8.5 | -0.4 | |
Majority | 185 | 7.1 | -3.8 | ||
Turnout | 2,629 | 29.8 | +0.4 | ||
Conservative gain from Labour | Swing | ||||
Party | Candidate | Votes | % | ± | |
---|---|---|---|---|---|
Labour | Francis Docherty | 1,305 | 68.9 | +2.2 | |
Conservative | Maxine Bradley | 414 | 21.8 | -1.1 | |
Liberal Democrat | Ann Whitehouse | 176 | 9.3 | -1.1 | |
Majority | 891 | 47.1 | +3.3 | ||
Turnout | 1,895 | 23.1 | -1.1 | ||
Labour hold | Swing |
Party | Candidate | Votes | % | ± | |
---|---|---|---|---|---|
Labour | Alan Smith | 1,399 | 71.9 | +1.6 | |
Conservative | Matthew Green | 390 | 20.1 | -1.4 | |
Liberal Democrat | Eileen Birch | 156 | 8.0 | -0.2 | |
Majority | 1,009 | 51.8 | +3.0 | ||
Turnout | 1,945 | 23.6 | +2.2 | ||
Labour hold | Swing |
Party | Candidate | Votes | % | ± | |
---|---|---|---|---|---|
Labour | Geoffrey Foster | 1,302 | 49.8 | +0.9 | |
Conservative | Kenneth Hodges | 1,033 | 39.5 | +1.3 | |
Liberal Democrat | Anthony Bourke | 278 | 10.6 | -2.3 | |
Majority | 269 | 10.3 | -0.4 | ||
Turnout | 2,613 | 31.9 | +1.9 | ||
Labour hold | Swing |
Party | Candidate | Votes | % | ± | |
---|---|---|---|---|---|
Conservative | John Mellor | 1,934 | 48.2 | +12.6 | |
Labour | Louise Miles | 1,916 | 47.7 | -4.0 | |
Liberal Democrat | Mary Millar | 166 | 4.1 | -5.0 | |
Majority | 18 | 0.5 | |||
Turnout | 4,016 | 43.6 | +5.8 | ||
Conservative hold | Swing |
Party | Candidate | Votes | % | ± | |
---|---|---|---|---|---|
Labour | Malkinderpal Jaspal | 914 | 48.8 | -11.9 | |
Liberal | Colin Hallmark | 658 | 35.1 | +9.5 | |
Conservative | Brenda Wilson | 300 | 16.0 | +2.3 | |
Majority | 256 | 13.7 | -21.4 | ||
Turnout | 1,872 | 23.3 | -2.0 | ||
Labour hold | Swing |
Party | Candidate | Votes | % | ± | |
---|---|---|---|---|---|
Labour | Peter O'Neill | 1,158 | 72.3 | +5.9 | |
Conservative | Paul Cook | 336 | 21.0 | -1.7 | |
Liberal Democrat | John Stocking | 108 | 6.7 | -4.1 | |
Majority | 822 | 51.3 | +7.6 | ||
Turnout | 1,602 | 18.2 | -0.6 | ||
Labour hold | Swing |
Party | Candidate | Votes | % | ± | |
---|---|---|---|---|---|
Conservative | Wayne Lawley | 1,848 | 57.0 | +1.7 | |
Labour | Carl Smith | 1,059 | 32.7 | +1.2 | |
Liberal Democrat | William Beard | 333 | 10.3 | -2.9 | |
Majority | 789 | 24.3 | +0.5 | ||
Turnout | 3,240 | 33.9 | +1.0 | ||
Conservative gain from Labour | Swing | ||||
Party | Candidate | Votes | % | ± | |
---|---|---|---|---|---|
Labour | Ian Brookfield | 1,504 | 53.8 | +5.8 | |
Conservative | David Meredith | 986 | 35.3 | -2.1 | |
Liberal Democrat | Ian Jenkins | 305 | 10.9 | -1.0 | |
Majority | 518 | 18.5 | +7.9 | ||
Turnout | 2,795 | 29.4 | +1.7 | ||
Labour hold | Swing |
Party | Candidate | Votes | % | ± | |
---|---|---|---|---|---|
Conservative | Geoffrey Patten | 1,744 | 45.5 | -1.3 | |
Labour | John Potts | 1,712 | 44.6 | +2.1 | |
Liberal Democrat | Brian Lewis | 381 | 9.9 | -0.8 | |
Majority | 32 | 0.9 | -3.4 | ||
Turnout | 3,837 | 37.1 | +1.3 | ||
Conservative gain from Labour | Swing | ||||
Party | Candidate | Votes | % | ± | |
---|---|---|---|---|---|
Conservative | Patricia Bradley | 2,137 | 53.9 | -1.5 | |
Labour | Barry Thomas | 1,522 | 38.4 | +2.5 | |
Liberal Democrat | Paul Beeston | 305 | 7.7 | -1.0 | |
Majority | 615 | 15.5 | -4.0 | ||
Turnout | 3,964 | 40.2 | -0.7 | ||
Conservative hold | Swing |
Party | Candidate | Votes | % | ± | |
---|---|---|---|---|---|
Labour | Roger Lawrence | 1,906 | 70.9 | +6.1 | |
Liberal Democrat | Paul Hodson | 448 | 16.7 | +2.8 | |
Conservative | Rina Nayer | 336 | 12.5 | -8.7 | |
Majority | 1,458 | 54.2 | +10.6 | ||
Turnout | 2,690 | 27.8 | +2.8 | ||
Labour hold | Swing |
Party | Candidate | Votes | % | ± | |
---|---|---|---|---|---|
Liberal Democrat | Michael Heap | 2,056 | 58.8 | -0.5 | |
Labour | Malcolm Thomas | 1,174 | 33.6 | -0.4 | |
Conservative | Christopher Haynes | 266 | 7.6 | +0.9 | |
Majority | 882 | 25.2 | -0.1 | ||
Turnout | 3,496 | 34.8 | +0.6 | ||
Liberal Democrat gain from Labour | Swing | ||||
Party | Candidate | Votes | % | ± | |
---|---|---|---|---|---|
Conservative | John Davis | 1,972 | 64.7 | +8.8 | |
Labour | Sherbalwant Dulai | 554 | 18.2 | -0.2 | |
Liberal Democrat | Roger Gray | 522 | 17.1 | -8.6 | |
Majority | 1,418 | 46.5 | +16.3 | ||
Turnout | 3,048 | 33.2 | -2.0 | ||
Conservative hold | Swing |
Party | Candidate | Votes | % | ± | |
---|---|---|---|---|---|
Conservative | Joan Stevenson | 2,511 | 72.8 | +0.8 | |
Labour | Patricia Wesley | 672 | 19.5 | +0.1 | |
Liberal Democrat | Philip Bennett | 264 | 7.7 | -1.0 | |
Majority | 1,839 | 53.3 | +0.7 | ||
Turnout | 3,447 | 37.6 | +0.9 | ||
Conservative hold | Swing |
Party | Candidate | Votes | % | ± | |
---|---|---|---|---|---|
Labour | Gwendoline Stafford-Good | 1,392 | 52.1 | -1.4 | |
Conservative | David Jack | 989 | 37.0 | -1.6 | |
Liberal Democrat | Carole Jenkins | 174 | 6.5 | +2.4 | |
Liberal | Kate Hallmark | 119 | 4.5 | +0.7 | |
Majority | 403 | 15.1 | +0.2 | ||
Turnout | 2,674 | 29.5 | -2.9 | ||
Labour hold | Swing |
Party | Candidate | Votes | % | ± | |
---|---|---|---|---|---|
Labour | Paul Kalinauckas | 1,341 | 48.0 | -1.2 | |
Conservative | Simon Jevon | 1,291 | 46.2 | +3.8 | |
Liberal Democrat | John Steatham | 162 | 5.8 | -2.5 | |
Majority | 50 | 1.8 | -5.0 | ||
Turnout | 2,794 | 31.5 | +0.6 | ||
Labour hold | Swing |
The 1998 St Helens Metropolitan Borough Council election took place on 7 May 1998 to elect members of St Helens Metropolitan Borough Council in Merseyside, England. One third of the council was up for election and the Labour party stayed in overall control of the council.
The 1999 St Helens Metropolitan Borough Council election took place on 6 May 1999 to elect members of St Helens Metropolitan Borough Council in Merseyside, England. One third of the council was up for election and the Labour party stayed in overall control of the council.
The 1998 Bolton Metropolitan Borough Council election took place on 7 May 1998 to elect members of Bolton Metropolitan Borough Council in Greater Manchester, England. One third of the council was up for election and the Labour party kept overall control of the council.
The 1998 Wolverhampton Metropolitan Borough Council election took place on 7 May 1998 to elect members of Wolverhampton Metropolitan Borough Council in the West Midlands, England. One third of the council was up for election and the Labour party kept overall control of the council.
The 2003 Woking Council election took place on 1 May 2003 to elect members of Woking Borough Council in Surrey, England. One third of the council was up for election and the council stayed under no overall control.
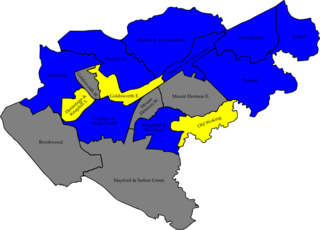
The 2007 Woking Council election took place on 3 May 2007 to elect members of Woking Borough Council in Surrey, England. One third of the council was up for election and the Conservative party gained overall control of the council from no overall control.
The 2008 Woking Council election took place on 1 May 2008 to elect members of Woking Borough Council in Surrey, England. One third of the council was up for election and the Conservative party stayed in overall control of the council.
The 2003 South Tyneside Metropolitan Borough Council election took place on 1 May 2003 to elect members of South Tyneside Metropolitan Borough Council in Tyne and Wear, England. One third of the council was up for election and the Labour party kept overall control of the council.
The 2010 Solihull Metropolitan Borough Council election took place on 6 May 2010 to elect members of Solihull Metropolitan Borough Council in the West Midlands, England. One third of the council was up for election and the council stayed under no overall control.
The 1999 Solihull Metropolitan Borough Council election took place on 6 May 1999 to elect members of Solihull Metropolitan Borough Council in the West Midlands, England. One third of the council was up for election and the council stayed under no overall control.
The 2003 Solihull Metropolitan Borough Council election took place on 1 May 2003 to elect members of Solihull Metropolitan Borough Council in the West Midlands, England. One third of the council was up for election and the Conservative party stayed in overall control of the council.
The 2007 Solihull Metropolitan Borough Council election took place on 4 May 2007 to elect members of Solihull Metropolitan Borough Council in the West Midlands, England. One third of the council was up for election and the Conservative party lost overall control of the council to no overall control.
The 2010 Sunderland Council election took place on 6 May 2010 to elect members of Sunderland Metropolitan Borough Council in Tyne and Wear, England. One third of the council was up for election and the Labour party stayed in overall control of the council. The election took place on the same day as the 2010 General Election.
The 1999 Pendle Borough Council election took place on 6 May 1999 to elect members of Pendle Borough Council in Lancashire, England. One third of the council was up for election and the Liberal Democrats lost overall control of the council to no overall control.
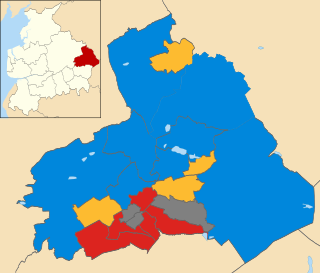
The 2010 Pendle Borough Council election took place on 6 May 2010 to elect members of Pendle Borough Council in Lancashire, England. One third of the council was up for election and the council stayed under no overall control.
The 1999 Sandwell Metropolitan Borough Council election took place on 6 May 1999 to elect members of Sandwell Metropolitan Borough Council in the West Midlands, England. One third of the council was up for election and the Labour party stayed in overall control of the council.
The 2000 Sandwell Metropolitan Borough Council election took place on 4 May 2000 to elect members of Sandwell Metropolitan Borough Council in the West Midlands, England. One third of the council was up for election and the Labour party stayed in overall control of the council.
The 2010 Sandwell Metropolitan Borough Council election took place on 6 May 2010 to elect members of Sandwell Metropolitan Borough Council in the West Midlands, England. One third of the council was up for election and the Labour party stayed in overall control of the council.
The 2011 Pendle Borough Council election took place on 5 May 2011 to elect members of Pendle Borough Council in Lancashire, England. One third of the council was up for election and the council stayed under no overall control.
The 2011 St Helens Metropolitan Borough Council election took place on 5 May 2011 to elect members of St Helens Metropolitan Borough Council in Merseyside, England. One third of the council was up for election and the Labour party stayed in overall control of the council.