| ||||||||||||||||||||||||||||||||||||||||
All 36 seats to Argyll and Bute Council 19 seats needed for a majority | ||||||||||||||||||||||||||||||||||||||||
---|---|---|---|---|---|---|---|---|---|---|---|---|---|---|---|---|---|---|---|---|---|---|---|---|---|---|---|---|---|---|---|---|---|---|---|---|---|---|---|---|
| ||||||||||||||||||||||||||||||||||||||||
Results by ward | ||||||||||||||||||||||||||||||||||||||||
|
The 1999 elections to Argyll and Bute Council were held on the 6 May 1999 and were the second for the unitary authority, which was created under the Local Government etc (Scotland) Act 1994 and replaced the previous two-tier system of local government under Strathclyde Regional Council and Dumbarton and Argyll & Bute District Councils. It was held on the same day as the first Scottish Parliament election and resulted in no change to the administration of the council - independent control.
A unitary authority is a type of local authority that has a single tier and is responsible for all local government functions within its area or performs additional functions which elsewhere in the relevant country are usually performed by national government or a higher level of sub-national government.
A local government is a form of public administration which, in a majority of contexts, exists as the lowest tier of administration within a given state. The term is used to contrast with offices at state level, which are referred to as the central government, national government, or federal government and also to supranational government which deals with governing institutions between states. Local governments generally act within powers delegated to them by legislation or directives of the higher level of government. In federal states, local government generally comprises the third tier of government, whereas in unitary states, local government usually occupies the second or third tier of government, often with greater powers than higher-level administrative divisions.
Strathclyde was one of nine former local government regions of Scotland created by the Local Government (Scotland) Act 1973 and abolished in 1996 by the Local Government etc. (Scotland) Act 1994. The Strathclyde region had 19 districts.
Party | Seats | Gains | Losses | Net gain/loss | Seats % | Votes % | Votes | +/− | |
---|---|---|---|---|---|---|---|---|---|
Independent | 20 | 55.56 | |||||||
Liberal Democrats | 6 | 4 | 1 | 16.67 | |||||
SNP | 5 | 3 | 2 | 13.89 | |||||
Conservative | 4 | 3 | 2 | 11.11 | |||||
Labour | 1 | 1 | 2 | 2.78 | |||||
Faslane Peace | 0 | 0 | 0 | 0 | 0 | ||||
Party | Candidate | Votes | % | ± | |
---|---|---|---|---|---|
Conservative | A McCallum | 269 | 20.8 | ||
Labour | A Wilson | 224 | 17.3 | ||
SNP | A Cowan | 219 | 16.9 | ||
Independent | J MacLean | 219 | 16.9 | ||
Independent | W Bell | 184 | 14.2 | ||
Liberal Democrats | J McKerral | 178 | 13.8 | ||
Majority | 45 | 3.5 | |||
Turnout | 1,293 | 65.9 | |||
Conservative hold | Swing | ||||
Party | Candidate | Votes | % | ± | |
---|---|---|---|---|---|
Independent | A McKinlay | 699 | 53.3 | ||
Labour | G MacMillan | 401 | 30.6 | ||
SNP | D McIntyre | 211 | 16.1 | ||
Majority | 298 | 22.7 | |||
Turnout | 1,311 | 61.5 | |||
Independent win (new seat) | |||||
Party | Candidate | Votes | % | ± | |
---|---|---|---|---|---|
Independent | T A Blair | 460 | 34.4 | ||
Labour | I McMillan | 378 | 28.2 | ||
Liberal Democrats | T J Oxborrow | 253 | 18.9 | ||
SNP | A J MacLellan | 247 | 18.5 | ||
Majority | 82 | 6.2 | |||
Turnout | 1,338 | 63.0 | |||
Independent gain from Conservative | Swing | ||||
Party | Candidate | Votes | % | ± | |
---|---|---|---|---|---|
Independent | D McKinnon | 514 | 38.5 | ||
Liberal Democrats | D Robertson | 379 | 28.4 | ||
SNP | A Horn | 261 | 19.6 | ||
Conservative | A McNeill | 180 | 13.5 | ||
Majority | 135 | 10.1 | |||
Turnout | 1,334 | 67.6 | |||
Independent hold | Swing | ||||
Party | Candidate | Votes | % | ± | |
---|---|---|---|---|---|
Independent | B Robertson | 580 | 43.9 | ||
Labour | D Philand | 421 | 31.9 | ||
SNP | A M Johnston | 211 | 16.0 | ||
Conservative | W C C Duncan | 108 | 8.2 | ||
Majority | 159 | 12.0 | |||
Turnout | 1,320 | 69.9 | |||
Independent hold | Swing | ||||
Party | Candidate | Votes | % | ± | |
---|---|---|---|---|---|
Independent | D MacMillan | 646 | 49.3 | ||
Labour | B Grunewald | 552 | 42.1 | ||
Conservative | H W M D Service | 113 | 8.6 | ||
Majority | 94 | 7.2 | |||
Turnout | 1,311 | 65.2 | |||
Independent hold | Swing | ||||
Party | Candidate | Votes | % | ± | |
---|---|---|---|---|---|
Liberal Democrats | A J Hay | 1049 | 77.6 | ||
Conservative | V J Cox | 214 | 15.8 | ||
Faslane Peace | S Cox | 89 | 6.6 | ||
Majority | 835 | 61.8 | |||
Turnout | 1,352 | 68.3 | |||
Liberal Democrats hold | Swing | ||||
Party | Candidate | Votes | % | ± | |
---|---|---|---|---|---|
Liberal Democrats | R Currie | Unopposed | N/A | N/A | |
Liberal Democrats hold | Swing | ||||
Party | Candidate | Votes | % | ± | |
---|---|---|---|---|---|
Independent | J M R Findlay | Unopposed | N/A | N/A | |
Independent gain from Independent | Swing | ||||
Party | Candidate | Votes | % | ± | |
---|---|---|---|---|---|
Independent | A Macaskill | 755 | 62.7 | ||
SNP | R Johnston | 450 | 37.3 | ||
Majority | 305 | 25.4 | |||
Turnout | 1,205 | 66.7 | |||
Independent hold | Swing | ||||
Party | Candidate | Votes | % | ± | |
---|---|---|---|---|---|
Independent | D Webster | 455 | 40.2 | ||
SNP | K MacColl | 357 | 31.5 | ||
Independent | D MacKenzie | 198 | 17.5 | ||
Conservative | K F M Oxland | 123 | 10.9 | ||
Majority | 98 | 8.7 | |||
Turnout | 1,133 | 58.5 | |||
Independent hold | Swing | ||||
Party | Candidate | Votes | % | ± | |
---|---|---|---|---|---|
Independent | R Banks | 650 | 58.1 | ||
Liberal Democrats | W R Shaw | 327 | 29.3 | ||
Conservative | E M Kilpatrick | 141 | 12.6 | ||
Majority | 323 | 28.8 | |||
Turnout | 1,118 | 56.3 | |||
Independent hold | Swing | ||||
Party | Candidate | Votes | % | ± | |
---|---|---|---|---|---|
SNP | D McIntosh | 572 | 51.3 | ||
Liberal Democrats | A McKie | 544 | 48.7 | ||
Majority | 28 | 2.6 | |||
Turnout | 1,116 | 54.8 | |||
SNP win (new seat) | |||||
Party | Candidate | Votes | % | ± | |
---|---|---|---|---|---|
Independent | D McIntyre | 410 | 31.9 | ||
Liberal Democrats | A Baker | 300 | 23.3 | ||
Independent | J Hyde | 288 | 22.4 | ||
Independent | A MacKinnon | 240 | 18.7 | ||
Independent | A M Dairon | 47 | 3.7 | ||
Majority | 110 | 8.6 | |||
Turnout | 1,285 | 66.3 | |||
Independent gain from Liberal Democrats | Swing | ||||
Party | Candidate | Votes | % | ± | |
---|---|---|---|---|---|
SNP | C Cameron | 905 | 59.8 | ||
Independent | G Burton | 609 | 40.2 | ||
Majority | 296 | 19.6 | |||
Turnout | 1,514 | 69.1 | |||
SNP hold | Swing | ||||
Party | Candidate | Votes | % | ± | |
---|---|---|---|---|---|
Independent | A MacDougall | 905 | 59.8 | ||
SNP | D Cattanach | 609 | 40.2 | ||
Majority | 296 | 19.6 | |||
Turnout | 1,514 | 66.4 | |||
Independent gain from Independent | Swing | ||||
Party | Candidate | Votes | % | ± | |
---|---|---|---|---|---|
Independent | I Gillies | Unopposed | N/A | N/A | |
Independent hold | Swing | ||||
Party | Candidate | Votes | % | ± | |
---|---|---|---|---|---|
SNP | R Macintyre | Unopposed | N/A | N/A | |
SNP gain from Independent | Swing | ||||
Party | Candidate | Votes | % | ± | |
---|---|---|---|---|---|
SNP | I Strong | 611 | 45.2 | ||
Independent | F Gillies | 376 | 27.8 | ||
Labour | J Gorman | 166 | 12.3 | ||
Liberal Democrats | M Hamilton | 131 | 9.7 | ||
Independent | D Flowers | 68 | 5.0 | ||
Majority | 235 | 17.4 | |||
Turnout | 1,352 | 63.7 | |||
SNP gain from Independent | Swing | ||||
Party | Candidate | Votes | % | ± | |
---|---|---|---|---|---|
Independent | A L Scoullar | 896 | 72.5 | ||
Independent | R McNamara | 172 | 13.9 | ||
SNP | J B Judge | 168 | 13.6 | ||
Majority | 724 | 58.6 | |||
Turnout | 1,236 | 70.6 | |||
Independent gain from Independent | Swing | ||||
Party | Candidate | Votes | % | ± | |
---|---|---|---|---|---|
Independent | D C Currie | 662 | 42.2 | ||
SNP | A Clayton | 575 | 36.6 | ||
Conservative | J D Geary | 332 | 21.2 | ||
Majority | 87 | 5.6 | |||
Turnout | 1,569 | 70.7 | |||
Independent gain from SNP | Swing | ||||
Party | Candidate | Votes | % | ± | |
---|---|---|---|---|---|
SNP | E MacTaggart | 548 | 43.5 | ||
Conservative | E Waddell | 381 | 30.2 | ||
Independent | B J Chennell | 331 | 26.3 | ||
Majority | 167 | 13.3 | |||
Turnout | 1,260 | 65.2 | |||
SNP hold | Swing | ||||
Party | Candidate | Votes | % | ± | |
---|---|---|---|---|---|
Independent | J McQueen | 410 | 33.8 | ||
SNP | A MacAlister | 306 | 25.3 | ||
Labour | D Divers | 287 | 23.7 | ||
Independent | J Allison | 209 | 17.2 | ||
Majority | 104 | 8.5 | |||
Turnout | 1,212 | 60.5 | |||
Independent gain from Independent | Swing | ||||
Party | Candidate | Votes | % | ± | |
---|---|---|---|---|---|
Labour | S Gray | 583 | 54.7 | ||
SNP | J Scott | 483 | 45.3 | ||
Majority | 100 | 9.4 | |||
Turnout | 1,066 | 59.7 | |||
Labour gain from Independent | Swing | ||||
Party | Candidate | Votes | % | ± | |
---|---|---|---|---|---|
Independent | Dick Walsh | 976 | 70.9 | ||
SNP | J McGoran | 401 | 29.1 | ||
Majority | 575 | 41.8 | |||
Turnout | 1,377 | 67.9 | |||
Independent hold | Swing | ||||
Party | Candidate | Votes | % | ± | |
---|---|---|---|---|---|
Conservative | T B Marshall | 512 | 35.3 | ||
SNP | R E Rees | 453 | 31.2 | ||
Labour | G McKinven | 412 | 28.4 | ||
Independent | N McGugan | 75 | 5.2 | ||
Majority | 59 | 4.1 | |||
Turnout | 1,452 | 70.2 | |||
Conservative gain from SNP | Swing | ||||
Party | Candidate | Votes | % | ± | |
---|---|---|---|---|---|
Liberal Democrats | F Thompson | 616 | 52.6 | ||
Labour | D Phillips | 345 | 29.5 | ||
Conservative | G Douglas | 113 | 9.7 | ||
Independent | J Young | 96 | 8.2 | ||
Majority | 271 | 23.1 | |||
Turnout | 1,170 | 58.0 | |||
Liberal Democrats win (new seat) | |||||
Party | Candidate | Votes | % | ± | |
---|---|---|---|---|---|
Liberal Democrats | M Stewart | 635 | 53.7 | ||
Independent | N Millar | 395 | 33.4 | ||
Conservative | R Reading | 153 | 12.9 | ||
Majority | 240 | 20.3 | |||
Turnout | 1,183 | 63.4 | |||
Liberal Democrats win (new seat) | |||||
Party | Candidate | Votes | % | ± | |
---|---|---|---|---|---|
Conservative | S Wilson | 351 | 30.6 | ||
Independent | G Hanning | 315 | 27.5 | ||
SNP | L Leven | 244 | 21.3 | ||
Liberal Democrats | P Trenaman | 236 | 20.6 | ||
Majority | 36 | 3.1 | |||
Turnout | 1,146 | 55.2 | |||
Conservative win (new seat) | |||||
Party | Candidate | Votes | % | ± | |
---|---|---|---|---|---|
Liberal Democrats | E Morton | 525 | 45.5 | ||
Independent | J Weldon | 347 | 30.1 | ||
Conservative | P Ramsay | 282 | 24.4 | ||
Majority | 178 | 15.4 | |||
Turnout | 1,154 | 56.9 | |||
Liberal Democrats win (new seat) | |||||
Party | Candidate | Votes | % | ± | |
---|---|---|---|---|---|
Conservative | J Stirling | 529 | 34.4 | ||
Liberal Democrats | A Reay | 391 | 25.4 | ||
Independent | D Sinclair | 374 | 24.3 | ||
Labour | J Eaton | 243 | 15.8 | ||
Majority | 138 | 9.0 | |||
Turnout | 1,537 | 64.8 | |||
Conservative win (new seat) | |||||
Party | Candidate | Votes | % | ± | |
---|---|---|---|---|---|
Independent | S Latimer | 577 | 47.1 | ||
Conservative | G Mulvaney | 442 | 36.1 | ||
SNP | E Buist | 206 | 16.8 | ||
Majority | 135 | 11.0 | |||
Turnout | 1,225 | 64.9 | |||
Independent win (new seat) | |||||
Party | Candidate | Votes | % | ± | |
---|---|---|---|---|---|
Independent | G Freeman | 775 | 81.5 | ||
Liberal Democrats | J Sheffield | 176 | 18.5 | ||
Majority | 599 | 63.0 | |||
Turnout | 951 | 58.5 | |||
Independent gain from Independent | Swing | ||||
Party | Candidate | Votes | % | ± | |
---|---|---|---|---|---|
Independent | W Petrie | 672 | 57.7 | ||
Independent | E Carberry | 351 | 30.2 | ||
Conservative | C Skrastin | 101 | 8.7 | ||
Faslane Peace | P Monaghan | 40 | 3.4 | ||
Majority | 321 | 27.5 | |||
Turnout | 1,164 | 60.6 | |||
Independent hold | Swing | ||||
Party | Candidate | Votes | % | ± | |
---|---|---|---|---|---|
Liberal Democrats | P Coleshill | 684 | 53.7 | ||
Independent | D Kelly | 590 | 46.3 | ||
Majority | 94 | 7.4 | |||
Turnout | 1,274 | 62.6 | |||
Liberal Democrats win (new seat) | |||||
Party | Candidate | Votes | % | ± | |
---|---|---|---|---|---|
Independent | R Kinloch | 996 | 77.6 | ||
SNP | V Nelson | 288 | 22.4 | ||
Majority | 708 | 55.2 | |||
Turnout | 1,284 | 68.3 | |||
Independent hold | Swing | ||||
Argyll and Bute is both one of 32 unitary authority council areas and a lieutenancy area in Scotland. The administrative centre for the council area is in Lochgilphead.
West Dunbartonshire is one of the 32 local government council areas of Scotland. The area lies to the west of the City of Glasgow and contains many of Glasgow's commuter towns and villages, as well as the city's suburbs. West Dunbartonshire also borders onto Argyll and Bute, East Dunbartonshire, Renfrewshire and Stirling.
The Highlands and Islands is one of the eight electoral regions of the Scottish Parliament which were created in 1999. Eight of the parliament's first past the post constituencies are sub-divisions of the region and it elects seven of the 56 additional-member Members of the Scottish Parliament (MSPs).
The County of Bute, also known as Buteshire, is a historic county and registration county of Scotland.
Argyll, sometimes anglicised as Argyllshire, is a historic county and registration county of western Scotland.
Argyll and Bute is a county constituency of the House of Commons of the Parliament of the United Kingdom. It was created for the 1983 general election, merging most of Argyll with some of Bute and Northern Ayrshire. A similar constituency, also called Argyll and Bute, is used by the Scottish Parliament.
The Highlands and Islands of Scotland are broadly the Scottish Highlands, plus Orkney, Shetland and the Western Isles.
Argyll and Bute is a constituency of the Scottish Parliament (Holyrood). It elects one Member of the Scottish Parliament (MSP) by the first past the post method of election. It is also one of eight constituencies in the Highlands and Islands electoral region, which elects seven additional members, in addition to the eight constituency MSPs, to produce a form of proportional representation for the region as a whole.
Scotland has elections to several bodies: the Scottish Parliament, the United Kingdom Parliament, the European Parliament, local councils and community councils.
The 2012 Scottish local elections, were held on 3 May, in all 32 local authorities. The Scottish National Party (SNP) overtook Labour to win the highest share of the vote, and retained and strengthened its position as the party with most councillors. Labour also made gains, while the Liberal Democrats experienced meltdown, falling behind the Conservatives. For the first time since the introduction of the Single Transferable Vote system, the SNP won majority control of 2 councils, from no overall control. Labour also won majority control of 2 councils from no overall control, while retaining majority control over 2 councils.
Local elections were held in the United Kingdom in 1974, during the life of the minority Labour government of Harold Wilson. Elections were held in all the boroughs of London.
The Scottish local elections, 2003 were held on 1 May 2003, the same day as Scottish Parliament elections and local elections in parts of England. All 32 Scottish councils had all their seats up for election – all Scottish councils are unitary authorities.
The Scottish local elections, 1999 were held on 6 May 1999, the same day as First Scottish Parliament elections. It was the second election for all 32 Scottish councils and the first after a major review into all wards.
Elections to Argyll and Bute Council were held on 3 May 2012 on the same day as the 31 other local authorities in Scotland. The election used the eleven wards created under the Local Governance (Scotland) Act 2004, with 36 councillors being elected. Each ward elected either 3 or 4 members, using the STV electoral system.
Roderick William "Roddy" McCuish is a Scottish politician who is an independent member of the Argyll and Bute Council, having formerly been the leader twice, both with the Scottish National Party (SNP) and later as an independent.
The 1995 elections to Argyll and Bute Council were held on the 6 April 1995 and were the first for the newly formed unitary authority, which was created under the Local Government etc (Scotland) Act 1994 and replaced the previous two-tier system of local government under Strathclyde Regional Council and Dumbarton and Argyll & Bute District Councils.
The 2003 elections to Argyll and Bute Council were held on the 1 May 2003 and were the third for the unitary authority, which was created under the Local Government etc (Scotland) Act 1994 and replaced the previous two-tier system of local government under Strathclyde Regional Council and Dumbarton and Argyll & Bute District Councils. It was held on the same day as the second Scottish Parliament election and resulted in no change to the administration of the council - independent control. These were the last elections to the council using the first past the post electoral system.
Elections to Argyll and Bute Council were held in May 1992, the same day as the other Scottish local government elections. The election was the last for the Argyll and Bute District Council, as the council would be replaced with the Argyll and Bute unitary authority for the 1995 election.
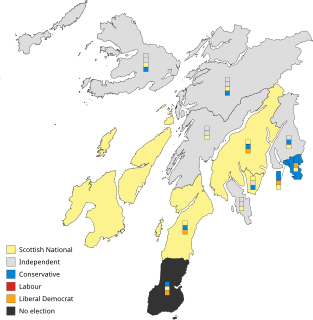
The 2017 Argyll and Bute Council elections took place on 4 May 2017 alongside local elections across Scotland. This was the third local election to take place using the Single Transferable Vote electoral system.