| ||
All 53 seats to City of York Council | ||
Elections to City of York Council were held on 6 May 1999. All 53 council seats in the city were up for election and the Labour party kept overall control of the council.
York is a historic walled city in North Yorkshire, England. At the confluence of the Rivers Ouse and Foss, it is the historic county town of the historic county of Yorkshire. York Minster and a variety of cultural and sporting activities make it a popular tourist destination.
The Labour Party is a centre-left political party in the United Kingdom which has been described as an alliance of social democrats, democratic socialists and trade unionists. The party's platform emphasises greater state intervention, social justice and strengthening workers' rights.
Party | Seats | Gains | Losses | Net gain/loss | Seats % | Votes % | Votes | +/− | |
---|---|---|---|---|---|---|---|---|---|
Labour | 27 | 0 | 3 | -3 | 50.9 | ||||
Liberal Democrat | 22 | 4 | 0 | +4 | 41.5 | ||||
Conservative | 3 | 1 | 1 | 0 | 5.7 | ||||
Independent | 1 | 1 | 2 | -1 | 1.9 | ||||
Party | Candidate | Votes | % | ± | |
---|---|---|---|---|---|
Labour | D.A. Horton | 1037 | 58.9 | ||
Labour | T.L. Simpson-Laing | 871 | |||
Conservative | E.J. Fulford | 773 | 21.6 | ||
Conservative | A. Potter | 630 | |||
Liberal Democrat | A.L. Doig | 345 | 19.6 | ||
Liberal Democrat | J.D. Dales | 325 | |||
Turnout | 32.9 | ||||
Labour hold | Swing | ||||
Party | Candidate | Votes | % | ± | |
---|---|---|---|---|---|
Labour | R.T. Cregan | 965 | 30.5 | ||
Labour | R.E. Potter | 874 | 27.6 | ||
Liberal Democrat | A.J. Law | 558 | 17.7 | ||
Conservative | C.A.G. Brooks | 398 | 12.6 | ||
Liberal Democrat | S.H. McCloy | 366 | 11.6 | ||
Turnout | |||||
Labour hold | Swing | ||||
Party | Candidate | Votes | % | ± | |
---|---|---|---|---|---|
Labour | D.M. Merrett | 875 | 25.9 | ||
Labour | C.A. Wallace | 729 | 21.6 | ||
Green | A.D. Chase | 358 | 10.6 | ||
Conservative | R.A. Schofield | 335 | 9.9 | ||
Conservative | C.B. Megone | 332 | 9.8 | ||
Liberal Democrat | M.R. Bartlett | 325 | 9.6 | ||
Liberal Democrat | D.J. Grainger | 227 | 6.7 | ||
Green | A. White | 201 | 5.9 | ||
Turnout | |||||
Labour hold | Swing | ||||
Party | Candidate | Votes | % | ± | |
---|---|---|---|---|---|
Labour | K. Cooper | 806 | 35.8 | ||
Labour | K.W. King | 701 | 31.2 | ||
Liberal Democrat | D.S. Begbie | 298 | 13.3 | ||
Liberal Democrat | Z.A. Varley | 225 | 10.0 | ||
Conservative | D. Dawson | 219 | 9.7 | ||
Turnout | |||||
Labour hold | Swing | ||||
Party | Candidate | Votes | % | ± | |
---|---|---|---|---|---|
Labour | R.I. Hills | 742 | 28.5 | ||
Labour | A. Jones | 740 | 28.4 | ||
Conservative | N.C. Major | 321 | 12.3 | ||
Conservative | S.C. Thompson | 300 | 11.5 | ||
Liberal Democrat | K.A. Tarry | 269 | 10.3 | ||
Liberal Democrat | D. Waudby | 234 | 9.0 | ||
Turnout | |||||
Labour hold | Swing | ||||
Party | Candidate | Votes | % | ± | |
---|---|---|---|---|---|
Liberal Democrat | S.P. Tarry | 733 | 62.3 | ||
Labour | A.M. Greagsby | 314 | 26.7 | ||
Conservative | T.G. Pearson | 129 | 11.0 | ||
Turnout | |||||
Liberal Democrat hold | Swing | ||||
Party | Candidate | Votes | % | ± | |
---|---|---|---|---|---|
Liberal Democrat | D.G. Livesley | 1378 | 28.0 | ||
Conservative | J.C. Galvin | 1059 | 21.5 | ||
Liberal Democrat | D.Y.P. Khan | 971 | 19.8 | ||
Labour | G. Campbell-Thomas | 787 | 16.0 | ||
Labour | A.J. MacDonald | 721 | 14.7 | ||
Turnout | |||||
Liberal Democrat gain from Labour | Swing | ||||
Conservative hold | Swing | ||||
Party | Candidate | Votes | % | ± | |
---|---|---|---|---|---|
Liberal Democrat | J.A. Greenwood | 615 | 46.6 | ||
Independent | R.F. Carr | 597 | 45.2 | ||
Labour | D.L Scott | 109 | 8.3 | ||
Turnout | |||||
Liberal Democrat gain from Independent | Swing | ||||
Party | Candidate | Votes | % | ± | |
---|---|---|---|---|---|
Labour | J. Boardman | 910 | 22.8 | ||
Labour | R. Farrington | 778 | 19.5 | ||
Conservative | R.N. Dickson | 642 | 16.1 | ||
Conservative | D. Minns | 627 | 15.7 | ||
Green | M. Nicholson | 312 | 7.8 | ||
Liberal Democrat | R. Brown | 310 | 7.8 | ||
Liberal Democrat | J.G. Cruickshank | 254 | 6.4 | ||
Green | D.J. Wilkinson | 165 | 4.1 | ||
Turnout | |||||
Labour hold | Swing | ||||
Party | Candidate | Votes | % | ± | |
---|---|---|---|---|---|
Liberal Democrat | S.F. Galloway | 1800 | 27.0 | ||
Liberal Democrat | A.L. Reid | 1720 | 25.8 | ||
Liberal Democrat | J. Blakeborough | 1640 | 24.6 | ||
Labour | A. Fraser | 446 | 6.7 | ||
Labour | E.S. Gouge | 408 | 6.1 | ||
Labour | J. James | 399 | 6.0 | ||
Conservative | I.J. Farndale | 247 | 3.7 | ||
Turnout | |||||
Liberal Democrat hold | Swing | ||||
Party | Candidate | Votes | % | ± | |
---|---|---|---|---|---|
Labour | T.M. Brighton | 405 | 45.8 | ||
Conservative | J.E. Mackfall | 299 | 33.8 | ||
Liberal Democrat | A.R. Normandale | 180 | 20.4 | ||
Turnout | 884 | ||||
Labour hold | Swing | ||||
Party | Candidate | Votes | % | ± | |
---|---|---|---|---|---|
Labour | J.M. Looker | 780 | 24.9 | ||
Labour | B.W.J.E. Watson | 667 | 21.3 | ||
Conservative | K.J. Beavan | 487 | 15.6 | ||
Conservative | A.J. Mett | 445 | 14.2 | ||
Liberal Democrat | C.M. Anderson | 255 | 8.2 | ||
Liberal Democrat | L.A. Hogg | 223 | 7.1 | ||
Green | G.M. Williams | 136 | 4.3 | ||
Green | J.S. Cossham | 134 | 4.3 | ||
Turnout | |||||
Labour hold | Swing | ||||
Party | Candidate | Votes | % | ± | |
---|---|---|---|---|---|
Liberal Democrat | H. Briggs | 2128 | 25.5 | ||
Liberal Democrat | C.M. Hogg | 2071 | 24.8 | ||
Liberal Democrat | M.R. Watson | 1952 | 23.4 | ||
Conservative | R.J. Phillips | 687 | 8.2 | ||
Conservative | R.A. Procter | 636 | 7.6 | ||
Labour | G.R. Beacon | 306 | 3.7 | ||
Labour | I.G. Lowson | 282 | 3.4 | ||
Labour | M.W. Gaunt | 280 | 3.4 | ||
Turnout | |||||
Liberal Democrat hold | Swing | ||||
Party | Candidate | Votes | % | ± | |
---|---|---|---|---|---|
Labour | M.H.K. Brumby | 284 | 39.4 | ||
Liberal Democrat | P.A. Hearn | 154 | 21.4 | ||
Conservative | G.E.R. Hill | 154 | 21.4 | ||
Green | D. Biram | 129 | 17.9 | ||
Turnout | 721 | ||||
Labour hold | Swing | ||||
Party | Candidate | Votes | % | ± | |
---|---|---|---|---|---|
Labour | S.E. Braund | 1051 | 30.5 | ||
Labour | C.A. Waite | 1027 | 29.8 | ||
Conservative | D. Gough | 378 | 11.0 | ||
Conservative | D.J. Hyland | 356 | 10.3 | ||
Liberal Democrat | I.M. Cuthbertson | 322 | 9.3 | ||
Liberal Democrat | I.E. Packington | 315 | 9.1 | ||
Turnout | |||||
Labour hold | Swing | ||||
Party | Candidate | Votes | % | ± | |
---|---|---|---|---|---|
Liberal Democrat | M.J. Bradley | 793 | 87.9 | ||
Labour | A.S. Dhesi | 109 | 12.1 | ||
Turnout | |||||
Liberal Democrat hold | Swing | ||||
Party | Candidate | Votes | % | ± | |
---|---|---|---|---|---|
Labour | E.S. Edge | 826 | 22.6 | ||
Labour | R.E. Scrase | 736 | 20.1 | ||
Liberal Democrat | D. Horwell | 730 | 20.0 | ||
Liberal Democrat | J. Tull | 689 | 18.8 | ||
Conservative | W. Bennett | 320 | 8.8 | ||
Conservative | R. Jackson | 279 | 7.6 | ||
Socialist Labour | J.J. Stewart | 76 | 2.1 | ||
Turnout | |||||
Labour hold | Swing | ||||
Party | Candidate | Votes | % | ± | |
---|---|---|---|---|---|
Liberal Democrat | D.J. Henderson | 1961 | 23.3 | ||
Liberal Democrat | P. Vaughan | 1958 | 23.3 | ||
Liberal Democrat | C.E. Runciman | 1728 | 20.6 | ||
Labour | Clive Woolley | 760 | 9.0 | ||
Labour | E.C. Macleod | 718 | 8.5 | ||
Conservative | B.S. Wiseman | 643 | 7.7 | ||
Labour | M.E. Simon | 637 | 7.6 | ||
Turnout | |||||
Liberal Democrat hold | Swing | ||||
Party | Candidate | Votes | % | ± | |
---|---|---|---|---|---|
Labour | R.D. Fletcher | 920 | 27.6 | ||
Labour | T.J. Walker | 850 | 25.5 | ||
Conservative | M.J. Garrity | 442 | 13.3 | ||
Conservative | S.J. Williams | 426 | 12.8 | ||
Liberal Democrat | J.M. McCloy | 195 | 5.9 | ||
Liberal Democrat | G.G. Talbot | 180 | 5.4 | ||
Green | A.C. Martin | 172 | 5.2 | ||
Green | D.E. King | 143 | 4.3 | ||
Turnout | |||||
Labour hold | Swing | ||||
Party | Candidate | Votes | % | ± | |
---|---|---|---|---|---|
Conservative | G.H. Dean | 1036 | 23.3 | ||
Labour | B.A. Bell | 1033 | 23.3 | ||
Conservative | K.J. Creek | 890 | 20.0 | ||
Labour | D.G. Evans | 860 | 19.4 | ||
Liberal Democrat | P.L.B. Reid | 334 | 7.5 | ||
Liberal Democrat | G.E.F. Thompson | 287 | 6.5 | ||
Turnout | |||||
Conservative gain from Labour | Swing | ||||
Labour hold | Swing | ||||
Party | Candidate | Votes | % | ± | |
---|---|---|---|---|---|
Labour | V. Kind | 964 | 22.1 | ||
Labour | P.L. Dodd | 956 | 21.9 | ||
Liberal Democrat | D. Kirk | 639 | 14.7 | ||
Liberal Democrat | N.S.W. Blitz | 627 | 14.4 | ||
Conservative | S.J. Mallett | 589 | 13.5 | ||
Conservative | W.E. Hanbury | 582 | 13.4 | ||
Turnout | |||||
Labour hold | Swing | ||||
Party | Candidate | Votes | % | ± | |
---|---|---|---|---|---|
Liberal Democrat | J.P. Morley | 537 | 58.4 | ||
Labour | F.E. Leesley | 238 | 25.9 | ||
Conservative | N. Adams | 144 | 15.7 | ||
Turnout | 919 | ||||
Liberal Democrat hold | Swing | ||||
Party | Candidate | Votes | % | ± | |
---|---|---|---|---|---|
Liberal Democrat | I.M. Waudby | 1520 | 37.6 | ||
Liberal Democrat | M.K. Waudby | 1264 | 31.3 | ||
Conservative | T.J. Ashman | 489 | 12.1 | ||
Labour | A.D. Garbutt | 388 | 9.6 | ||
Labour | B. Bothamley | 382 | 9.4 | ||
Turnout | |||||
Liberal Democrat hold | Swing | ||||
Liberal Democrat gain from Independent | Swing | ||||
Party | Candidate | Votes | % | ± | |
---|---|---|---|---|---|
Liberal Democrat | M.A. Kirk | 1003 | 33.4 | ||
Liberal Democrat | J. Vaughan | 895 | 29.8 | ||
Conservative | C. Marshall | 571 | 19.0 | ||
Labour | G.P. Hodgson | 275 | 9.2 | ||
Labour | K. Tomlinson | 258 | 8.6 | ||
Turnout | |||||
Liberal Democrat hold | Swing | ||||
Party | Candidate | Votes | % | ± | |
---|---|---|---|---|---|
Liberal Democrat | Q.J.A. Macdonald | 1183 | 26.6 | ||
Independent | J.S. Hopton | 1066 | 24.0 | ||
Liberal Democrat | P.H.F. Powell | 974 | 21.9 | ||
Conservative | K.R. Bushby | 443 | 10.0 | ||
Conservative | G.K. Moore | 441 | 9.9 | ||
Labour | J.C. Overhill-Smith | 207 | 4.7 | ||
Labour | I.A. Simpson-Laing | 127 | 2.9 | ||
Turnout | |||||
Liberal Democrat hold | Swing | ||||
Independent gain from Conservative | Swing | ||||
Party | Candidate | Votes | % | ± | |
---|---|---|---|---|---|
Labour | D. Wilde | 779 | 28.6 | ||
Labour | D.W. Smallwood | 748 | 27.5 | ||
Conservative | P. Thompson | 342 | 12.6 | ||
Conservative | S.E. Anson | 334 | 12.3 | ||
Liberal Democrat | A.M. Carter | 280 | 10.3 | ||
Liberal Democrat | C.F. Robertson | 239 | 8.8 | ||
Turnout | |||||
Labour hold | Swing | ||||
Party | Candidate | Votes | % | ± | |
---|---|---|---|---|---|
Liberal Democrat | S. Galloway | 1189 | 34.9 | ||
Liberal Democrat | A.M. Waller | 954 | 28.0 | ||
Labour | B. Carradice | 618 | 18.2 | ||
Labour | M. Painter | 499 | 14.7 | ||
Conservative | R. Hudson | 144 | 4.2 | ||
Turnout | |||||
Liberal Democrat hold | Swing | ||||
Liberal Democrat gain from Labour | Swing | ||||
Party | Candidate | Votes | % | ± | |
---|---|---|---|---|---|
Conservative | R.J. Snowdon | 513 | 39.2 | ||
Liberal Democrat | M. Vassie | 466 | 35.6 | ||
Labour | Edward Gouge | 329 | 25.2 | ||
Turnout | 1308 | ||||
Conservative hold | Swing | ||||
Party | Candidate | Votes | % | ± | |
---|---|---|---|---|---|
Liberal Democrat | A.C. Hall | 1027 | 87.8 | ||
Labour | K.D. Smith | 143 | 12.2 | ||
Turnout | 1308 | ||||
Liberal Democrat hold | Swing | ||||
In many countries, a mayor is the highest-ranking official in a municipal government such as that of a city or a town.
Elections to Oxford City Council were held on 6 May 1999. One third of the councils seats were up for election. The Labour party kept its overall majority on the council. The number of Councillors for each party after the election were Labour 28, Liberal Democrat 16 and Green 7. Overall turnout was 29.2%
Elections to Liverpool City Council were held on 6 May 1999. One third of the council was up for election and the Liberal Democrat party kept overall control of the council. Overall turnout was 23.6%.
The 1998 Leeds City Council election took place on 7 May 1998 to elect members of City of Leeds Metropolitan Borough Council in West Yorkshire, England. One third of the council, alongside a vacancy in Wortley were up for election.
The County Council of the City and County of Cardiff is the governing body for Cardiff, one of the Principal Areas of Wales. The council consists of 75 councillors, representing 29 electoral wards. The authority is properly styled as The County Council of the City and County of Cardiff or in common use Cardiff Council. No other style is sanctioned for use on Council Documents although it does occasionally appear wrongly as Cardiff County Council on documents and signage. The City & County itself is usually simply referred to as Cardiff.
Local elections were held in the United Kingdom on 6 May 1976. Elections were for one third of the seats on Metropolitan borough councils and for all seats on Non-Metropolitan district councils in England; and for all seats on the Welsh district councils.
Elections to Portsmouth City Council were held on 6 May 1999. One third of the council was up for election and the Labour party stayed in overall control of the council.
Elections to City of Lincoln Council in Lincolnshire, England, were held on 6 May 1999. The whole council was up for election with boundary changes since the last election in 1998. The Labour party stayed in overall control of the Council.
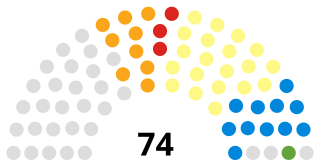
The Highland Council comprises 22 wards, each electing three or four councillors by the single transferable vote system, which creates a form of proportional representation. The total number of councillors is 74, and the main meeting place and main offices are in Glenurquhart Road, Inverness.
The 1999 Lichfield District Council election took place on 6 May 1999 to elect members of Lichfield District Council in Staffordshire, England. The whole council was up for election and the Conservative party gained overall control of the council from the Labour party.
The 1999 Derby City Council election took place on 6 May 1999 to elect members of Derby City Council in England. One third of the council was up for election and the Labour party kept overall control of the council. Overall turnout was 29.0%.
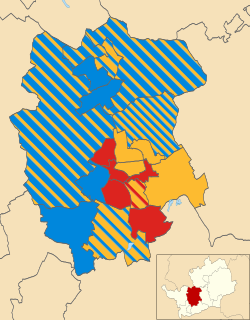
The 1999 St Albans City and District Council election took place on 6 May 1999 to elect members of St Albans City and District Council in Hertfordshire, England. The whole council was up for election with boundary changes since the last election in 1998 increasing the number of seats by 1. The Liberal Democrats lost overall control of the council to no overall control.
The 1999 Winchester Council election took place on 6 May 1999 to elect members of Winchester District Council in Hampshire, England. One third of the council was up for election and the Liberal Democrats stayed in overall control of the council.
The 1999 Leeds City Council election took place on 6 May 1999 to elect members of City of Leeds Metropolitan Borough Council in West Yorkshire, England. One third of the council was up for election, as well as a vacancy each in Horsforth, Moortown and Wetherby. Prior to the election, the Liberal Democrats had gained a seat in Bramley from Labour, and Hunslet councillor, Mark Davies, had defected from Labour to Independent Socialist.
Elections to Sheffield City Council were held on 6 May 1999. One third of the council was up for election. Previous to this election, there had been a by-election in Park, resulting in a Liberal Democrat gain from Labour, effectively cancelling out the concurrent defection of sitting Stocksbridge councillor Alan Pears from the Lib Dems to Labour. The election seen the Liberal Democrats gain control of the council - the first time since its formation not to be controlled by Labour. The results themselves were more favourable to Labour than recent elections. However, they suffered double-digit losses with the Liberal Democrats sustaining their recent election surges.
The City of Bradford Metropolitan District Council elections were held on Thursday, 6 May 1999, with one third of the council up for election. Since the previous election there had been a by-election resulting in Labour successfully defending their seat in Little Horton. Labour retained control of the council.
The elections for City and Village Councils of Iran were held on 26 February 1999, for the first time in the history of the Islamic Republic of Iran to elect some 200,000 seats.
The 1999 Bristol City Council election took place on 6 May 1999, on the same day as other local elections. All seats were up for election due to boundary changes, with each ward electing 2 councillors. The total number of seats on the council increased by 2 due to the creation of a new ward: Clifton East.
The second election to the City of Cardiff Council following the re-organization of local government in Wales was held on 6 May 1995. It was preceded by the 1995 election and followed by the 2004 elections. On the same day the first elections to the Welsh Assembly were held as well as elections to the other 21 local authorities in Wales. Labour retained a majority of the seats.