City of York Council election, 2007

Last updated

City of York Council Election, 2007
Flag of York.svg
  2003 3 May 2007 2011  

All 47 seats to City of York Council

  First party Second party Third party
 
Leader Steve Galloway Dave Merrett Ian Gillies
Party Liberal Democrat Labour Conservative
Leader since 1999 2002 N/A
Leader's seat Westfield Micklegate Rural West
Last election 29 15 0
Seats before 29 15 0
Seats won 19 18 8
Seat changeDecrease2.svg10Increase2.svg3Increase2.svg8
Popular vote 19,116 14,211 16,988
Percentage 30.1% 22.4% 26.8%

Leader of the Council before election

Steve Galloway
Liberal Democrat

Leader of the Council after election

Steve Galloway
Liberal Democrat

Local elections for City of York Council were held on Thursday 3 May 2007. The whole council was up for election. Of the 47 seats contested, the Liberal Democrats won 19 seats, Labour won 18 seats, Conservatives won eight seats and the Green Party won two seats. [1] [2] The election saw York's ruling Liberal Democrats lose ten seats and overall control of the council.

York Historic city in the north of England

York is a historic walled city in North Yorkshire, England. At the confluence of the Rivers Ouse and Foss, it is the historic county town of the historic county of Yorkshire. York Minster and a variety of cultural and sporting activities make it a popular tourist destination.

Liberal Democrats (UK) Political party in the United Kingdom

The Liberal Democrats are a liberal political party in the United Kingdom. They presently have 11 Members of Parliament in the House of Commons, 96 members of the House of Lords, and one member of the European Parliament. They also have five Members of the Scottish Parliament and a member each in the Welsh Assembly and London Assembly. The party reached the height of its influence in the early 2010s, forming a junior partner in a coalition government from 2010 to 2015. It is presently led by Vince Cable.

Contents

Election result

York Local Election Result 2007 [1]
PartySeatsGainsLossesNet gain/lossSeats %Votes %Votes+/−
  Liberal Democrat 19 0 10 -10 40.43
  Labour 18 3 0 3 38.30
  Conservative 8 8 0 8 17.02
  Green 2 0 0 0 4.26
  BNP 0 0 0 0 0
  Liberal 0 0 0 0 0
  Respect 0 0 0 0 0
  Independent 0 0 1 -1 0

Ward results

Acomb Ward

Acomb (2) [1] [2]
PartyCandidateVotes%±
Labour David Horton 1303 24.9 -1.0
Labour Tracey Simpson-Laing 1301 24.9 -1.4
Conservative Michael Tucker 529 10.1 0.2
BNP Ian Dawson 520 10.0 10.0
Liberal Democrat Rachel Lewis-Strodder 448 8.6 -10.8
Conservative David Thompson 426 8.2 8.2
Liberal Democrat Reuban Mayne 399 7.6 -8.1
Green Will Dyson 297 5.7 5.7
Turnout 44.6
Labour hold Swing -0.6
Labour hold Swing -5.7

Bishopthorpe Ward

Bishopthorpe [1] [2]
PartyCandidateVotes%±
Conservative John Galvin 851 49.3 19.8
Liberal Democrat David Livesley 504 29.2 -29.3
Labour Fiona Smith 217 12.6 0.6
Green Richard Thurley 153 8.9 8.9
Turnout 54.3
Conservative gain from Liberal Democrat Swing 24.6

Clifton Ward

Clifton (3) [1] [2]
PartyCandidateVotes%±
Labour Ken King 1438 16.9 3.7
Labour Helen Douglas 1367 16.1 1.7
Labour David Scott 1242 14.6 3.4
Green Ginnie Shaw 746 8.8 3.1
Conservative Oliver Blair 580 6.8 6.8
Conservative Kevin Hollinrake 576 6.8 6.8
Liberal Democrat Karoline Kirk 551 6.5 -4.4
Liberal Democrat Matthew Reid 545 6.4 -4.5
Liberal Democrat Derek Waudby 494 5.8 -4.0
Respect Les Marsh 421 4.9 4.9
Conservative Thomas McConnell 304 3.6 3.6
BNP Rich Leeming 251 2.9 2.9
Turnout 33.5
Labour hold Swing 0.3
Labour hold Swing -2.6
Labour hold Swing -1.7

Derwent Ward

Derwent [1] [2]
PartyCandidateVotes%±
Conservative Jenny Brooks 841 51.8 17.3
Liberal Democrat Rosalind Maggs 514 31.6 -25.0
Labour Dennis Martin 217 13.4 4.4
Green Gillian Cossham 53 3.3 3.3
Turnout 53.5
Conservative gain from Liberal Democrat Swing 21.2

Dringhouses and Woodthorpe Ward

Dringhouses and Woodthorpe (3) [1] [2]
PartyCandidateVotes%±
Liberal Democrat Ann Reid 1611 14.6 -4.9
Liberal Democrat Susan Sunderland 1503 13.6 -4.1
Liberal Democrat Thomas Holvey 1445 13.1 -3.1
Conservative Matthew Litten 1155 10.5 2.8
Conservative Barbara Vernon 1112 10.1 2.9
Conservative Paul Vernon 1064 9.7 3.0
Labour Thomas Wright 934 8.5 -1.1
Labour Geoffrey Beacon 865 7.8 0.0
Labour Gerard Hodgson 830 7.5 0.0
Green John Gray 504 4.6 4.6
Turnout 45.2
Liberal Democrat hold Swing -3.8
Liberal Democrat hold Swing -3.5
Liberal Democrat hold Swing -3.0

Fishergate Ward

Fishergate (2) [1] [2]
PartyCandidateVotes%±
Green Andy D'Agorne 1308 25.0 -0.6
Green Dave Taylor 1086 20.7 0.5
Labour Ernie Dickinson 706 13.5 0.5
Conservative Robin Dickson 649 12.4 -0.1
Labour Thomas Gibson 576 11.0 -0.1
Conservative Michael Rutherford 495 9.5 9.5
Liberal Democrat Susan Nunn 157 3.0 -4.5
Liberal Democrat Nick Hudson 146 2.8 -3.4
BNP Stephen Phillips 111 2.1 2.1
Turnout 44.9
Green hold Swing -0.6
Green hold Swing -1.6

Fulford Ward

Fulford [1] [2]
PartyCandidateVotes%±
Liberal Democrat Keith Aspden 503 44.4 -4.1
Labour Alan Smith 266 23.5 -4.6
Green Denise Craghill 212 18.7 11.2
Conservative Samantha Suddons 153 13.5 -2.5
Turnout 51.6
Liberal Democrat hold Swing 0.3

Guildhall Ward

Guildhall (2) [1] [2]
PartyCandidateVotes%±
Labour Janet Looker 785 24.1 1.4
Labour Brian Watson 654 20.1 0.8
Conservative Matthew Kilburn 413 12.7 1.8
Conservative Jonathan Meehan 343 10.5 10.5
Green John Norris 302 9.3 2.5
Green Candy Spillard 248 7.6 2.3
Liberal Democrat Jackie Talbot 180 5.5 -12.7
Liberal Democrat Peter Reid 175 5.4 -8.8
Liberal Andrew Hinkles 158 4.8 4.8
Turnout 31.2
Labour hold Swing -0.2
Labour hold Swing -4.9

Haxby and Wigginton Ward

Haxby and Wigginton (3) [1] [2]
PartyCandidateVotes%±
Liberal Democrat Christopher Hogg 1887 15.5 -10.6
Liberal Democrat Paul Firth 1740 14.3 -10.4
Liberal Democrat Richard Watson 1649 13.6 -9.3
Conservative Tony Richardson 1579 13.0 7.3
Conservative Robert Phillips 1533 12.6 6.1
Conservative Joe Tidmarsh 1435 11.8 11.8
BNP Geoff Carr 620 5.1 5.1
Green Alan Robertshaw 595 4.9 0.8
Labour Gerald Colbeck 590 4.9 1.3
Labour Richard Smyth 533 4.4 0.9
Turnout 44.3
Liberal Democrat hold Swing -9.0
Liberal Democrat hold Swing -8.2
Liberal Democrat hold Swing -10.6

Heslington Ward

Heslington [1] [2]
PartyCandidateVotes%±
Liberal Democrat Ceredig Jamieson-Ball 436 38.4 -15.7
Green Peter Sanderson 266 23.4 11.8
Labour Grace Fletcher-Hall 251 22.1 0.1
Conservative Julia Henniker-Heaton 182 16.0 3.8
Turnout 37.2
Liberal Democrat hold Swing -13.7

Heworth Ward

Heworth (3) [1] [2]
PartyCandidateVotes%±
Labour Paul Blanchard 1470 16.2 -1.3
Labour Ruth Potter 1456 16.1 -0.4
Labour Christina Funnell 1380 15.2 -3.6
Conservative James Schofield 830 9.2 1.4
Conservative Charlie Dyson 828 9.1 9.1
Green Jennifer Aitken 716 7.9 3.1
Conservative Andrew Wells 577 6.4 6.4
BNP Jeff Kelly 507 5.6 5.6
Liberal Democrat Sam Blackburn 487 5.4 -7.6
Liberal Democrat Robin Hazzard-Gallagher 432 4.8 -7.0
Liberal Democrat Ian Packington 382 4.2 -5.7
Turnout 37.5
Labour hold Swing -1.3
Labour hold Swing -1.8
Labour hold Swing -5.0

Heworth Without Ward

Heworth Without [1] [2]
PartyCandidateVotes%±
Conservative Bill Bennett 640 37.7 4.6
Liberal Democrat Nigel Ayre 605 35.7 -14.3
Labour Andrew Garbutt 288 17.0 0.0
Liberal Nick Blitz 89 5.2 5.2
Green Baz Buchanan 75 4.4 4.4
Turnout 55.1
Conservative gain from Liberal Democrat Swing 9.4

Holgate Ward

Holgate (3) [1] [2]
PartyCandidateVotes%±
Labour Denise Bowgett 1490 14.0 -0.9
Labour James Alexander 1413 13.2 -0.3
Labour Sonja Crisp 1303 12.2 0.5
Liberal Democrat Jonathan Stott 1286 12.0 -5.5
Liberal Democrat Martin Bartlett 1204 11.3 -6.5
Liberal Democrat Gilbert Nimo 1116 10.4 -4.8
Green Andreas Heinemeyer 691 6,5 1.8
Conservative James McGowan 645 6.0 1.2
Conservative Andrew Kay 604 5.7 5.7
Conservative Thomas Merry 465 4.4 4.4
BNP Michaela Knight 463 4.3 4.3
Turnout 43.2
Labour gain from Liberal Democrat Swing 2.3
Labour gain from Liberal Democrat Swing 3.1
Labour gain from Liberal Democrat Swing 2.6

Hull Road Ward

Hull Road (2) [1] [2]
PartyCandidateVotes%±
Labour Richard Cregan 819 18.3 -3.0
Labour Roger Pierce 803 17.9 -3.3
Conservative Thomas Crockett 643 14.3 2.1
Conservative Alan Yonge 544 12.1 12.1
Liberal Democrat Rachel Williams 414 9.2 -2.0
Green John Cossham 341 7.6 -2.2
Liberal Democrat Michael Johns-Perring 335 7.5 -3.3
Green Andrew Collingwood 327 7.3 7.3
BNP Trevor Brown 259 5.8 5.8
Turnout 35.8
Labour hold Swing -2.6
Labour hold Swing -7.7

Huntington and New Earswick Ward

Huntington and New Earswick (3) [1] [2]
PartyCandidateVotes%±
Liberal Democrat Keith Hyman 1802 18.7 -6.2
Liberal Democrat Keith Orrell 1794 18.6 -6.9
Liberal Democrat Carol Runciman 1695 17.6 -4.9
Conservative Sylvia Greenway 896 9.3 9.3
Conservative Paul Tumman 795 8.2 -0.4
Conservative Roger Holmes 707 7.3 7.3
Labour Stephen Burton 672 7.0 0.9
Green Clive Woolley 660 6.8 -0.1
Labour James Flinders 629 6.5 0.9
Turnout 37.2
Liberal Democrat hold Swing -7.8
Liberal Democrat hold Swing -3.3
Liberal Democrat hold Swing -6.1

Micklegate Ward

Micklegate (3) [1] [2]
PartyCandidateVotes%±
Labour Dave Merrett 1514 13.6 -1.7
Labour Sandy Fraser 1497 13.5 -1.9
Labour Julie Gunnell 1478 13.3 -1.3
Green Andy Chase 1414 12.7 3.8
Green Alan Swain 1266 11.4 4.1
Green Charles Everett 1097 9.9 2.8
Conservative Walter Davy 696 6.3 -0.6
Conservative Simon Darby 642 5.8 5.8
Conservative John Wilson 576 5.2 5.2
Liberal Democrat Carole Green 383 3.4 -4.5
Liberal Democrat Gillian Thompson 299 2.7 -4.6
Liberal Democrat John Tull 268 2.4 -4.8
Turnout 42.8
Labour hold Swing -2.7
Labour hold Swing -3.0
Labour hold Swing -2.0

Osbaldwick Ward

Osbaldwick [1] [2]
PartyCandidateVotes%±
Liberal Democrat Jonathan Morley 459 40.7 -9.6
Conservative Terry Smith 319 28.3 28.3
Labour Thomas Williams 222 19.7 8.2
Green David Williams 128 11.3 11.3
Turnout 42.5
Liberal Democrat hold Swing -18.9

Rural West York Ward

Rural West York (3) [1] [2]
PartyCandidateVotes%±
Conservative Ian Gillies 1993 17.0 6.0
Conservative Paul Healey 1738 14.8 2.7
Conservative Ben Hudson 1672 14.3 5.1
Liberal Democrat Glen Bradley 1644 14.0 1.3
Liberal Democrat Quentin Macdonald 1539 13.1 -2.1
Liberal Democrat Marjorie Stones 1442 12.3 0.4
Green Martin Lovedale 579 4.9 4.9
Labour Karl Smith 575 4.9 0.1
Labour Andrew Kay 532 4.5 0.6
Turnout 50.6
Conservative gain from Independent Swing N/A
Conservative gain from Liberal Democrat Swing 0.7
Conservative gain from Liberal Democrat Swing 3.6

Skelton, Rawcliffe and Clifton Without Ward

Skelton, Rawcliffe and Clifton Without (3) [1] [2]
PartyCandidateVotes%±
Liberal Democrat Irene Waudby 1404 13.3 -7.5
Conservative Joe Watt 1340 12.7 6.3
Liberal Democrat Richard Moore 1288 12.2 -4.5
Conservative Jennie Gambold 1243 11.8 5.7
Liberal Democrat Phil Thomas 1140 10.8 -6.9
Conservative Andrew McCloud 882 8.4 8.4
Labour Matthew Greenway 811 7.7 0.7
Labour Rosemary Thornton 735 7.0 1.1
Labour Iain Simpson-Laing 708 6.7 1.1
Green Nick Whittingham 530 5.0 0.6
BNP Mal Campbell 444 4.2 4.2
Turnout 38.9
Liberal Democrat hold Swing -6.6
Conservative gain from Liberal Democrat Swing 6.6
Liberal Democrat hold Swing -6.4

Strensall Ward

Strensall (2) [1] [2]
PartyCandidateVotes%±
Liberal Democrat Madeleine Kirk 1200 26.8 -2.8
Conservative Sian Wiseman 999 22.3 4.1
Liberal Democrat Ian Cuthbertson 984 22.0 -4.5
Conservative William Hanbury 770 17.2 1.3
Green Caroline Boreham 269 6.0 6.0
Labour Andrew Dixon 257 5.7 0.4
Turnout 38.9
Liberal Democrat hold Swing -2.0
Conservative gain from Liberal Democrat Swing 4.3

Westfield Ward

Westfield (3) [1] [2]
PartyCandidateVotes%±
Liberal Democrat Susan Galloway 1512 15.9 -7.1
Liberal Democrat Steve Galloway 1511 15.9 -10.3
Liberal Democrat Andrew Waller 1432 15.1 -9.6
Labour Lisa Ingham 887 9.3 1.4
Labour Rebecca Crisp 869 9.2 1.8
Labour Bob Scrase 758 8.0 1.0
Conservative Ken Beavan 457 4.8 1.2
Conservative Charles Brooks 455 4.8 4.8
Green John Forrester 437 4.6 4.6
BNP Graeme Wiles 407 4.3 4.3
Conservative Thomas Cahill 358 3.8 3.8
Monster Raving Loony Eddie Vee 407 4.3 4.3
Turnout 35.0
Liberal Democrat hold Swing -4.3
Liberal Democrat hold Swing -6.1
Liberal Democrat hold Swing -5.3

Wheldrake Ward

Wheldrake [1] [2]
PartyCandidateVotes%±
Liberal Democrat Christian Vassie 784 47.9 -14.9
Conservative Jonathan Mark Maughan 638 38.9 9.6
Labour Margaret Ruth Martin 148 9.0 1.1
Green Tracy Lynn Shippey 68 4.2 4.2
Turnout 51.1
Liberal Democrat hold Swing -12.3

Related Research Articles

Aberdeen City Council Place

Aberdeen City Council represents the Aberdeen City council area of Scotland.

Politics of Bristol

The city of Bristol, England, is a unitary authority, represented by four MPs representing seats wholly within the city boundaries. As well as these, Filton and Bradley Stoke covers the northern urban fringe in South Gloucestershire and the north eastern urban fringe is in the Kingswood constituency. The overall trend of both local and national representation became left of centre, favouring the Labour Party and Liberal Democrats during the latter 20th century, but there was a shift to the right in the 2010 general election. The city has a tradition of local activism, with environmental issues and sustainable transport being prominent issues in the city.

2007 Harlow District Council election

The 2007 Harlow District Council election took place on 3 May 2007 to elect members of Harlow District Council in Essex, England. One third of the council was up for election and the council stayed under no overall control.

2008 Hull City Council election

The 2008 Hull City Council election took place on 1 May 2008 to elect members of Hull City Council in England. One third of the council was up for election and the Liberal Democrats retained control of the council with an increased majority from a situation of ruling under no overall control.

2007 Hull City Council election

The 2007 Hull City Council election took place on 3 May 2007 to elect members of Hull City Council in England. One third of the council was up for election and the Liberal Democrats gained overall control of the council from no overall control. Overall turnout was 27%.

The 2000 Winchester Council election took place on 4 May 2000 to elect members of Winchester District Council in Hampshire, England. One third of the council was up for election and the Liberal Democrats stayed in overall control of the council.

The 2002 Halton Borough Council election took place on 2 May 2002 to elect members of Halton Unitary Council in Cheshire, England. One third of the council was up for election and the Labour party stayed in overall control of the council.

2011 Brighton and Hove City Council election

Elections to Brighton and Hove City Council were held on 5 May 2011, in line with other local elections in the United Kingdom. The whole council, a unitary authority, was up for election with 54 councillors elected from 21 wards.

2007 Pendle Borough Council election

The 2007 Pendle Borough Council election took place on 3 May 2007 to elect members of Pendle Borough Council in Lancashire, England. One third of the council was up for election and the Liberal Democrats stayed in overall control of the council.

2011 City of York Council election

Elections to City of York Council were held on Thursday 5 May 2011. The whole council was up for election. The vote took place alongside the United Kingdom Alternative Vote referendum, 2011.

2007 Basingstoke and Deane Borough Council election

The 2007 Basingstoke and Deane Council election took place on 3 May 2007 to elect members of Basingstoke and Deane Borough Council in Hampshire, England. One third of the council was up for election and the Conservative party stayed in overall control of the council.

2006 Carlisle City Council election

The 2006 Carlisle City Council election took place on 4 May 2006 to elect members of Carlisle District Council in Cumbria, England. One third of the council was up for election and the council stayed under no overall control.

2007 Carlisle City Council election

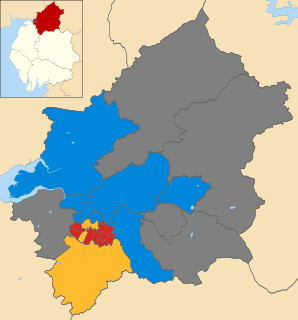
The 2007 Carlisle City Council election took place on 3 May 2007 to elect members of Carlisle District Council in Cumbria, England. One third of the council was up for election and the council stayed under no overall control.

2010 Carlisle City Council election

The 2010 Carlisle City Council election took place on 6 May 2010 to elect members of Carlisle District Council in Cumbria, England. One third of the council was up for election and the council stayed under no overall control.

2007 Leeds City Council election

The Leeds City Council election took place on 3 May 2007 to elect members of City of Leeds Metropolitan Borough Council in West Yorkshire, England. Prior to the election, the Morley Borough Independent councillor for Morley North, Stewart McArdle, had defected to Independent and Weetwood incumbent, Brian Jennings, from Liberal Democrat to Independent. One third of the council was up for election and the Conservative-Liberal Democrat Coalition remained in power now with the support of the Morley Borough Independents.

2015 City of York Council election

The 2015 City of York Council election took place on 7 May 2015 to elect members of City of York Council in England. The whole council was up for election. Turnout was substantially up across the city due to the election being held on the same day as the general election and other local elections in England.

2015 Norwich City Council election

The 2015 Norwich City Council election took place on 7 May 2015 to elect approximately one third of the members of Norwich City Council in England. This was on the same day as other local elections and the UK general election. Thirteen seats were due to be contested, with a further two seats up for election where casual vacancies had arisen. Labour won ten of the available seats, the Green Party won four, and the Liberal Democrats one. The Conservatives gained their highest ever vote in many city wards including Town Close and Thorpe Hamlet, and across Norwich came within almost 2000 votes of the Green Party, however failed to gain any seats. Just one seat changed hands - Wensum - which Labour gained from the Greens. Labour retained overall control of the council with 22 seats out of 39, the Greens continue to form the main opposition with 14 seats, and the Liberal Democrats have 3.

The 1992 York City Councils elections were held in May 1992 to elect members of York City Council in North Yorkshire, England. Fifteen seats, previously contested in 1988, were up for election: eleven were won by the Labour Party, three by the Conservative Party and one by the Liberal Democrats. The Labour Party retained overall control of the council; the composition of the council after the election was: Labour Party 34 seats, Conservative Party seven seats and Liberal Democrats four seats.

Elections to City of York Council will be held on 2 May 2019, as part of the United Kingdom local elections in 2019. In 2015, the City of York Council election saw heavy losses for the then-ruling Labour Party, losing more than 40% of the 26 seats won at the previous election in 2011. The Conservatives, Liberal Democrats and Greens all made gains and two Independent councillors were also elected. Following talks between the political groups after the election, the Conservatives and Liberal Democrats agreed to run the Council as a joint administration.

References