Sunderland City Council election, 2007

Last updated

Sunderland City Council election, 2007
Flag of England.svg
  2006 3 May 2007 2008  

One third of 75 seats on Sunderland City Council
38 seats needed for a majority

 First partySecond partyThird party
 
Party Labour Conservative Independent
Seats before58133
Seats won1771
Seats after54164
Seat changeDecrease2.svg4Increase2.svg3Increase2.svg1

 Fourth party
 
Party Liberal Democrat
Seats before1
Seats won0
Seats after1
Seat changeSteady2.svg1

Sunderland 2007 election map.png
Map of the 2007 Sunderland City Council election results. Labour in red, Conservatives in blue, and Independents in white.

Majority party before election

Labour

Majority party after election

Labour

The 2007 Sunderland Council election took place on 3 May 2007 to elect members of Sunderland Metropolitan Borough Council in Tyne and Wear, England. One third of the council was up for election and the Labour party stayed in overall control of the council. [1] [2]

City of Sunderland City and metropolitan borough in England

The City of Sunderland is a local government district of Tyne and Wear, in North East England, with the status of a city and metropolitan borough. It is named after its largest settlement, Sunderland, but covers a far larger area which includes the towns of Hetton-le-Hole, Houghton-le-Spring, and Washington, as well as a range of suburban villages.

Tyne and Wear County of England

Tyne and Wear ( ) is a metropolitan county in the North East region of England around the mouths of the rivers Tyne and Wear. It came into existence in 1974 after the passage of the Local Government Act 1972. It consists of the five metropolitan boroughs of South Tyneside, North Tyneside, City of Newcastle upon Tyne, Gateshead and City of Sunderland. It is bounded on the east by the North Sea, and has borders with Northumberland to the north and County Durham to the south.

England Country in north-west Europe, part of the United Kingdom

England is a country that is part of the United Kingdom. It shares land borders with Wales to the west and Scotland to the north-northwest. The Irish Sea lies west of England and the Celtic Sea lies to the southwest. England is separated from continental Europe by the North Sea to the east and the English Channel to the south. The country covers five-eighths of the island of Great Britain, which lies in the North Atlantic, and includes over 100 smaller islands, such as the Isles of Scilly and the Isle of Wight.

Contents

Background

Before the election the council had 57 Labour, 13 Conservative, 4 independent and 1 Liberal Democrat councillors. In the period since the previous local elections in May 2006, three councillors had left their parties to sit as Independents: Peter Maddison leaving the Liberal Democrat Group in July 2006, and Bryn Sidaway (Hendon) and George Blyth (Doxford) leaving the Labour Group in November 2006. [3] [4] Blyth's ward colleague Mike Tansey had previously left the Labour Group to sit as an Independent in November 2005, and stood for re-election as an Independent candidate in this election. [5]

Conservative Party (UK) Political party in the United Kingdom

The Conservative Party, officially the Conservative and Unionist Party, is a centre-right political party in the United Kingdom. Presently led by Theresa May, it has been the governing party since 2010. It presently has 314 Members of Parliament in the House of Commons, 249 members of the House of Lords, and 18 members of the European Parliament. It also has 31 Members of the Scottish Parliament, 12 members of the Welsh Assembly, eight members of the London Assembly and 9,008 local councillors. One of the major parties of UK politics, it has formed the government on 45 occasions, more than any other party.

Liberal Democrats (UK) Political party in the United Kingdom

The Liberal Democrats are a liberal, centrist political party in the United Kingdom. They presently have 11 Members of Parliament in the House of Commons, 96 members of the House of Lords, and one member of the European Parliament. They also have five Members of the Scottish Parliament and a member each in the Welsh Assembly and London Assembly. The party reached the height of its influence in the early 2010s, forming a junior partner in a coalition government from 2010 to 2015. It is presently led by Vince Cable.

A Councillor is a member of a local government council.

25 seats were contested in the 2007 elections with a total of 111 candidates standing. [6] These included a full 25 each from the Labour, Conservative and British National Party, as well as 16 independents, 15 Liberal Democrats, 2 Respect, 2 British First Party and 1 from the United Kingdom Independence Party. [6]

The British National Party (BNP) is a far-right, fascist political party in the United Kingdom. It is headquartered in Wigton, Cumbria, and its current leader is Adam Walker. A minor party, it has no elected representatives at any level of UK government. Founded in 1982, the party reached its greatest level of success in the 2000s, when it had over fifty seats in local government, one seat on the London Assembly, and two Members of the European Parliament.

As at the 2006 election this election saw Sunderland have three polling stations open for 10 days before election day in an attempt to make voting more convenient for voters. [7]

Election results

The results had Labour stay in control of the council but with a smaller majority. [8] The Conservatives gained 3 seats from Labour in St Chads, Washington East and Washington South to hold 16 seats compared to 54 for Labour. [9] The 2 Conservative gains in Washington were the first time the party had won seats in the town since it became part of Sunderland council. [10] Labour also lost one seat to an independent in Copt Hill, but regained another in Doxford where the sitting independent councillor, Mike Tansey, had originally been elected for the Labour party. [8] This meant there remained 4 Independents on the council, as well as 1 Liberal Democrat who was not defending a seat in the election. [9] Overall turnout in the election was 34%, up on 32% at the 2006 election. [10]

Washington, Tyne and Wear town in the City of Sunderland, in Tyne and Wear, England

Washington is a new town in the City of Sunderland local government district of Tyne and Wear, England, and part of historic County Durham. Washington is located geographically at an equal distance from the centres of Newcastle, Durham and Sunderland, hence it has close ties to all three cities.

Doxford Park human settlement in United Kingdom

Doxford Park is a suburb of Sunderland, Tyne and Wear, located to the south-west of the city centre. Doxford Park is also the name of a wooded area of land located within the suburb.

Voter turnout percentage of eligible voters who cast a ballot in an election

Voter turnout is the percentage of eligible voters who cast a ballot in an election. Eligibility varies by country, and the voting-eligible population should not be confused with the total adult population. Age and citizenship status are often among the criteria used to determine eligibility, but some countries further restrict eligibility based on sex, race, or religion.

Sunderland Local Election Result 2007 [11] [2]
PartySeatsGainsLossesNet gain/lossSeats %Votes %Votes+/−
  Labour 1704Decrease2.svg46843.331,148Increase2.svg2.8%
  Conservative 730Increase2.svg32828.120,223Decrease2.svg0.3%
  Independent 110Increase2.svg148.35,992Increase2.svg7.6%
  BNP 000Steady2.svg0010.67,653Decrease2.svg4.0%
  Liberal Democrat 000Steady2.svg008.76,293Decrease2.svg7.0%
  British First Party 000Steady2.svg000.5335Increase2.svg0.5%
  Respect 000Steady2.svg000.3224Increase2.svg0.3%
  UKIP 000Steady2.svg000.172Increase2.svg0.1%

This resulted in the following composition of the Council:

PartyPrevious CouncilNew Council
Labour5854
Conservatives1316
Independent34
Liberal Democrats11
Total7575
Working majority 41  33 

Ward by ward results

Barnes ward

Barnes [11] [12]
PartyCandidateVotes%±
Conservative Lee Martin1,76753.7+7.1
Labour Helmut Izaks74722.7-0.9
Liberal Democrat Robert Boyce49214.9-4.8
BNP John McCaffrey2878.7-1.4
Majority1,02031.0+8.0
Turnout 3,29337.7+0.4
Conservative hold Swing

Castle ward

Castle [11] [12]
PartyCandidateVotes%±
Labour Denny Wilson1,67566.0+16.3
BNP Ian McDonald39515.6-5.7
Independent Ronald McQuillan27610.9-7.7
Conservative Martin Anderson1917.5-3.0
Majority1,28050.5+22.1
Turnout 2,53730.0+1.6
Labour hold Swing

Copt Hill ward

Copt Hill [11] [12]
PartyCandidateVotes%±
Independent Colin Wakefield1,38242.9+42.9
Labour Juliana Heron1,14635.6-15.1
Conservative Richard Vardy35811.1-22.1
BNP Michael Webb1765.5-10.7
Liberal Democrat Margaret Gibbons1594.9+4.9
Majority2367.3
Turnout 3,22136.0+6.2
Independent gain from Labour Swing

Doxford ward

Doxford [11] [12]
PartyCandidateVotes%±
Labour David Errington1,04135.8-3.3
Independent Mike Tansey†92431.8+31.8
Conservative Alistair Newton70124.1-5.0
BNP Lesley Dathan2438.4-6.6
Majority1174.0-6.0
Turnout 2,90936.2+3.7
Labour hold Swing

†Mike Tansey had been elected in 2004 as a Labour candidate, but subsequently left the party to sit as an Independent councillor. The result was technically a hold for Labour although Tansey, the incumbent, lost his seat.

Fulwell ward

Fulwell [11] [12]
PartyCandidateVotes%±
Conservative John Walton2,07753.9+1.7
Labour Bob Price96825.1-0.4
Liberal Democrat Geofrey Pryke50713.1+1.1
BNP Joseph Dobbie3047.9-2.4
Majority1,10928.8+2.2
Turnout 3,85642.7+0.0
Conservative hold Swing

Hendon ward

Hendon [11] [12]
PartyCandidateVotes%±
Labour Thomas Martin1,04543.0+1.1
Independent Sammy Doran45318.6+18.6
Conservative Deborah Lorraine44218.2-2.6
BNP David Guynan36214.9-6.2
Respect Tafazzal Hussain1295.3+5.3
Majority59224.4+3.6
Turnout 2,43130.2-1.2
Labour hold Swing

Hetton ward

Hetton [11] [12]
PartyCandidateVotes%±
Labour Florence Anderson1,50655.3-1.5
Liberal Democrat Philip Dowell48917.9+17.9
BNP John Richardson40214.8-7.8
Conservative George Brown32812.0-8.6
Majority1,01737.3+3.2
Turnout 2,72531.3+3.9
Labour hold Swing

Houghton ward

Houghton [11] [12]
PartyCandidateVotes%±
Labour Kath Rolph1,49650.7+0.1
Independent John Finn54418.4+18.4
Conservative Douglas Middlemiss33811.5-5.0
Liberal Democrat Avril Snowball32611.1-7.3
BNP Peter Swain2468.3-6.2
Majority95232.3+0.0
Turnout 2,95033.8+4.2
Labour hold Swing

Millfield ward

Millfield [11] [12]
PartyCandidateVotes%±
Labour Kevin O'Connor75432.9+1.3
Liberal Democrat Jim Major69830.5-10.5
Conservative Gwennyth Gibson30613.4-1.6
BNP Christopher Lathan1988.7-3.7
Independent Rachel Moore1667.3+7.3
Respect Keith Adshead954.2+4.2
UKIP Pauline Featonby-Warren723.1+3.1
Majority562.4
Turnout 2,28931.8+2.6
Labour hold Swing

Pallion ward

Pallion [11] [12]
PartyCandidateVotes%±
Labour Paul Watson1,06144.7+1.2
Conservative Michael Leadbitter44518.7+0.5
Independent Fred Dove31413.2+13.2
BNP James Davison27911.7-7.2
Liberal Democrat Ann Hollern27711.7-7.7
Majority61625.9+1.9
Turnout 2,37630.5+0.8
Labour hold Swing

Redhill ward

Redhill [11] [12]
PartyCandidateVotes%±
Labour Richard Bell1,42656.1+5.0
BNP Ian Leadbitter58523.0-3.8
Conservative Paula Wilkinson27510.8+0.4
Independent Lesley Dixon1766.9+6.9
British First Party Julie Potter783.1+3.1
Majority84133.1+8.7
Turnout 2,54029.9+0.2
Labour hold Swing

Ryhope ward

Ryhope [11] [12]
PartyCandidateVotes%±
Labour Ellen Ball1,19441.3+0.1
Conservative Christopher Fairs87230.2+1.9
Independent Patrick Lavelle44315.3+15.3
BNP Frederick Donkin38313.2-2.7
Majority32211.1-1.8
Turnout 2,89236.1+3.5
Labour hold Swing

Sandhill ward

Sandhill [11] [12]
PartyCandidateVotes%±
Labour David Forbes1,42056.8+14.1
Conservative Gordon Newton67426.9+3.1
BNP Joseph Dobbie40816.3+0.9
Majority74629.8+11.0
Turnout 2,50230.4+1.4
Labour hold Swing

Shiney Row ward

Shiney Row [11] [12]
PartyCandidateVotes%±
Labour John Scott1,65654.2+4.2
Conservative Eddie Wake74024.2+5.5
Independent George Parkin35311.5+11.5
BNP Sharon Leadbitter30910.1-2.7
Majority91630.0-1.3
Turnout 3,05831.7+1.2
Labour hold Swing

Silksworth ward

Silksworth [11] [12]
PartyCandidateVotes%±
Labour Peter Gibson1,63755.3+9.7
Conservative Patricia Francis92931.4+8.0
BNP Anthony James39513.3-1.4
Majority70823.9+1.7
Turnout 2,96135.6+0.7
Labour hold Swing

Southwick ward

Southwick [11] [12]
PartyCandidateVotes%±
Labour Christine Shattock1,19344.8+2.7
Conservative Terence Docherty54120.3-1.0
BNP Alan Brettwood46317.4-3.7
Liberal Democrat Anne Griffin27810.4-5.1
Independent Stephen Hanratty1907.1+7.1
Majority65224.5+3.6
Turnout 2,66532.9+2.1
Labour hold Swing

St Anne's ward

St Anne's [11] [12]
PartyCandidateVotes%±
Labour Sylvia Old1,17250.4+4.9
Conservative Marjorie Matthews39917.2-3.3
BNP Deborah Boyd26011.2-5.7
British First Party John Martin25711.0+11.0
Liberal Democrat Leslie Wascoe23810.2-6.9
Majority77333.2+8.2
Turnout 2,32629.0+1.3
Labour hold Swing

St Chad's ward

St Chad's [11] [12]
PartyCandidateVotes%±
Conservative Michael Dixon1,56346.9-7.1
Labour Stuart Porthouse1,34840.4+8.9
BNP Carol Dobbie2487.4-0.3
Independent Chain Gill1755.2+5.2
Majority2156.4-16.1
Turnout 3,33442.6+1.6
Conservative gain from Labour Swing

St Michael's ward

St Michael's [11] [12]
PartyCandidateVotes%±
Conservative Peter Wood1,92859.4+6.3
Labour Michael Mordey82725.5+5.3
Independent Martin Quinn2939.0+9.0
BNP Ian Sayers1966.0-4.1
Majority1,10133.9+1.0
Turnout 3,24439.3+0.8
Conservative hold Swing

St Peter's ward

St Peter's [11] [12]
PartyCandidateVotes%±
Conservative Graham Hall1,36143.8+2.3
Labour Linda Mitchell96831.2+0.7
Liberal Democrat Diana Matthew41713.4-1.7
BNP Derek Wright2758.9-4.0
Independent Robbie Menzies862.8+2.8
Majority39312.6+1.6
Turnout 3,10737.7-0.4
Conservative hold Swing

Washington Central ward

Washington Central [11] [12]
PartyCandidateVotes%±
Labour Eric Timmins1,52248.6+4.5
Conservative Jackie Atkinson72723.2+3.1
Liberal Democrat David Snowball55617.7-4.0
BNP Clive Thompson32910.5-3.6
Majority79525.4+3.0
Turnout 3,13435.7+3.3
Labour hold Swing

Washington East ward

Washington East [11] [12]
PartyCandidateVotes%±
Conservative Ian Cuthbert1,24540.1+5.2
Labour Bryan Williams1,22039.3+1.0
Liberal Democrat Malcolm Bannister44114.2-2.7
BNP David Laing1956.3-3.6
Majority250.8
Turnout 3,10135.9+2.7
Conservative gain from Labour Swing

Washington North ward

Washington North [11] [12]
PartyCandidateVotes%±
Labour Peter Walker1,56758.0+3.2
Liberal Democrat Paul Hillman44116.3-2.3
Conservative Kathleen Irvine44116.3+1.9
BNP Lynne Hudson2549.4-2.8
Majority1,12641.7+5.5
Turnout 2,70331.3+3.2
Labour hold Swing

Washington South ward

Washington South [11] [12]
PartyCandidateVotes%±
Conservative Kathryn Chamberlin1,06637.1+7.6
Labour Louise Farthing1,01935.4+4.5
Liberal Democrat David Griffin44415.4-12.9
BNP William Ramshaw2227.7-3.7
Independent Walter Scott1244.3+4.3
Majority471.6
Turnout 2,87534.8+3.9
Conservative gain from Labour Swing

Washington West ward

Washington West [11] [12]
PartyCandidateVotes%±
Labour Harry Trueman1,54052.9+1.5
Liberal Democrat Irene Bannister53018.2-3.2
Conservative Olwyn Bird50917.5+1.0
BNP Jason Dent2398.2-2.5
Independent Ian Snowball933.2+3.2
Majority1,01034.7+4.7
Turnout 2,91133.1+2.6
Labour hold Swing

Related Research Articles

Sunderland City Council Local government body in England

Sunderland City Council is the local authority of the City of Sunderland in Tyne and Wear, England. It is a metropolitan district council, one of five in Tyne and Wear and one of 36 in the metropolitan counties of England, and provides the majority of local government services in Sunderland.

2007 St Helens Metropolitan Borough Council election

The 2007 St Helens Metropolitan Borough Council election took place on 3 May 2007 to elect members of St Helens Metropolitan Borough Council in Merseyside, England. One third of the council was up for election and the council stayed under no overall control.

2006 Calderdale Metropolitan Borough Council election

Elections to Calderdale Metropolitan Borough Council were held on 4 May 2006. One third of the council was up for election and the council stayed under no overall control with a minority Conservative administration.

2008 St Albans City and District Council election

The 2008 St Albans City and District Council election took place on 1 May 2008 to elect members of St Albans District Council in Hertfordshire, England. One third of the council was up for election and the Liberal Democrats gained overall control of the council from no overall control.

The 2008 Derby City Council election took place on 1 May 2008 to elect members of Derby City Council in England. One third of the council was up for election and the council stayed under no overall control. Overall turnout was 34.6%.

2008 Solihull Metropolitan Borough Council election

The 2008 Solihull Metropolitan Borough Council election took place on 1 May 2008 to elect members of Solihull Metropolitan Borough Council in the West Midlands, England. One third of the council was up for election and the Conservative party gained overall control of the council from no overall control.

2008 Worthing Borough Council election

The 2008 Worthing Borough Council election took place on 1 May 2008 to elect members of Worthing Borough Council in West Sussex, England. One third of the council was up for election and the Conservative party stayed in overall control of the council. Overall turnout was 35%.

2006 St Albans City and District Council election

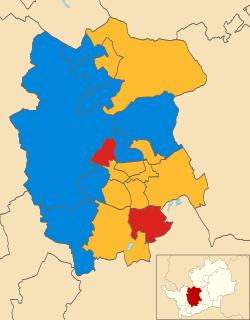
The 2006 St Albans City and District Council election took place on 4 May 2006 to elect members of St Albans District Council in Hertfordshire, England. One third of the council was up for election and the Liberal Democrats gained overall control of the council from no overall control.

2007 St Albans City and District Council election

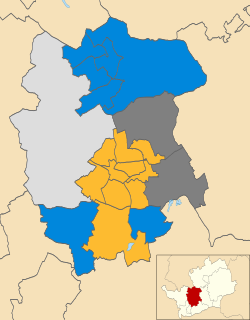
The 2007 St Albans City and District Council election took place on 3 May 2007 to elect members of St Albans District Council in Hertfordshire, England. One third of the council was up for election and the Liberal Democrats lost overall control of the council to no overall control.

2007 Winchester City Council election

The 2007 Winchester Council election took place on 3 May 2007 to elect members of Winchester District Council in Hampshire, England. One third of the council was up for election and the Conservative party stayed in overall control of the council.

The 2003 Hart Council election took place on 1 May 2003 to elect members of Hart District Council in Hampshire, England. One third of the council was up for election and the Conservative party stayed in overall control of the council.

2006 Solihull Metropolitan Borough Council election

The 2006 Solihull Metropolitan Borough Council election took place on 4 May 2006 to elect members of Solihull Metropolitan Borough Council in the West Midlands, England. One third of the council was up for election and the Conservative party stayed in overall control of the council.

2007 Solihull Metropolitan Borough Council election

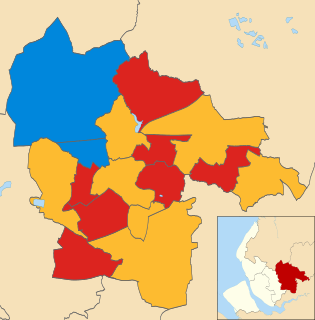
The 2007 Solihull Metropolitan Borough Council election took place on 4 May 2007 to elect members of Solihull Metropolitan Borough Council in the West Midlands, England. One third of the council was up for election and the Conservative party lost overall control of the council to no overall control.

2006 Sunderland City Council election

The 2006 Sunderland Council election took place on 4 May 2006 to elect members of Sunderland City Council in Tyne and Wear, England. One third of the Council was up for election and the Labour party stayed in overall control.

2008 Sunderland City Council election

The 2008 Sunderland Council election took place on 1 May 2008 to elect members of Sunderland Metropolitan Borough Council in Tyne and Wear, England. One third of the council was up for election and the Labour party stayed in overall control of the council.

2010 Sunderland City Council election

The 2010 Sunderland Council election took place on 6 May 2010 to elect members of Sunderland Metropolitan Borough Council in Tyne and Wear, England. One third of the council was up for election and the Labour party stayed in overall control of the council. The election took place on the same day as the 2010 General Election.

2007 Carlisle City Council election

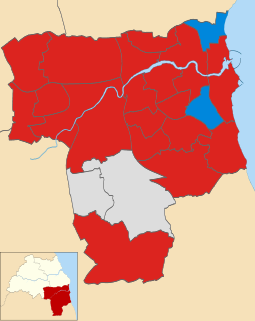
The 2007 Carlisle City Council election took place on 3 May 2007 to elect members of Carlisle District Council in Cumbria, England. One third of the council was up for election and the council stayed under no overall control.

2012 Sunderland City Council election

The 2012 Sunderland Council election took place on 3 May 2012 to elect members of Sunderland City Council in England. It was held on the same day as other United Kingdom local elections, 2012.

2006 West Oxfordshire District Council election

The 2006 West Oxfordshire District Council election took place on 4 May 2006 to elect members of West Oxfordshire District Council in Oxfordshire, England. One third of the council was up for election and the Conservative party stayed in overall control of the council.

2018 Sunderland City Council election

The 2018 Sunderland City Council election took place on 3 May 2018 to elect members of Sunderland City Council in England. The election took place on the same day as other local elections.

References

  1. "Sunderland". BBC News Online . Retrieved 2010-12-26.
  2. 1 2 "Results". The Times. 2007-05-05. p. 83.
  3. "Betrayal call as councillor leaves party" . Retrieved 2018-07-02.
  4. "Labour could face legal action over cash from councillors scandal". Mail Online. Retrieved 2018-07-02.
  5. Administrator, journallive (2006-08-10). "Councillor `treated like a pariah'". journallive. Retrieved 2018-07-02.
  6. 1 2 "Get ready to cast your vote". Evening Chronicle. 2007-05-02. p. 6.
  7. "Going to the polls early". The Northern Echo. 2007-04-23. p. 12.
  8. 1 2 "Early results give a boost to blues". The Journal. 2007-05-04. p. 4.
  9. 1 2 Young, Peter (2007-05-04). "Winners and losers". Evening Chronicle. p. 6.
  10. 1 2 "Labour still in charge - but Tories celebrate too". Sunderland Echo . 2007-05-04. Retrieved 2010-12-29.
  11. 1 2 3 4 5 6 7 8 9 10 11 12 13 14 15 16 17 18 19 20 21 22 23 24 25 26 "Results of poll". Sunderland City Council. Retrieved 2010-12-26.
  12. 1 2 3 4 5 6 7 8 9 10 11 12 13 14 15 16 17 18 19 20 21 22 23 24 25 "Thursday night's election results". The Journal . 2007-05-04. Retrieved 2010-12-29.
Preceded by
Sunderland City Council election, 2006
Sunderland City Council elections Succeeded by
Sunderland City Council election, 2008