| |||||||||||||||||||||||||||||||||||||||||||||||
One third of 75 seats on Sunderland City Council 38 seats needed for a majority | |||||||||||||||||||||||||||||||||||||||||||||||
---|---|---|---|---|---|---|---|---|---|---|---|---|---|---|---|---|---|---|---|---|---|---|---|---|---|---|---|---|---|---|---|---|---|---|---|---|---|---|---|---|---|---|---|---|---|---|---|
| |||||||||||||||||||||||||||||||||||||||||||||||
Map of the 2008 Sunderland City Council election results. Labour in red, Conservatives in blue, Lib Dems in yellow and Independents in white. | |||||||||||||||||||||||||||||||||||||||||||||||
|
The 2008 Sunderland Council election took place on 1 May 2008 to elect members of Sunderland Metropolitan Borough Council in Tyne and Wear, England. One third of the council was up for election and the Labour party stayed in overall control of the council. [1] [2]
The City of Sunderland is a local government district of Tyne and Wear, in North East England, with the status of a city and metropolitan borough. It is named after its largest settlement, Sunderland, but covers a far larger area which includes the towns of Hetton-le-Hole, Houghton-le-Spring, and Washington, as well as a range of suburban villages.
Tyne and Wear ( ) is a metropolitan county in the North East region of England around the mouths of the rivers Tyne and Wear. It came into existence in 1974 after the passage of the Local Government Act 1972. It consists of the five metropolitan boroughs of South Tyneside, North Tyneside, City of Newcastle upon Tyne, Gateshead and City of Sunderland. It is bounded on the east by the North Sea, and has borders with Northumberland to the north and County Durham to the south.
England is a country that is part of the United Kingdom. It shares land borders with Wales to the west and Scotland to the north-northwest. The Irish Sea lies west of England and the Celtic Sea lies to the southwest. England is separated from continental Europe by the North Sea to the east and the English Channel to the south. The country covers five-eighths of the island of Great Britain, which lies in the North Atlantic, and includes over 100 smaller islands, such as the Isles of Scilly and the Isle of Wight.
Before the election the council had 53 Labour, 17 Conservative, 4 independents and 1 Liberal Democrat councillors. 25 seats were contested in the election with a record 70,828 voters being registered to vote by post, a third of all registered voters. [3]
The Conservative Party, officially the Conservative and Unionist Party, is a centre-right political party in the United Kingdom. Presently led by Theresa May, it has been the governing party since 2010. It presently has 314 Members of Parliament in the House of Commons, 249 members of the House of Lords, and 18 members of the European Parliament. It also has 31 Members of the Scottish Parliament, 12 members of the Welsh Assembly, eight members of the London Assembly and 9,008 local councillors. One of the major parties of UK politics, it has formed the government on 45 occasions, more than any other party.
The Liberal Democrats are a liberal, centrist political party in the United Kingdom. They presently have 11 Members of Parliament in the House of Commons, 96 members of the House of Lords, and one member of the European Parliament. They also have five Members of the Scottish Parliament and a member each in the Welsh Assembly and London Assembly. The party reached the height of its influence in the early 2010s, forming a junior partner in a coalition government from 2010 to 2015. It is presently led by Vince Cable.
A Councillor is a member of a local government council.
In the period since the previous local elections, the Conservatives had won a seat from Labour in a by-election in September 2007 in Washington East. [4] Two Labour councillors who had left the party in November 2006 to sit as Independents, George Blyth in Doxford and Bryn Sidaway in Hendon, retired at this election.
The results saw Labour remain in control of the council, but with a reduced majority after the Conservative party gained 5 seats, [5] including 4 from Labour. [6] The Conservatives gained 2 seats from Labour in Washington and a seat each in Ryhope and St Chads, while also taking a seat from an independent, formerly Labour, councillor in Doxford. [7] The Conservative gains took the party to 22 seats, compared to 48 for Labour. [8] Labour also lost 2 seats to independents in Copt Hill and Houghton wards, but did take one seat back in Hendon which had been held by an independent. [8] [7] This meant there were 4 independents on the council, while the Liberal Democrats remained on 1 seat. [8] Overall turnout in the election was 34.9%. [9]
Washington is a new town in the City of Sunderland local government district of Tyne and Wear, England, and part of historic County Durham. Washington is located geographically at an equal distance from the centres of Newcastle, Durham and Sunderland, hence it has close ties to all three cities.
Ryhope is a coastal village along the southern boundary of the City of Sunderland, in Tyne and Wear, North East England. With a population of approximately 14,000, measured at 10.484 in the 2011 census, Ryhope is 2.9 miles to the centre of Sunderland, 2.8 miles to the centre of Seaham, and 1.2 miles from the main A19.
Doxford Park is a suburb of Sunderland, Tyne and Wear, located to the south-west of the city centre. Doxford Park is also the name of a wooded area of land located within the suburb.
The leader of the Conservatives on the council, Lee Martin, put the Labour losses partly down to national issues such as the abolition of the 10 pence income tax rate and partly down to local issues. [10] The Labour leader of the council described the results as "mid-term blues", while the defeat of the Labour cabinet member Joseph Lawson in Houghton ward to an independent was put down to plans to shut a quarry in the area. [11]
An income tax is a tax imposed on individuals or entities (taxpayers) that varies with respective income or profits. Income tax generally is computed as the product of a tax rate times taxable income. Taxation rates may vary by type or characteristics of the taxpayer.
A quarry is a type of open-pit mine in which dimension stone, rock, construction aggregate, riprap, sand, gravel, or slate is excavated from the ground.
Party | Seats | Gains | Losses | Net gain/loss | Seats % | Votes % | Votes | +/− | |
---|---|---|---|---|---|---|---|---|---|
Labour | 13 | 1 | 6 | 52 | 39.6 | 29,109 | |||
Conservative | 9 | 5 | 0 | 36 | 32 | 23,547 | |||
Liberal Democrat | 1 | 0 | 0 | 4 | 11.6 | 8,543 | |||
BNP | 0 | 0 | 0 | 0 | 10.2 | 7,540 | |||
Independent | 2 | 2 | 2 | 8 | 6.4 | 4,710 | |||
The Left Party | 0 | 0 | 0 | 0 | 0.1 | 90 | |||
UKIP | 0 | 0 | 0 | 0 | 0.1 | 40 |
This resulted in the following composition of the Council:
Party | Previous Council | New Council | |
---|---|---|---|
Labour | 53 | 48 | |
Conservatives | 17 | 22 | |
Independent | 4 | 4 | |
Liberal Democrats | 1 | 1 | |
Total | 75 | 75 | |
Working majority | 31 | 21 |
Party | Candidate | Votes | % | ± | |
---|---|---|---|---|---|
Conservative | Anthony Morrissey | 1,712 | 51.6 | -2.1 | |
Labour | Philip Routledge | 809 | 24.4 | +1.7 | |
Liberal Democrat | Gulya Dixon | 489 | 14.7 | -0.2 | |
BNP | Robert Fletcher | 308 | 9.3 | +0.6 | |
Majority | 903 | 27.2 | -3.8 | ||
Turnout | 3,318 | 38.0 | +0.3 | ||
Conservative hold | Swing |
Party | Candidate | Votes | % | ± | |
---|---|---|---|---|---|
Labour | Tommy Foster | 1,376 | 52.8 | -13.2 | |
BNP | John Humble | 350 | 13.4 | -2.2 | |
Conservative | Clair Hall | 343 | 13.2 | +5.7 | |
Independent | Ronald McQuillan | 264 | 10.1 | -0.8 | |
Liberal Democrat | Jon Dewart | 182 | 7.0 | +7.0 | |
The Left Party | Gary Duncan | 90 | 3.5 | +3.5 | |
Majority | 1,026 | 39.4 | -11.1 | ||
Turnout | 2,605 | 30.5 | +0.5 | ||
Labour hold | Swing |
Party | Candidate | Votes | % | ± | |
---|---|---|---|---|---|
Independent | Derrick Smith | 1,487 | 45.6 | +2.7 | |
Labour | Joan Carthy | 1,123 | 34.5 | -1.1 | |
Conservative | George Brown | 451 | 13.8 | +2.7 | |
BNP | Terence Woolford | 197 | 6.0 | +0.5 | |
Majority | 364 | 11.2 | +3.9 | ||
Turnout | 3,258 | 36.7 | +0.7 | ||
Independent gain from Labour | Swing | ||||
Party | Candidate | Votes | % | ± | |
---|---|---|---|---|---|
Conservative | Richard Vardy | 1,178 | 41.6 | +17.5 | |
Labour | Linda Mitchell | 991 | 35.0 | -0.8 | |
Liberal Democrat | Lewis Green | 371 | 13.1 | +13.1 | |
BNP | Peter Swain | 292 | 10.3 | +1.9 | |
Majority | 187 | 6.6 | |||
Turnout | 2,832 | 35.7 | -0.5 | ||
Conservative gain from Labour | Swing | ||||
The incumbent Labour councillor, George Blyth, had been elected in 2004 as a Labour candidate, but subsequently left the party to sit as an Independent councillor, and retired at this election.
Party | Candidate | Votes | % | ± | |
---|---|---|---|---|---|
Conservative | Bob Francis | 2,092 | 53.2 | -0.7 | |
Labour | Bob Price | 1,032 | 26.2 | +1.1 | |
Liberal Democrat | Geoffrey Pryke | 459 | 11.7 | -1.4 | |
BNP | Frederick Donkin | 352 | 8.9 | +1.0 | |
Majority | 1,060 | 26.9 | -1.9 | ||
Turnout | 3,935 | 43.5 | +0.8 | ||
Conservative hold | Swing |
Party | Candidate | Votes | % | ± | |
---|---|---|---|---|---|
Labour | Michael Mordey | 874 | 36.4 | -6.6 | |
Independent | Sammy Doran | 557 | 23.2 | +4.6 | |
Conservative | Deborah Lorraine | 517 | 21.5 | +3.3 | |
BNP | Ian Sayers | 234 | 9.7 | -5.2 | |
Liberal Democrat | Nathan Hazlett | 219 | 9.1 | +9.1 | |
Majority | 317 | 13.2 | -11.2 | ||
Turnout | 2,401 | 29.5 | -0.7 | ||
Labour gain from Independent | Swing | ||||
The incumbent Labour councillor, Bryn Sidaway, had been elected in 2004 as a Labour candidate, but subsequently left the party to sit as an Independent councillor, and retired at this election.
Party | Candidate | Votes | % | ± | |
---|---|---|---|---|---|
Labour | Jim Blackburn | 1,843 | 69.2 | +13.9 | |
Conservative | Douglas Middlemiss | 821 | 30.8 | +18.8 | |
Majority | 1,022 | 38.4 | +1.1 | ||
Turnout | 2,664 | 30.6 | -0.7 | ||
Labour hold | Swing |
Party | Candidate | Votes | % | ± | |
---|---|---|---|---|---|
Independent | Sheila Ellis | 1,415 | 44.8 | +26.4 | |
Labour | Joe Lawson | 1,168 | 37.0 | -13.7 | |
Conservative | Edward Allen | 355 | 11.2 | -0.3 | |
BNP | Kevin Robe | 219 | 6.9 | -1.4 | |
Majority | 247 | 7.8 | |||
Turnout | 3,157 | 35.8 | +2.0 | ||
Independent gain from Labour | Swing | ||||
Party | Candidate | Votes | % | ± | |
---|---|---|---|---|---|
Liberal Democrat | Paul Dixon | 1,059 | 46.0 | +15.5 | |
Labour | Bob Bowman | 558 | 24.3 | -8.6 | |
Conservative | Gwennyth Gibson | 346 | 15.0 | +1.6 | |
BNP | Christopher Lathan | 179 | 7.8 | -0.9 | |
Independent | Margaret Snaith | 84 | 3.7 | -3.6 | |
UKIP | Pauline Featonby-Warren | 40 | 1.7 | -1.4 | |
Independent | Gary Hollern | 35 | 1.5 | +1.5 | |
Majority | 501 | 21.8 | |||
Turnout | 2,301 | 32.3 | +0.5 | ||
Liberal Democrat hold | Swing |
Party | Candidate | Votes | % | ± | |
---|---|---|---|---|---|
Labour | Amy Wilson | 1,055 | 44.3 | -0.4 | |
Conservative | Michael Leadbitter | 645 | 27.1 | +8.4 | |
BNP | Paul Humble | 377 | 15.8 | +4.1 | |
Liberal Democrat | Sham Vedhara | 305 | 12.8 | +1.1 | |
Majority | 410 | 17.2 | -8.7 | ||
Turnout | 2,382 | 31.6 | +1.1 | ||
Labour hold | Swing |
Party | Candidate | Votes | % | ± | |
---|---|---|---|---|---|
Labour | Bryan Charlton | 1,315 | 49.5 | -6.6 | |
BNP | John Martin | 517 | 19.5 | -3.5 | |
Independent | Ian Leadbitter | 359 | 13.5 | +6.6 | |
Conservative | Martin Anderson | 279 | 10.5 | -0.3 | |
Liberal Democrat | Rob Boyce | 185 | 7.0 | +7.0 | |
Majority | 798 | 30.1 | -3.0 | ||
Turnout | 2,655 | 31.0 | +1.1 | ||
Labour hold | Swing |
Party | Candidate | Votes | % | ± | |
---|---|---|---|---|---|
Conservative | Christopher Fairs | 1,012 | 33.7 | +3.5 | |
Labour | Ronald Bainbridge | 983 | 32.7 | -8.6 | |
Independent | Patrick Lavelle | 509 | 16.9 | +1.6 | |
BNP | Wayne Watts | 291 | 9.7 | -3.5 | |
Liberal Democrat | David Slone | 209 | 7.0 | +7.0 | |
Majority | 29 | 1.0 | |||
Turnout | 3,004 | 37.3 | +1.2 | ||
Conservative gain from Labour | Swing | ||||
Party | Candidate | Votes | % | ± | |
---|---|---|---|---|---|
Labour | Jim Scott | 1,196 | 47.0 | -9.8 | |
Conservative | Paula Wilkinson | 662 | 26.0 | -0.9 | |
BNP | Carl Donkin | 358 | 14.1 | -2.2 | |
Liberal Democrat | Robert Peel | 327 | 12.9 | +12.9 | |
Majority | 534 | 21.0 | -8.8 | ||
Turnout | 2,543 | 30.7 | +0.3 | ||
Labour hold | Swing |
Party | Candidate | Votes | % | ± | |
---|---|---|---|---|---|
Labour | Anne Hall | 1,571 | 48.4 | -5.8 | |
Conservative | Joyce Wake | 900 | 27.7 | +3.5 | |
Liberal Democrat | Carol Attewell | 424 | 13.1 | +13.1 | |
BNP | Ian Baillie | 350 | 10.8 | +0.7 | |
Majority | 671 | 20.7 | -9.3 | ||
Turnout | 3,245 | 33.4 | +1.7 | ||
Labour hold | Swing |
Party | Candidate | Votes | % | ± | |
---|---|---|---|---|---|
Labour | Pat Smith | 1,503 | 49.3 | -6.0 | |
Conservative | Patricia Francis | 866 | 28.4 | -3.0 | |
BNP | Anthony James | 406 | 13.3 | +0.0 | |
Liberal Democrat | Alf Fowler | 275 | 9.0 | +9.0 | |
Majority | 637 | 20.9 | -3.0 | ||
Turnout | 3,050 | 36.7 | +1.1 | ||
Labour hold | Swing |
Party | Candidate | Votes | % | ± | |
---|---|---|---|---|---|
Labour | Rosalind Copeland | 1,151 | 43.5 | -1.3 | |
Conservative | Terence Docherty | 702 | 26.5 | +6.2 | |
BNP | Alan Brettwood | 530 | 20.0 | +2.6 | |
Liberal Democrat | Anne Griffin | 263 | 9.9 | -0.5 | |
Majority | 449 | 17.0 | -7.5 | ||
Turnout | 2,646 | 32.7 | -0.2 | ||
Labour hold | Swing |
Party | Candidate | Votes | % | ± | |
---|---|---|---|---|---|
Labour | Susan Watson | 1,089 | 45.3 | -5.1 | |
Conservative | Shaun Cudworth | 528 | 22.0 | +4.8 | |
BNP | Julie Potter | 415 | 17.3 | +6.1 | |
Liberal Democrat | Simon Dawes | 371 | 15.4 | +5.2 | |
Majority | 561 | 23.3 | -9.9 | ||
Turnout | 2,403 | 29.5 | +0.5 | ||
Labour hold | Swing |
Party | Candidate | Votes | % | ± | |
---|---|---|---|---|---|
Conservative | Alan Wright | 1,660 | 50.3 | +3.4 | |
Labour | Darryl Dixon | 1,206 | 36.5 | -3.9 | |
BNP | Lynne Hudson | 249 | 7.5 | +0.1 | |
Liberal Democrat | Diana Lambton | 185 | 5.6 | +5.6 | |
Majority | 454 | 13.8 | +7.4 | ||
Turnout | 3,300 | 41.7 | -0.9 | ||
Conservative gain from Labour | Swing | ||||
Party | Candidate | Votes | % | ± | |
---|---|---|---|---|---|
Conservative | Margaret Forbes | 2,046 | 60.2 | +0.8 | |
Labour | Lewis Atkinson | 797 | 23.4 | -2.1 | |
Liberal Democrat | Les Wascoe | 342 | 10.1 | +10.1 | |
BNP | Joanne Cruickshanks | 216 | 6.4 | +0.4 | |
Majority | 1,249 | 36.7 | +2.8 | ||
Turnout | 3,401 | 40.8 | +1.5 | ||
Conservative hold | Swing |
Party | Candidate | Votes | % | ± | |
---|---|---|---|---|---|
Conservative | Lilian Walton | 1,501 | 47.8 | +4.0 | |
Labour | Stephen Bonallie | 840 | 26.7 | -4.5 | |
Liberal Democrat | Diana Matthew | 443 | 14.1 | +0.7 | |
BNP | Derek Wright | 358 | 11.4 | +2.5 | |
Majority | 661 | 21.0 | +8.4 | ||
Turnout | 3,142 | 37.8 | +0.1 | ||
Conservative hold | Swing |
Party | Candidate | Votes | % | ± | |
---|---|---|---|---|---|
Labour | Dianne Snowdon | 1,283 | 40.3 | -8.3 | |
Conservative | Hilary Johnson | 833 | 26.2 | +3.0 | |
Liberal Democrat | John Mclelland | 741 | 23.3 | +5.6 | |
BNP | Clive Thompson | 328 | 10.3 | -0.2 | |
Majority | 450 | 14.1 | -11.3 | ||
Turnout | 3,185 | 36.3 | +0.6 | ||
Labour hold | Swing |
Party | Candidate | Votes | % | ± | |
---|---|---|---|---|---|
Conservative | Ivan Richardson | 1,384 | 43.2 | +3.1 | |
Labour | Neville Padgett | 1,291 | 40.3 | +1.0 | |
Liberal Democrat | Malcolm Bannister | 401 | 12.5 | -1.7 | |
BNP | Paul Masters | 130 | 4.1 | -2.2 | |
Majority | 93 | 2.9 | +2.1 | ||
Turnout | 3,206 | 37.1 | +1.2 | ||
Conservative gain from Labour | Swing | ||||
Party | Candidate | Votes | % | ± | |
---|---|---|---|---|---|
Labour | John Kelly | 1,490 | 53.0 | -5.0 | |
Conservative | Kathleen Irvine | 625 | 22.2 | +5.9 | |
Liberal Democrat | Steve Thomas | 365 | 13.0 | -3.3 | |
BNP | Lynne Baillie | 329 | 11.7 | +2.3 | |
Majority | 865 | 30.8 | -10.9 | ||
Turnout | 2,809 | 32.3 | +1.0 | ||
Labour hold | Swing |
Party | Candidate | Votes | % | ± | |
---|---|---|---|---|---|
Conservative | Eddie Wake | 1,326 | 42.5 | +5.4 | |
Labour | Linda Williams | 1,173 | 37.6 | +2.2 | |
Liberal Democrat | David Griffin | 390 | 12.5 | -2.9 | |
BNP | Mildred Smart | 229 | 7.3 | -0.4 | |
Majority | 153 | 4.9 | +3.3 | ||
Turnout | 3,118 | 37.5 | +2.7 | ||
Conservative gain from Labour | Swing | ||||
Party | Candidate | Votes | % | ± | |
---|---|---|---|---|---|
Labour | Bernard Scaplehorn | 1,392 | 46.1 | -6.8 | |
Conservative | Olwyn Bird | 763 | 25.3 | +7.8 | |
Liberal Democrat | Irene Bannister | 538 | 17.8 | -0.4 | |
BNP | Doreen Smart | 326 | 10.8 | +2.6 | |
Majority | 629 | 20.8 | -13.9 | ||
Turnout | 3,019 | 33.9 | +0.8 | ||
Labour hold | Swing |
The 2003 West Lancashire District Council election took place on 1 May 2003 to elect members of West Lancashire District Council in Lancashire, England. One third of the council was up for election and the Conservative party stayed in overall control of the council.
Sunderland City Council is the local authority of the City of Sunderland in Tyne and Wear, England. It is a metropolitan district council, one of five in Tyne and Wear and one of 36 in the metropolitan counties of England, and provides the majority of local government services in Sunderland.
Elections to Purbeck District Council were held on 1 May 2008. Nine of the twenty-four seats on the council were up for election and the council stayed under no overall control. Overall turnout was 44.86%.
The 2008 Thurrock Council election took place on 1 May 2008 to elect members of Thurrock Council in Essex, England. One third of the council was up for election and the council stayed under no overall control.
Elections to Weymouth and Portland Borough Council in Dorset, England were held on 1 May 2008. One third of the council was up for election and the council stayed under no overall control as it has been since 1980.
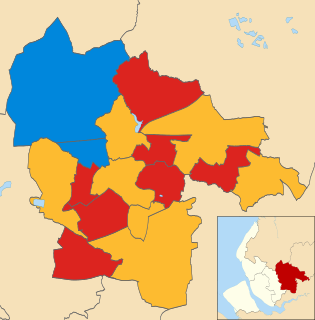
The 2007 St Helens Metropolitan Borough Council election took place on 3 May 2007 to elect members of St Helens Metropolitan Borough Council in Merseyside, England. One third of the council was up for election and the council stayed under no overall control.
The 2006 Winchester Council election took place on 4 May 2006 to elect members of Winchester District Council in Hampshire, England. One third of the council was up for election and the Conservative party gained overall control of the council from no overall control.
The 2008 Cheltenham Council election took place on 1 May 2008 to elect members of Cheltenham Borough Council in Gloucestershire, England. Half of the council was up for election and the council stayed under no overall control.
The 2004 Solihull Metropolitan Borough Council election took place on 10 June 2004 to elect members of Solihull Metropolitan Borough Council in the West Midlands, England. The whole council was up for election with boundary changes since the last election in 2003. The Conservative party stayed in overall control of the council.
The 1999 Sunderland Council election took place on 6 May 1999 to elect members of Sunderland Metropolitan Borough Council in Tyne and Wear, England. One third of the council was up for election and the Labour party stayed in overall control of the council.
The 2002 Sunderland Council election took place on 2 May 2002 to elect members of Sunderland Metropolitan Borough Council in Tyne and Wear, England. One third of the council was up for election and the Labour party stayed in overall control of the council.
The 2003 Sunderland Council election took place on 1 May 2003 to elect members of Sunderland Metropolitan Borough Council in Tyne and Wear, England. One third of the council was up for election and the Labour party stayed in overall control of the council.
The 2006 Sunderland Council election took place on 4 May 2006 to elect members of Sunderland City Council in Tyne and Wear, England. One third of the Council was up for election and the Labour party stayed in overall control.
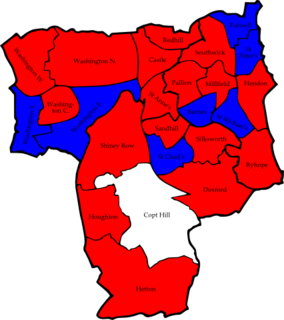
The 2007 Sunderland Council election took place on 3 May 2007 to elect members of Sunderland Metropolitan Borough Council in Tyne and Wear, England. One third of the council was up for election and the Labour party stayed in overall control of the council.
The 2010 Sunderland Council election took place on 6 May 2010 to elect members of Sunderland Metropolitan Borough Council in Tyne and Wear, England. One third of the council was up for election and the Labour party stayed in overall control of the council. The election took place on the same day as the 2010 General Election.
The 2008 Stroud Council election took place on 1 May 2008 to elect members of Stroud District Council in Gloucestershire, England. One third of the council was up for election and the Conservative party stayed in overall control of the council.
The 2011 Sunderland Council election took place on 5 May 2011 to elect members of Sunderland Metropolitan Borough Council in Tyne and Wear, England. One third of the council was up for election and the Labour party stayed in overall control of the council.
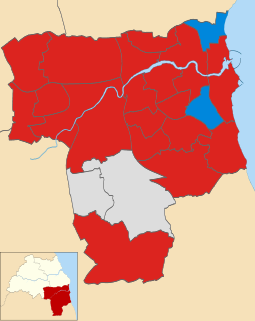
The 2012 Sunderland Council election took place on 3 May 2012 to elect members of Sunderland City Council in England. It was held on the same day as other United Kingdom local elections, 2012.
The 2008 Colchester Borough Council election took place on 1 May 2008 to elect members of Colchester Borough Council in Essex, England. One third of the council was up for election and the Conservative party lost overall control of the council to no overall control.
The 2016 Sunderland City Council election took place on 5 May 2016 to elect one-third of the members of Sunderland City Council in England. This was on the same day as other local elections held across the United Kingdom.
Preceded by Sunderland City Council election, 2007 | Sunderland City Council elections | Succeeded by Sunderland City Council election, 2010 |