Durham County Council election, 2008

Last updated

Results by electoral division. Key:
Conservative
Labour
Liberal Democrat
Independent
Derwentside Independents
Striped wards have mixed representation. Durham UK local election 2008 map.svg
Results by electoral division. Key:
  Conservative
  Labour
  Liberal Democrat
  Independent
  Derwentside Independents
Striped wards have mixed representation.

Elections to Durham County Council took place on 1 May 2008, along with other local elections in the UK. This was the first election to the unitary authority established as part of the 2009 changes to local government, [1] and all seats were up for election using the first past the post voting system. The election saw the council double in size to 126 councillors, with 63 electoral divisions each returning two members. [2]

Durham County Council British administrative body

Durham County Council is the local authority of the non-metropolitan County Durham in North East England. Since 2009 it has been a unitary authority, having the powers of a non-metropolitan county and district council combined. From 1889 to 2009 it was a county council in a two-tier arrangement.

Unitary authorities of England top and only level of local government in some parts of England

Unitary authorities of England are local authorities that are responsible for the provision of all local government services within a district. They are constituted under the Local Government Act 1992, which amended the Local Government Act 1972 to allow the existence of counties that do not have multiple districts. They typically allow large towns to have separate local authorities from the less urbanised parts of their counties and provide a single authority for small counties where division into districts would be impractical. Unitary authorities do not cover all of England. Most were established during the 1990s and a further tranche were created in 2009. Unitary authorities have the powers and functions that are elsewhere separately administered by councils of non-metropolitan counties and the non-metropolitan districts within them.

Contents

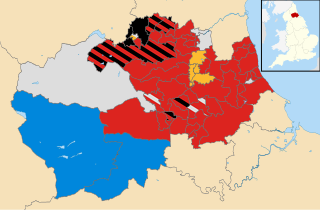
Labour kept control of the council with 67 seats. The Liberal Democrats were second with 27 seats and the Conservatives won 10. There were also 22 independents elected.

The Labour Party is a centre-left political party in the United Kingdom which has been described as an alliance of social democrats, democratic socialists and trade unionists. The party's platform emphasises greater state intervention, social justice and strengthening workers' rights.

Liberal Democrats (UK) Political party in the United Kingdom

The Liberal Democrats are a liberal political party in the United Kingdom. They presently have 11 Members of Parliament in the House of Commons, 96 members of the House of Lords, and one member of the European Parliament. They also have five Members of the Scottish Parliament and a member each in the Welsh Assembly and London Assembly. The party reached the height of its influence in the early 2010s, forming a junior partner in a coalition government from 2010 to 2015. It is presently led by Vince Cable.

Conservative Party (UK) Political party in the United Kingdom

The Conservative Party, officially the Conservative and Unionist Party, is a centre-right political party in the United Kingdom. The governing party since 2010, it is the largest in the House of Commons, with 314 Members of Parliament, and also has 249 members of the House of Lords, 18 members of the European Parliament, 31 Members of the Scottish Parliament, 12 members of the Welsh Assembly, eight members of the London Assembly and 9,008 local councillors.

Results

Durham County Council election, 2008
PartySeatsGainsLossesNet gain/lossSeats %Votes %Votes+/−
  Labour 67N/AN/AN/A 53.2% 40.4% 106,714N/A
  Liberal Democrat 27N/AN/AN/A 21.4% 22.3% 58,783N/A
  Independent 12N/AN/AN/A 9.5% 12.9% 34,035N/A
  Conservative 10N/AN/AN/A 7.9% 12.9% 33,924N/A
  Derwentside Independents 10N/AN/AN/A 7.9% 6.2% 16,385N/A
  BNP 0N/AN/AN/A 0.0% 3.8% 10,014N/A
  Teesdale Independent Association 0N/AN/AN/A 0.0% 1.3% 3,493N/A
  Green 0N/AN/AN/A 0.0% 0.1% 228N/A
  UKIP 0N/AN/AN/A 0.0% 0.1% 184N/A
 Durham Taxpayers Alliance 0N/AN/AN/A 0.0% 0.0% 111N/A

Results by electoral division

Chester-le-Street (14 seats)

Chester-le-Street North & East
PartyCandidateVotes%±
Conservative Beaty Bainbridge 1,144 23.8N/A
Labour John Shiell 999 20.8N/A
Labour Tracie Smith 983 20.5N/A
Conservative Maureen May 865 18.0N/A
Independent Lancelot Brown 807 16.8N/A
Chester-le-Street South
PartyCandidateVotes%±
Labour Keith Davidson 898 17.7N/A
Conservative Alan Bainbridge 872 17.2N/A
Liberal Democrat Philip Nathan 813 16.0N/A
Labour Heather Liddle 737 14.5N/A
Conservative Nick Varley 611 12.0N/A
Liberal Democrat Brian Kinghorn 590 11.6N/A
Independent John Adey 560 11.0N/A
Chester-le-Street West Central
PartyCandidateVotes%±
Labour Simon Henig 1,176 41.8N/A
Labour Linda Marshall 1,037 36.8N/A
Conservative Jacquelyn Butler 603 21.4N/A
Lumley
PartyCandidateVotes%±
Independent A Bell 963 21.4N/A
Independent A Willis 959 21.3N/A
Labour B Walker 866 19.2N/A
Labour R Carr 709 15.7N/A
Conservative L D Nicholson 387 8.6N/A
Conservative J A Watson 340 7.5N/A
Liberal Democrat F Rowe 148 3.3N/A
Liberal Democrat G Cutting 137 3.0N/A
Ouston and Urpeth
PartyCandidateVotes%±
Labour M Potts 868 21.5N/A
Labour C Carr 795 19.7N/A
Liberal Democrat G H Gardner 779 19.3N/A
Conservative J Gray 546 13.5N/A
Liberal Democrat D E Jackson 525 13.0N/A
Conservative O P May 520 12.9N/A
Pelton
PartyCandidateVotes%±
Labour J Cordon 1,241 34.8N/A
Conservative P H May 1,240 34.8N/A
Labour M Sekowski 1,084 30.4N/A
Sacriston
PartyCandidateVotes%±
Labour A Turner 996 33.1N/A
Labour A Wright 945 31.4N/A
Liberal Democrat L M Cowan 396 13.1N/A
Liberal Democrat E Waugh 363 12.0N/A
Conservative M Watson 313 10.4N/A

Derwentside (22 seats)

Annfield Plain
PartyCandidateVotes%±
Derwentside Independents J Nicholson 899 25.0N/A
Labour M Hodgson 838 23.3N/A
Derwentside Independents D Walker 659 18.3N/A
Labour C Christer 653 18.2N/A
Liberal Democrat D Rolfe 382 10.6N/A
Conservative J M Webb 165 4.6N/A
Benfieldside
PartyCandidateVotes%±
Derwentside Independents D I Barnett 638 16.9N/A
Derwentside Independents S Robinson 587 15.6N/A
Labour J Davies 536 14.2N/A
Independent K Devanney 533 14.1N/A
Labour D Llewellyn 491 12.8N/A
Liberal Democrat K English 475 12.4N/A
Conservative R Ellis 308 8.0N/A
Liberal Democrat J Fletcher 272 7.1N/A
Burnopfield and Dipton
PartyCandidateVotes%±
Derwentside Independents B Alderson 1,117 25.3N/A
Derwentside Independents R Ord 1,033 23.4N/A
Labour E Turnbull 582 13.2N/A
Labour J Carr 568 12.9N/A
Liberal Democrat B Cook 443 10.0N/A
Liberal Democrat I Milburn 409 9.3N/A
Conservative R Ross 268 6.1N/A
Consett North
PartyCandidateVotes%±
Liberal Democrat O Temple 1,026 22.1N/A
Labour C Robson 916 19.7N/A
Liberal Democrat N English 839 18.0N/A
Derwentside Independents M Westgarth 693 14.9N/A
Labour C Clarke 537 11.5N/A
Derwentside Independents F Todd 455 9.8N/A
UKIP A McDonald 184 3.9N/A
Craghead and Southmoor
PartyCandidateVotes%±
Labour J Docherty 1,042 33.1N/A
Labour D Marshall 903 28.7N/A
Independent L Vaux 651 20.7N/A
Liberal Democrat C English 317 10.1N/A
Conservative R Dent 237 7.5N/A
Delves Lane and Consett South
PartyCandidateVotes%±
Labour B Young 1,085 20.8N/A
Labour J Brown 958 18.4N/A
Derwentside Independents A Westgarth 925 17.8N/A
Derwentside Independents D Hicks 714 13.7N/A
Independent I McElhone 616 11.8N/A
Independent R McArdle 374 7.2N/A
Conservative J Ross 293 5.6N/A
Liberal Democrat L Temple 242 4.6N/A
Esh
PartyCandidateVotes%±
Labour J Armstrong 793 22.1N/A
Derwentside Independents M Campbell 781 21.7N/A
Labour B Armstrong 703 19.6N/A
Liberal Democrat F Reynolds 494 13.7N/A
Liberal Democrat A Simpson 459 10.1N/A
Conservative P A Adams 364 10.1N/A
Lanchester
PartyCandidateVotes%±
Derwentside Independents R Young 1,188 25.4N/A
Labour O Johnson 1,172 25.0N/A
Labour M Gray 975 20.1N/A
Conservative M Carr 890 18.9N/A
Liberal Democrat B Gilmore 460 9.8N/A
Leadgate and Medomsley
PartyCandidateVotes%±
Derwentside Independents W Stelling 1,937 33.3N/A
Derwentside Independents A Shield 1,358 23.4N/A
Labour P Hughes 952 16.4N/A
Labour E Turner 862 14.8N/A
Conservative John Aken 443 7.6N/A
Liberal Democrat D Haney 259 4.5N/A
Stanley
PartyCandidateVotes%±
Labour C Vasey 1,017 27.3N/A
Labour C Marshall 891 23.9N/A
Derwentside Independents J Pye 824 22.1N/A
Derwentside Independents D Walton 625 16.8N/A
Liberal Democrat N Jukes 196 5.3N/A
Conservative P Clemo 169 4.5N/A
Tanfield
PartyCandidateVotes%±
Derwentside Independents J Hunter 1,086 24.9N/A
Labour J Wilson 950 21.9N/A
Labour E Hunter 912 20.9N/A
Derwentside Independents T Pattinson 866 19.9N/A
Liberal Democrat D Bowerbank 318 7.3N/A
Conservative M Nicholson 214 4.9N/A

Durham (22 seats)

Belmont
PartyCandidateVotes%±
Liberal Democrat K Holroyd 1,393 32.0N/A
Liberal Democrat E S Mavin 1,255 28.8N/A
Labour T Johnston 475 10.9N/A
Independent A Walker 451 10.4N/A
Labour D M Hall 396 9.1N/A
Conservative T McCall 203 4.7N/A
Conservative J Wakefield 180 4.1N/A
Brandon
PartyCandidateVotes%±
Labour P Taylor 1,257 28.5N/A
Labour R Rodgers 1,168 26.5N/A
Liberal Democrat M J A Smith 797 18.1N/A
Liberal Democrat C Clark 594 13.5N/A
Conservative H Hudson-Evans 217 4.9N/A
BNP H Clarke 203 4.6N/A
BNP S L Ross 178 4.0N/A
Coxhoe
PartyCandidateVotes%±
Labour D Morgan 1,020 28.3N/A
Labour M L Plews 953 26.4N/A
Independent D Smith 744 20.6N/A
Liberal Democrat S E Millerchip 360 9.9N/A
Conservative C S Holt 266 7.4N/A
Liberal Democrat C Wigham 261 7.2N/A
Deerness Valley
PartyCandidateVotes%±
Liberal Democrat J Wilkinson 1,266 22.3N/A
Labour J K Chaplow 1,254 22.1N/A
Labour D Bell 1,210 21.3N/A
Liberal Democrat P Guy 1,189 20.9N/A
Conservative K J M Currie 310 5.5N/A
BNP K Morton 244 4.3N/A
BNP P J Gray 196 3.5N/A
Durham South
PartyCandidateVotes%±
Labour Mac Williams 963 23.6N/A
Labour Jan Blakey 867 21.2N/A
Liberal Democrat Robert Wynn 536 13.1N/A
Liberal Democrat Adam Walker 507 12.4N/A
Conservative Patrick Hague 316 7.7N/A
Conservative Rhys Burriss 311 7.6N/A
Independent Maggie Robinson 267 6.5N/A
Independent Martin Ridley 177 4.3N/A
BNP Katherine Lloyd 142 3.5N/A
Elvet
PartyCandidateVotes%±
Liberal Democrat David Freeman 873 22.5N/A
Liberal Democrat David Stoker 684 17.6N/A
Independent Anji Rae 590 15.2N/A
Labour Jonathan Priestman Lovell 484 12.5N/A
Conservative Tim Hughes 433 11.2N/A
Conservative Chris Arthur 424 10.9N/A
Labour Katharine Ford 388 10.0N/A
Framwellgate Moor
PartyCandidateVotes%±
Liberal Democrat Mark Wilkes 1,433 20.8N/A
Liberal Democrat Rev Crooks 1,400 20.3N/A
Labour George Burlinson 1,267 18.4N/A
Labour Marion Wilson 1,062 15.4N/A
Independent Terry Moderate 626 9.1N/A
Conservative Michael Bates 329 4.8N/A
BNP Ralph Musgrave 285 4.1N/A
Independent Simon Carey 257 3.7N/A
Conservative Pat Wynne 244 3.5N/A
Gilesgate
PartyCandidateVotes%±
Liberal Democrat D J Southwell 1,324 25.9N/A
Liberal Democrat L Thomson 1,248 24.4N/A
Labour P Conway 1,022 19.9N/A
Labour P J Mitchell 978 19.1N/A
Conservative H W Cartwright 181 3.5N/A
Conservative E Hastie 163 3.2N/A
Durham Taxpayers Alliance R West 111 2.2N/A
BNP K Lloyd 90 1.8N/A
Neville's Cross
PartyCandidateVotes%±
Liberal Democrat N Martin 1,514 29.9N/A
Liberal Democrat G Holland 1,364 26.9N/A
Conservative M Smith 411 8.1N/A
Labour N C Heaton 381 7.5N/A
Independent S J Ashfield 379 7.5N/A
Labour J G A Roberts 376 7.4N/A
Conservative C Smith 361 7.1N/A
Independent C M J Allen 281 5.5N/A
Newton Hall
PartyCandidateVotes%±
Liberal Democrat A J Hopgood 1,419 28.1N/A
Liberal Democrat M Simmons 1,376 27.2N/A
Independent P Wolstenholme 676 13.4N/A
Labour S Emmas-Williams 515 10.2N/A
Labour H S Ferreira 409 8.1N/A
Conservative H D Osborn 354 7.0N/A
Conservative P Kirk 303 5.9N/A
Sherburn
PartyCandidateVotes%±
Liberal Democrat Carol Woods 1,398 24.6N/A
Liberal Democrat Maureen Wood 1,308 23.0N/A
Labour Raymond Pye 1,165 20.5N/A
Labour Lesley Ann Broughton 1,106 19.5N/A
Conservative Nick Hallett 253 4.5N/A
Green Jo Smith 228 4.0N/A
Conservative Michael Fishwick 226 3.9N/A

Easington (24 seats)

Blackhalls
PartyCandidateVotes%±
Labour A Cox 1,294 35.1N/A
Labour R Crute 1,251 33.9N/A
Liberal Democrat R Gibbon 599 16.3N/A
Liberal Democrat C Hindson 538 14.6N/A
Dawdon
PartyCandidateVotes%±
Independent B Arthur 962 33.9N/A
Labour C Walker 763 26.9N/A
Labour E W Mason 717 25.3N/A
Liberal Democrat T Baxter 223 7.9N/A
Liberal Democrat A Crooks 167 5.9N/A
Deneside
PartyCandidateVotes%±
Labour A Nugent 924 32.0N/A
Labour E Bell 897 31.1N/A
Liberal Democrat C M Harrison 403 13.9N/A
Liberal Democrat N Shaw 350 12.1N/A
Independent S P Colborn 313 10.8N/A
Easington
PartyCandidateVotes%±
Labour D J Boyes 1,108 33.6N/A
Labour R Burnip 1,035 31.4N/A
Liberal Democrat B Graham 621 18.8N/A
Liberal Democrat J G T Lightley 533 16.2N/A
Horden
PartyCandidateVotes%±
Labour P Stradling 1,442 42.3N/A
Labour D Maddison 1,271 37.3N/A
Liberal Democrat P Hudson 364 10.7N/A
Conservative M Riley 335 9.8N/A
Murton
PartyCandidateVotes%±
Labour A Napier 1,401 38.9N/A
Labour A Naylor 1,285 35.8N/A
Liberal Democrat J K Hudson 474 13.2N/A
Liberal Democrat M Nolan 433 12.1N/A
Peterlee East
PartyCandidateVotes%±
Labour A Laing 672 23.6N/A
Labour G Tennant 670 23.6N/A
Independent B Quinn 653 22.9N/A
Independent S Huntington 605 21.3N/A
Liberal Democrat M E Wells 242 8.5N/A
Peterlee West
PartyCandidateVotes%±
Liberal Democrat B A Sloan 857 28.2N/A
Liberal Democrat R Liddle 833 27.4N/A
Labour G Pinkney 685 22.5N/A
Labour D J Taylor-Gooby 664 21.8N/A
Seaham
PartyCandidateVotes%±
Labour D Myers 1,072 27.2N/A
Labour G Bleasdale 1,035 26.3N/A
Conservative D Dixon 949 24.1N/A
Conservative M Reid 878 22.3N/A
Shotton
PartyCandidateVotes%±
Labour R J Todd 1,226 32.4N/A
Labour E Huntington 1,169 30.9N/A
Independent E W Hall 734 19.4N/A
Liberal Democrat S Walton 388 10.3N/A
Liberal Democrat C Saville 263 6.9N/A
Thornley
PartyCandidateVotes%±
Labour M Nicholls 1,230 37.7N/A
Independent B Wilson 940 28.8N/A
Labour T Unsworth 776 23.8N/A
Liberal Democrat M Norman 320 9.8N/A
Wingate
PartyCandidateVotes%±
Independent J Maslin 1,349 31.9N/A
Labour L O'Donnell 1,075 25.4N/A
Labour K McGonnell 1,055 24.9N/A
Liberal Democrat B Solaimon 750 17.7N/A

Sedgefield (22 seats)

Aycliffe East
PartyCandidateVotes%±
Labour S Iveson 756 20.8N/A
Labour J Moran 708 19.5N/A
Independent B Blenkinsopp 594 16.3N/A
Independent B Haigh 309 8.5N/A
BNP H J Hilton 294 8.1N/A
Independent K Stubbs 232 6.4N/A
Liberal Democrat P J Thomas 218 5.9N/A
BNP J Palliser 190 5.2N/A
Independent A D Warburton 180 4.9N/A
Liberal Democrat D W Jago 154 4.2N/A
Aycliffe North
PartyCandidateVotes%±
Independent P S Gittins 616 16.9N/A
Labour J Gray 565 15.6N/A
Labour K Henderson 504 13.9N/A
Conservative R Bagshaw 353 9.7N/A
Independent T Hogan 300 8.3N/A
Liberal Democrat A Bergg 295 8.1N/A
D Sutton-Lloyd 277 7.6N/A
A J Carter 218 6.0N/A
Liberal Democrat C Foote-Wood 189 5.2N/A
Independent S Haigh 161 4.4N/A
Independent L Cuthbertson 149 4.1N/A
Aycliffe West
PartyCandidateVotes%±
Independent E M Paylor 678 20.0N/A
Labour M Dixon 665 19.6N/A
Labour V Crosby 651 19.2N/A
Independent H J Hutchinson 628 18.5N/A
Liberal Democrat M T Anderson 412 12.2N/A
Liberal Democrat J E Mawson 356 10.5N/A
Chilton
PartyCandidateVotes%±
Labour C Potts 1,541 29.3N/A
Labour B Avery 1,508 28.7N/A
BNP A Whelpdale 853 16.2N/A
BNP C Whelpdale 839 15.9N/A
Conservative M Waller 517 9.8N/A
Ferryhill
PartyCandidateVotes%±
Independent D Farry 1,174 22.6N/A
Labour C Magee 994 19.2N/A
Labour P Crathorne 898 17.3N/A
Independent K Storey 887 17.1N/A
Liberal Democrat P Mountford 634 12.2N/A
BNP A S Fowler 352 6.8N/A
BNP R Gray 245 4.7N/A
Sedgefield
PartyCandidateVotes%±
Conservative D Brown 1,101 27.0N/A
Labour J Robinson 977 23.9N/A
Independent T D Brimm 650 15.9N/A
Labour F M Brown 604 14.8N/A
Independent G Willis 523 12.8N/A
BNP M S Colledge 118 2.9N/A
BNP J Collinson 104 2.6N/A
Shildon East
PartyCandidateVotes%±
Labour B Stephens 872 21.4N/A
Labour D Bowman 827 20.3N/A
Independent I Hewitson 528 12.9N/A
Liberal Democrat L Cockfield 403 9.9N/A
Independent C Pollard 349 8.6N/A
Conservative N Crass 309 7.6N/A
Conservative M Miller 269 6.6N/A
BNP P Clarke 257 6.3N/A
BNP S J Brown 254 6.2N/A
Shildon West
PartyCandidateVotes%±
Liberal Democrat J G Huntington 917 21.4N/A
Independent D M Hancock 685 15.9N/A
Labour V Chapman 636 14.8N/A
Labour A Walker 537 12.5N/A
Independent I Jackson 479 11.2N/A
Liberal Democrat G M R Howe 473 11.0N/A
BNP P J Ross 292 6.8N/A
BNP L Scott 264 6.2N/A
Spennymoor and Middlestone
PartyCandidateVotes%±
Liberal Democrat B Ord 1,123 18.4N/A
Liberal Democrat K Thompson 1,059 17.3N/A
Labour A M Armstrong 941 15.4N/A
Labour W Waters 927 15.2N/A
BNP J Walker 890 14.6N/A
BNP J S Macpherson 720 11.8N/A
Conservative P A Carmedy 256 4.2N/A
Conservative C Platts 192 7.6N/A
Trimdon
PartyCandidateVotes%±
Labour L Hovvells 1,138 31.6N/A
Labour P Brookes 968 26.9N/A
Independent A Bell 659 18.3N/A
Conservative C Moyle 388 10.8N/A
BNP P Sewell 223 6.2N/A
BNP M Claughan 222 6.2N/A
Tudhoe
PartyCandidateVotes%±
Labour B Graham 1,105 17.9N/A
Labour N C Foster 1,062 17.3N/A
BNP A Walker 933 15.2N/A
BNP A Foster 842 13.7N/A
Liberal Democrat C Maddison 771 12.5N/A
Liberal Democrat L Maddison 752 12.2N/A
Conservative A T Cross 425 6.9N/A
Conservative P Gilbertson 255 4.1N/A

Teesdale (6 seats)

Barnard Castle East
PartyCandidateVotes%±
Conservative Jo Fergus 1,137 34.0N/A
Conservative George Richardson 786 16.6N/A
Independent James Rowlandson 761 16.1N/A
Independent Tony Cooke 563 11.9N/A
Teesdale Independent Association Ken Hodgson 397 8.4N/A
Teesdale Independent Association William Salvin 379 8.0N/A
Labour Sylvia Bailes 367 7.8N/A
Labour Patrick Heaney 342 7.2N/A
Barnard Castle West
PartyCandidateVotes%±
Conservative R A Bell 1,542 28.8N/A
Conservative B Harrison 972 18.2N/A
Teesdale Independent Association R Betton 964 18.0N/A
Teesdale Independent Association P Hughes 522 9.8N/A
Labour D W Armstrong 402 7.5N/A
J R Usher 386 7.2N/A
Labour P J Hunt 322 6.0N/A
Independent D A Wearmouth 237 4.4N/A
Evenwood
PartyCandidateVotes%±
Conservative S Hugill 811 18.8N/A
Labour P M Charlton 784 18.2N/A
Labour J Priestley 769 17.9N/A
Conservative L Milner 708 16.5N/A
Teesdale Independent Association M J Clark 648 15.1N/A
Teesdale Independent Association P Ryman 583 13.5N/A

Wear Valley (16 seats)

Bishop Auckland Town
PartyCandidateVotes%±
Liberal Democrat S Zair 984 22.2N/A
Liberal Democrat N A Harrison 840 18.9N/A
Labour B A Laurie 677 45.3N/A
Conservative C Raine 625 14.1N/A
Conservative J H Gasston 565 12.8N/A
Labour K Manton 491 11.1N/A
BNP C D Cooper 127 2.9N/A
BNP S R Cooper 117 2.6N/A
Coundon
PartyCandidateVotes%±
Liberal Democrat T Taylor 669 23.7N/A
Liberal Democrat D Burn 634 22.5N/A
Labour P Graham 548 19.4N/A
Labour N Stonehouse 538 19.1N/A
Conservative J Firby 230 8.2N/A
Conservative J Milner 200 7.1N/A
Crook North and Tow Law
PartyCandidateVotes%±
Liberal Democrat J Bailey 735 24.3N/A
Liberal Democrat P A Jopling 698 23.0N/A
Labour J Gale 563 18.6N/A
Independent R Grogan 558 18.4N/A
Labour L Brown 476 15.7N/A
Crook South
PartyCandidateVotes%±
Independent E Murphy 749 22.0N/A
Labour E Tomlinson 729 21.5N/A
Liberal Democrat J Gooch 685 20.2N/A
Liberal Democrat G K Jopling 603 17.7N/A
Labour R Seabury 372 10.9N/A
BNP K Wilson 260 7.7N/A
Weardale
PartyCandidateVotes%±
Independent J Shuttleworth 2,035 35.9N/A
Independent A Savory 1,029 18.2N/A
Independent T R Mews 564 9.9N/A
Independent L Shuttleworth 558 9.9N/A
Independent A A K Bolam 533 9.4N/A
Conservative C M Houghton 339 5.9N/A
Labour O E Gunn 195 3.4N/A
Liberal Democrat A C Simpson 159 2.8N/A
Labour A M Hiles 122 2.2N/A
Liberal Democrat R L Groves 119 2.1N/A
West Auckland
PartyCandidateVotes%±
Labour R J Yorke 753 20.9N/A
Labour A H Turner 655 18.2N/A
Conservative J Tague 598 16.6N/A
Conservative P Laws 575 15.9N/A
Liberal Democrat J Ferguson 551 15.3N/A
Liberal Democrat V Perkins 462 12.9N/A
Willington
PartyCandidateVotes%±
Conservative B Brunskill 1,210 24.7N/A
Labour B L Myers 927 18.9N/A
Labour M Pinkney 887 18.1N/A
Conservative L Dixon 712 14.5N/A
Liberal Democrat K A Bowser 368 7.5N/A
Independent J Cunningham 301 6.1N/A
Liberal Democrat D English 218 4.4N/A
BNP A Hodgson 151 3.1N/A
BNP J Snaith 129 2.6N/A
Woodhouse Close
PartyCandidateVotes%±
Labour J Lethbridge 665 23.6N/A
Labour J E Lee 643 22.8N/A
Liberal Democrat A Anderson 585 20.7N/A
Liberal Democrat R Huntington 518 18.4N/A
Conservative C Firby 222 7.9N/A
Conservative A Welford 188 6.7N/A

Related Research Articles

Derwentside

Derwentside was, from 1974 to 2009, a local government district in County Durham, England.

Chester-le-Street was a non-metropolitan district in County Durham, England. It was abolished on 1 April 2009 and replaced by Durham County Council.

Stockton-on-Tees is a unitary authority in County Durham and North Yorkshire, England. Until 1 April 1996 it was a non-metropolitan district in Cleveland.

Darlington is a unitary authority in County Durham, England. Until 1 April 1997 it was a non-metropolitan district.

Elections to Durham County Council are held every four years. The council was created as part of the 1972 local government reforms. The first elections to the new authority were held in 1973 in advance of the council taking office in 1974. As part of changes to local government in 2009, the council became a unitary authority with the first elections to the new council taking place in 2008. Since becoming a unitary authority, 126 councillors have been elected from 63 wards.

Derwentside was a non-metropolitan district in County Durham, England. It was abolished on 1 April 2009 and replaced by Durham County Council.

Wear Valley was a non-metropolitan district in County Durham, England. It was abolished on 1 April 2009 and replaced by Durham County Council.

Durham was a non-metropolitan district in County Durham, England. It was abolished on 1 April 2009 and replaced by Durham County Council.

Easington was a non-metropolitan district in County Durham, England. It was abolished on 1 April 2009 and replaced by Durham County Council.

2008 United Kingdom local elections

The 2008 United Kingdom local elections were held on 1 May 2008. These elections took place in 137 English Local Authorities and all Welsh Councils.

Sedgefield was a non-metropolitan district in County Durham, England. It was abolished on 1 April 2009 and replaced by Durham County Council.

2011 United Kingdom local elections

The 2011 United Kingdom local elections were held on Thursday 5 May 2011. In England, direct elections were held in all 36 Metropolitan boroughs, 194 Second-tier district authorities, 49 unitary authorities and various mayoral posts, meaning local elections took place in all parts of England with the exception of seven unitary authorities, and seven districts and boroughs. For the majority of English districts and the 25 unitary authorities that are elected "all out" these were the first elections since 2007. In Northern Ireland, there were elections to all 26 local councils. Elections also took place to most English parish councils.

Milton Keynes is a unitary authority in Buckinghamshire, England. Until 1 April 1997 it was a non-metropolitan district.

2013 United Kingdom local elections

The 2013 United Kingdom local elections took place on Thursday 2 May 2013. Elections were held in 35 English councils: all 27 non-metropolitan county councils and eight unitary authorities, and in one Welsh unitary authority. Direct mayoral elections took place in Doncaster and North Tyneside. These elections last took place on the 4 June 2009 at the same time as the 2009 European Parliament Elections, except for County Durham, Northumberland and the Anglesey where elections last took place in 2008.

2013 Durham County Council election

An election to Durham County Council took place on 2 May 2013 as part of the United Kingdom local elections, 2013. Following a boundary review, 126 councillors were elected from 63 electoral divisions which returned either one, two or three councillors each by first-past-the-post voting for a four-year term of office. The previous election took place in 2008 in advance of the council becoming a unitary authority after the 2009 changes to local government. The election saw the Labour Party increase their majority on the council.

2005 Durham County Council election

Elections to Durham County Council took place on 5 May 2005 as part of the 2005 local elections in the United Kingdom. The election also took place on the same day as the 2005 general election. This was the council's final election before it became a unitary authority as part of changes to local government in 2009, with the first elections to the new unitary council taking place in 2008. New electoral division boundaries were introduced for this election, with 63 divisions returning one councillor each using the first past the post voting system.

Teesdale was a non-metropolitan district in County Durham, England. It was abolished on 1 April 2009 and replaced by Durham County Council.

2015 United Kingdom local elections

The 2015 United Kingdom local elections were held on Thursday 7 May 2015, the same day as the general election for the House of Commons of the United Kingdom.

2017 United Kingdom local elections

The 2017 United Kingdom local elections were held on Thursday 4 May 2017. Local elections were held across Great Britain, with elections to 35 English local authorities and all councils in Scotland and Wales.

2019 United Kingdom local elections

Local elections in the United Kingdom are scheduled to be held on Thursday 2 May 2019, contesting about 270 English local councils, six directly elected mayors in England, and all 11 local councils in Northern Ireland. Additionally, there will be by-elections for a number of local authority seats.

References

  1. UK Parliament. The County Durham (Structural Change) Order 2008 as made, from legislation.gov.uk .
  2. "Durham County Council - Election Results - 1 May 2008" (PDF). Durham County Council. Retrieved 2 April 2013.