Durham County Council election, 2017

Last updated
Durham County Council election, 2017
Flag of England.svg
  2013 4 May 20172021 

All 126 council division seats
64 seats needed for a majority

 First partySecond partyThird party
  No image wide.svg No image wide.svg No image wide.svg
Party Labour Liberal Democrat Independent
Last election94 seats, 52%9 seats, 10%9 seats, 12%
Seats won741413
Seat changeDecrease2.svg20Increase2.svg5Increase2.svg4
Popular vote96,03730,14037,136
Percentage42.4%13.3%16.4%
SwingDecrease2.svg9.8%Increase2.svg3.2%Increase2.svg4.6%

 Fourth partyFifth partySixth party
  No image wide.svg No image wide.svg
Party Conservative Derwentside Independents Spennymoor Independents
Last election4 seats, 8%8 seats, 6%1 seat, 1%
Seats won1075
Seat changeIncrease2.svg6Decrease2.svg1Increase2.svg4
Popular vote34,07213,0253,523
Percentage15.0%5.8%1.6%
SwingIncrease2.svg7.3%Decrease2.svg0.4%Increase2.svg0.4%

 Seventh party
 
Party North East Party
Last electionNew party
Seats won3
Seat changeIncrease2.svg3
Popular vote4,879
Percentage2.2%
SwingNew party

Durham UK local election 2017 map.svg
Map showing the results of the 2017 Durham County Council election. Results by electoral division. Key:
  Conservative
  Labour
  Liberal Democrat
  Independent
  North East Party
  Derwentside Independents
  Spennymoor Independents
Striped divisions have mixed representation.

Council control before election

Labour

Council control after election

Labour

The 2017 Durham County Council election was held on 4 May 2017 as part of the 2017 local elections in the United Kingdom. [1] All 126 councillors were elected from 63 electoral divisions which returned either one, two or three county councillors each by first-past-the-post voting for a four-year term of office.

Durham County Council British administrative body

Durham County Council is the local authority of the non-metropolitan County Durham in North East England. Since 2009 it has been a unitary authority, having the powers of a non-metropolitan county and district council combined. From 1889 to 2009 it was a county council in a two-tier arrangement.

The wards and electoral divisions in the United Kingdom are electoral districts at sub-national level represented by one or more councillors. The ward is the primary unit of English electoral geography for civil parishes and borough and district councils, electoral ward is the unit used by Welsh principal councils, while the electoral division is the unit used by English county councils and some unitary authorities. Each ward/division has an average electorate of about 5,500 people, but ward-population counts can vary substantially. As at the end of 2014 there were 9,456 electoral wards/divisions in the UK.

Contents

The Statement of Persons Nominated was published on 5 April 2017. [2]

Results summary

Durham County Council election, 2017
PartySeatsGainsLossesNet gain/lossSeats %Votes %Votes+/−
  Labour 74-2042.496,037-9.8
  Liberal Democrat 14+513.330,140+3.2
  Independent 13+416.437,136+4.6
  Conservative 10+615.034,072+7.3
  Derwentside Independents 7-15.813,025-0.4
Spennymoor Independents5+41.63,523+0.4
  North East Party 3+32.24,879+2.2
  Green 0-2.35,141+0.6
  UKIP 0-2.04,589-3.3
Seaham Community Party0-1.33,033+1.3

Results by electoral division

A − B

Annfield Plain (2 seats)
PartyCandidateVotes%±
Derwentside Independents Joan Nicholson87125.8+3.2
Labour Jeanette Stephenson81224.1N/A
Labour Doug Carmichael79523.6N/A
Derwentside Independents Christine Bell66619.8N/A
Conservative Nicky Fernandez2276.7N/A
Turnout 1,83331.4+1.6
Derwentside Independents gain from Labour Swing N/A
Labour hold Swing N/A
Aycliffe East (2 seats)
PartyCandidateVotes%±
Labour Jim Atkinson70725.8N/A
Labour Sarah Iveson67024.4-4.9
Independent Bill Blenkinsopp49818.2-1.6
Conservative Christine Duffy34712.7N/A
UKIP John Grant2549.3N/A
Independent Brian Haigh1796.5N/A
Green Helen Hanks843.1N/A
Turnout 1,63626.0+0.2
Labour hold Swing N/A
Aycliffe North and Middridge (3 seats)
PartyCandidateVotes%±
Conservative Scott Durham86816.0N/A
Labour John Clare86316.0-8.8
Conservative Paul Howell84615.6N/A
Labour Joan Gray75413.9-10.9
Labour Mike Dixon67512.5-9.7
Independent Dorothy Bowman57310.6N/A
Independent Irene Hewitson2795.2N/A
Independent Paul Symons2133.9N/A
Independent Sandra Haigh1873.5-13.1
Independent Sally Symons1512.8N/A
Turnout 2,19427.5+6.2
Conservative gain from Labour Swing N/A
Labour hold Swing N/A
Conservative gain from Labour Swing N/A
Aycliffe West (2 seats)
PartyCandidateVotes%±
Labour Edward Adam57023.3-2.9
Labour Kate Hopper51721.1-7.5
Independent Ken Robson43717.9N/A
Independent George Gray41617.0+0.3
Independent Arun Chandran27611.3N/A
Conservative Marney Swan2299.4N/A
Turnout 1,40625.6+3.5
Labour hold Swing N/A
Barnard Castle East (2 seats)
PartyCandidateVotes%±
Conservative James Rowlandson1,38930.5+1.1
Conservative George Richardson1,29228.4+5.5
Labour Emma Rowell75216.5N/A
Labour Christopher Kelsey64414.1N/A
Independent Thom Robinson47810.5N/A
Turnout 2,47037.3+9.7
Conservative hold Swing N/A
Barnard Castle West (2 seats)
PartyCandidateVotes%±
Conservative Richard Bell1,83740.7+4.6
Conservative Ted Henderson1,57634.9N/A
Labour Francis Roche61613.7N/A
Labour George Smith48310.7N/A
Turnout 2,42337.8+6.4
Conservative hold Swing N/A
Belmont (3 seats)
PartyCandidateVotes%±
Liberal Democrat Eric Mavin1,60415.4+3.6
Labour Co-op Katie Corrigan1,49714.4-0.9
Liberal Democrat Lesley Mavin1,47214.1N/A
Labour Co-op Paul Finley1,29212.4N/A
Liberal Democrat Stephen White1,14911.0N/A
Labour Co-op Chris Turner1,11110.7N/A
Conservative Liam Bewick8418.1N/A
Independent Arthur Walker7206.9-0.4
Independent Ian Kelsey3853.7N/A
Green Roger McAdam3423.3N/A
Turnout 3,85937.6+3.3
Liberal Democrat gain from Labour Co-op Swing N/A
Labour Co-op hold Swing N/A
Liberal Democrat gain from Labour Co-op Swing N/A
Benfieldside (2 seats)
PartyCandidateVotes%±
Derwentside Independents Stephen Robinson1,16127.9-0.5
Derwentside Independents Peter Oliver1,02324.6+0.7
Labour Steven Wood63215.2N/A
Labour Sylvia Peak56713.6N/A
Conservative David Kinch3418.2N/A
Liberal Democrat Claire English2455.9N/A
Liberal Democrat Natalie English1914.6N/A
Turnout 2,26335.3+3.3
Derwentside Independents hold Swing N/A
Bishop Auckland Town (2 seats)
PartyCandidateVotes%±
Independent Sam Zair69219.4-10.5
Labour Joy Allen64017.9-3.5
Conservative Aaron Bainbridge49814.0N/A
Labour Nigel Bryson48313.5N/A
Independent Lesley Zair41911.8N/A
Conservative Patricia Child38710.9N/A
Independent Billy Neilson2837.9N/A
Green Daniel Davison1644.6N/A
Turnout 1,90031.9+5.4
Independent hold Swing N/A
Labour hold Swing N/A
Bishop Middleham and Cornforth (1 seat)
PartyCandidateVotes%±
Labour Pauline Crathorne35145.5N/A
Conservative David Evans21227.4N/A
Independent Deane Brett20927.1N/A
Turnout 77227.1+3.7
Labour hold Swing N/A
Blackhalls (2 seats)
PartyCandidateVotes%±
Labour Rob Crute1,11536.4-1.1
Labour Lynn Pounder1,04133.9-0.2
Conservative Tom Eaton41213.4N/A
North East Party Steve Franklin2598.5N/A
North East Party Jamie Robinson2407.8N/A
Turnout 1,73628.2-0.1
Labour hold Swing N/A
Brandon (2 seats)
PartyCandidateVotes%±
Labour Paul Taylor1,33934.2-6.4
Labour John Turnbull1,33134.0-6.9
Conservative Valerie Booth46411.8N/A
Liberal Democrat Laura Wilson41710.6N/A
Liberal Democrat Denis Jackson3689.4N/A
Turnout 2,17129.3+4.1
Labour hold Swing N/A
Burnopfield and Dipton (2 seats)
PartyCandidateVotes%±
Labour Ivan Jewell84423.9+4.6
Labour Joanne Carr69819.8+0.9
Independent Roland Hemsley50814.4+5.4
Derwentside Independents David Marrs47813.5-0.6
Derwentside Independents Betty Minto41611.8N/A
Conservative Ivy Wilson35910.2N/A
Green Melody Sandells2256.4N/A
Turnout 2,02132.6+2.2
Labour gain from Derwentside Independents Swing N/A
Labour hold Swing N/A

C − D

Chester-le-Street East (1 seat)
PartyCandidateVotes%±
Conservative Beatrice Bainbridge39432.5+2.9
Labour Simon Mulligan28923.8N/A
Green Derek Morse18114.9N/A
Independent Paul Evans17514.4N/A
Independent Maureen May715.9-8.6
UKIP Stephen Rendle594.9N/A
Liberal Democrat Russell Haswell433.6N/A
Turnout 1,21240.3+9.5
Conservative gain from Labour Swing N/A
Chester-le-Street North (1 seat)
PartyCandidateVotes%±
Labour Tracie Smith67854.1-21.8
Independent Clare Todd27021.5N/A
Conservative William Middlemass22217.7N/A
Liberal Democrat Philip Nathan846.7N/A
Turnout 1,25441.2+5.8
Labour hold Swing N/A
Chester-le-Street South (2 seats)
PartyCandidateVotes%±
Independent Paul Sexton78916.3N/A
Conservative Allan Bainbridge76615.8+2.6
Labour George Davidson76215.8-10.6
Independent Bill Moist75115.5N/A
Labour Katherine Henig71814.8-8.6
Conservative Daniel Mayne63713.2+3.9
Liberal Democrat Liam Scanlon-Brown HVPYL2334.8N/A
Liberal Democrat Michael Peacock1853.8+0.9
Turnout 2,54942.8+9.7
Independent gain from Labour Co-op Swing N/A
Conservative gain from Labour Co-op Swing N/A
Chester-le-Street West Central (2 seats)
PartyCandidateVotes%±
Labour Simon Henig 85425.7-11.5
Labour Linda Marshall74922.5-13.2
Independent Mark Atkinson61118.4N/A
Independent Ewan Marshall45413.6N/A
North East Party Graham Thorp36911.1N/A
Conservative Michael Gossage2898.7N/A
Turnout 187031.7+4.5
Labour hold Swing N/A
Chilton (1 seat)
PartyCandidateVotes%±
Labour Christine Potts62268.1+2.6
Conservative John Sandles29131.9N/A
Turnout 91329.1-2.6
Labour hold Swing N/A
Consett North (2 seats)
PartyCandidateVotes%±
Liberal Democrat Owen Temple1,08928.1+4.5
Independent Alexander Watson91323.6+4.1
Liberal Democrat Margaret Nealis57014.7+2.2
Labour Kevin Earley55714.4N/A
Labour Benjamin Eckford3458.9N/A
Derwentside Independents Wendy Brown2265.8N/A
Conservative Alan Beaty1754.5N/A
Turnout 2,16136.6+2.9
Liberal Democrat hold Swing N/A
Independent hold Swing N/A
Consett South (1 seat)
PartyCandidateVotes%±
Derwentside Independents Derek Hicks39550.8-2.8
Labour Jack Simons26734.4N/A
Conservative Raymond Goodson11514.8N/A
Turnout 77724.6+4.8
Derwentside Independents hold Swing N/A
Coundon (1 seat)
PartyCandidateVotes%±
Labour Charlie Kay48960.4-0.2
Independent Adam Zair17521.6N/A
Conservative Mark Watson14618.0N/A
Turnout 81025.8+5.6
Labour hold Swing N/A
Coxhoe (3 seats)
PartyCandidateVotes%±
Independent Jan Blakey1,32520.5-3.2
Labour John Dunn1,22018.9N/A
Labour Maura McKeon1,16018.0N/A
Labour Maria Plews1,12217.4-9.4
Conservative Anne Murphy75711.7N/A
Liberal Democrat Andrew Shuttleworth5458.5N/A
Liberal Democrat Adam Walker3225.0+2.4
Turnout 2,85229.9+3.3
Independent gain from Labour Swing N/A
Labour hold Swing N/A
Craghead and South Moor (2 seats)
PartyCandidateVotes%±
Labour Mark Davinson87431.1-5.2
Labour Carole Hampson83129.5-4.8
Derwentside Independents Katy Smith37413.3N/A
UKIP Kenneth Rollings2217.8N/A
Derwentside Independents Graeme Whitworth2057.3N/A
Conservative Patrick Seargeant1906.8N/A
Liberal Democrat Gregory Coltman602.1N/A
Liberal Democrat Martin Williams602.1N/A
Turnout 1,55528.8+2.2
Labour hold Swing N/A
Crook (3 seats)
PartyCandidateVotes%±
Independent Anne Reed1,23920.5N/A
Independent Patricia Jopling1,02217.0+9.4
Labour Andrea Patterson91315.2N/A
Labour Eddie Tomlinson89314.8+3.3
Conservative Daniel Cohen77612.9N/A
Labour Maureen Stanton66711.1N/A
Liberal Democrat David English5128.5+5.9
Turnout 2,55328.0+4.2
Independent hold Swing N/A
Independent gain from Labour Swing N/A
Labour hold Swing N/A
Dawdon (2 seats)
PartyCandidateVotes%±
Labour Kevin Shaw88627.2-10.7
Labour Leanne Kennedy81225.0N/A
Seaham Community PartyRobert Arthur71021.8-6.4
Seaham Community PartyKathryn Brace52016.0N/A
Conservative Ben Cooper2096.4N/A
Green Robert Reay1173.6N/A
Turnout 1,74828.7+2.1
Labour hold Swing N/A
Deerness (3 seats)
PartyCandidateVotes%±
Labour Jean Chaplow1,53321.4-0.5
Labour David Bell1,50221.0-0.8
Labour Marion Wilson1,34018.7N/A
Conservative Jack Gilmore6449.0N/A
Liberal Democrat John Kelley5297.4+2.9
Green Janice Wilson4616.4N/A
Liberal Democrat Florence Simpson4296.0N/A
Liberal Democrat Edwin Simpson4266.0N/A
Green Nicholas Kasch2954.1N/A
Turnout 2,86031.3+0.5
Labour hold Swing N/A
Delves Lane (2 seats)
PartyCandidateVotes%±
Labour Malcolm Clarke79829.5N/A
Labour Jane Brown77628.6-15.3
Derwentside Independents George McKay67224.8N/A
Conservative Wendy Smith46417.1N/A
Turnout 1,16126.3+2.4
Labour hold Swing N/A
Deneside (2 seats)
PartyCandidateVotes%±
Labour Edward Bell77728.3-16.8
Labour Jennifer Bell71626.0-16.7
Seaham Community PartyBarry Taylor46216.8N/A
Seaham Community PartyKatie Murden43215.7N/A
Conservative George Jackson1726.3N/A
North East Party Arron Gilbraith1284.7N/A
North East Party Terry Duffy622.2N/A
Turnout 1,45626.7+6.1
Labour hold Swing N/A
Durham South (1 seat)
PartyCandidateVotes%±
Liberal Democrat David Stoker35146.6+3.3
Labour Andrzej Olechnowicz22529.8-1.2
Conservative Richard Lawrie17823.6N/A
Turnout 75443.3+15.4
Liberal Democrat hold Swing N/A

E − N

Easington (2 seats)
PartyCandidateVotes%±
Labour Angela Surtees88533.4+4.2
Labour David Boyes83531.6-2.7
Independent Terry Murray39214.8-4.2
Conservative Christine Holt30311.5N/A
North East Party Andrew Watson2318.7N/A
Turnout 1,47026.5+1.1
Labour hold Swing N/A
Elvet and Gilesgate (2 seats)
PartyCandidateVotes%±
Liberal Democrat Richard Ormerod92332.2+13.4
Liberal Democrat David Freeman90531.5+11.3
Labour Maureen Boettcher33511.7N/A
Labour Frank Salisbury2849.9N/A
Green Jamie Penston Raja1495.2N/A
Conservative Ben Glaister1414.9N/A
Conservative Pat Wynne1334.6-1.0
Turnout 1,46430.4+9.1
Liberal Democrat hold Swing N/A
Esh and Witton Gilbert (2 seats)
PartyCandidateVotes%±
Liberal Democrat Arnold Simpson1,32031.0+14.1
Liberal Democrat Michael McGaun1,23128.9N/A
Labour Barbara Armstrong65915.5-5.7
Labour Joseph Armstrong64415.1-6.8
Conservative Kathryn Whittaker4029.5N/A
Turnout 2,31236.9+4.8
Liberal Democrat gain from Labour Swing N/A
Evenwood (2 seats)
PartyCandidateVotes%±
Labour Heather Broadbent84726.2N/A
Conservative Anthony Hugill77523.9+5.7
Labour Andy Turner66820.6-1.9
Conservative James Cosslett65720.3N/A
UKIP Alan Breeze2939.0N/A
Turnout 1,84029.4+4.5
Labour hold Swing N/A
Conservative gain from Labour Swing N/A
Ferryhill (3 seats)
PartyCandidateVotes%±
Independent Brian Avery1,12718.6+3.3
Independent Joe Makepeace83413.8N/A
Labour Peter Atkinson80613.3N/A
Independent David Farry74012.2-1.7
Labour John Lindsay73112.1N/A
Independent Laura Wayman73112.1N/A
Labour Carole Atkinson72211.9N/A
Conservative Douglas Hutley3676.0N/A
Turnout 2,38329.6+2.8
Independent hold Swing N/A
Independent gain from Labour Swing N/A
Labour hold Swing N/A
Framwellgate and Newton Hall (3 seats)
PartyCandidateVotes%±
Liberal Democrat Amanda Hopgood2,49121.4+6.5
Liberal Democrat Mark Wilkes2,45921.1+6.6
Liberal Democrat Frances Simmons2,28619.7+6.4
Labour Dave Gill8927.7N/A
Labour Anne Bonner7686.6N/A
Conservative Joshua Morgan6956.0N/A
Labour Susan Nelson6875.9N/A
Conservative Philip Heath6585.7N/A
Green Elizabeth Bromley2712.3N/A
Green Clare Galland2141.8N/A
Green Rim Hassen2121.8N/A
Turnout 4,18340.4+3.7
Liberal Democrat hold Swing N/A
Horden (2 seats)
PartyCandidateVotes%±
Labour Ian McLean74826.2N/A
Labour June Clark67323.6-7.3
North East Party Mary Cartwright46116.1N/A
Independent John Maddison38113.3N/A
North East Party David Hawley2659.3N/A
Independent Doug Langan2428.5-6.1
Conservative Kathleen Currie873.0N/A
Turnout 1,54427.3+1.0
Labour hold Swing N/A
Lanchester (2 seats)
PartyCandidateVotes%±
Labour Ossie Johnson93723.9-7.0
Labour Jude Considine65216.6N/A
Derwentside Independents Richie Young64216.3-6.4
Derwentside Independents John Ingham56714.4N/A
Conservative Richard Coad52213.3N/A
Liberal Democrat Keith English2426.2N/A
Independent David Lindsay2035.2N/A
Liberal Democrat David Rolfe1614.1N/A
Turnout 2,19036.9+3.6
Labour hold Swing N/A
Labour gain from Derwentside Independents Swing N/A
Leadgate and Medomsley (2 seats)
PartyCandidateVotes%±
Derwentside Independents Watts Stelling1,42632.7+1.0
Derwentside Independents Alan Shield1,27529.2+3.4
Labour Liam Carr73216.8-5.1
Labour Donna Summerson59713.7N/A
Conservative Gaynor-Anne Taffurelli3317.6N/A
Turnout 6,69036.3+2.4
Derwentside Independents hold Swing N/A
Lumley (2 seats)
PartyCandidateVotes%±
Independent Alan Bell1,07929.4-2.8
Independent Audrey Willis82422.4-4.0
Labour Anna Lavery52314.3N/A
Independent David Thompson51013.9-8.0
Labour Lauren Anders39610.8N/A
Conservative Graham Fielder3399.2N/A
Turnout 2,04536.3+4.8
Independent hold Swing N/A
Murton (2 seats)
PartyCandidateVotes%±
Labour Alan Napier98329.7-9.9
Labour Joyce Maitland83625.3-11.5
Independent Thomas Young60418.2N/A
UKIP Brian Brown37011.2N/A
UKIP Stephen Robson3209.7N/A
Conservative Oliver Lewis1965.9N/A
Turnout 1,84131.3+3.5
Labour hold Swing N/A
Neville's Cross (2 seats)
PartyCandidateVotes%±
Liberal Democrat Liz Brown1,19222.6N/A
Liberal Democrat Elizabeth Scott1,05620.0N/A
Green Jonathan Elmer94817.9+4.7
Green Sarah Thin72413.7N/A
Conservative William Halford3476.6N/A
Conservative Michael Smith3095.9+0.8
Labour Owen Edwards2745.2N/A
Labour Maciej Matuszewski2725.1N/A
Independent Stephen Ashfield1583.0-9.8
Turnout 2,70840.9+8.8
Liberal Democrat hold Swing N/A
North Lodge (1 seat)
PartyCandidateVotes%±
Liberal Democrat Craig Martin74352.3+29.5
Independent Peter May46432.7-14.8
Labour Saul Cahill1107.7N/A
Conservative John Middleton1047.3N/A
Turnout 1,42151.2+12.2
Liberal Democrat gain from Independent Swing N/A

P − S

Passfield (1 seat)
PartyCandidateVotes%±
North East Party Karen Hawley33734.0N/A
Independent Joan Maslin29629.9-6.7
Labour Barry Wilson20120.3N/A
Conservative Isaac Duffy15715.8N/A
Turnout 99128.4+2.3
North East Party gain from Independent Swing N/A
Pelton (3 seats)
PartyCandidateVotes%±
Labour Alison Batey1,84626.9-0.4
Labour Colin Carr1,43120.9-0.8
Labour Danny Wood1,37120.0N/A
Conservative Michael Botterill1,00014.6N/A
UKIP Callum Redfern6819.9N/A
Green David Revett5307.7N/A
Turnout 2,94429.4+3.7
Labour hold Swing N/A
Peterlee East (2 seats)
PartyCandidateVotes%±
Labour Audrey Laing58624.8-3.6
Labour Harry Bennett56824.0-7.1
North East Party Lee Cook54723.2N/A
North East Party Vik Watson53122.5N/A
Conservative Jonty Bayliss1295.5N/A
Turnout 1,27023.3-0.1
Labour hold Swing N/A
Peterlee West (2 seats)
PartyCandidateVotes%±
North East Party Susan McDonnell73626.7+6.3
North East Party Karon Liddell63523.1N/A
Labour Jimmy Alvey62322.6-3.0
Labour Lisa Alvey54919.9N/A
Conservative Aaron Lee2117.7N/A
Turnout 1,48324.0+0.6
North East Party gain from Labour Swing N/A
Sacriston (2 seats)
PartyCandidateVotes%±
Labour Heather Liddle1,01336.7+4.8
Labour Simon Wilson95234.4+2.7
Conservative Graeme Hynds40314.6N/A
UKIP Michael Toms39414.3+2.8
Turnout 1,64430.0+4.0
Labour hold Swing N/A
Seaham (2 seats)
PartyCandidateVotes%±
Labour Geraldine Bleasdale63420.4-6.5
Labour Sue Morrison60419.4-5.8
Seaham Community PartyGraeme Hepworth47115.1N/A
Conservative Derick Dixon46815.0+5.0
Seaham Community PartyAdam Remmer43814.1N/A
Conservative Margaret Reid40212.9+5.4
Green Helen Reay943.0N/A
Turnout 1,61730.1+5.2
Labour hold Swing N/A
Sedgefield (2 seats)
PartyCandidateVotes%±
Conservative David Brown81720.2-0.7
Labour John Robinson80019.8-8.5
Labour Rachel Lumsdon73318.1-4.7
Independent Mel Carr47911.8N/A
Independent Gloria Wills3017.4N/A
Conservative John Gasston2937.2N/A
Liberal Democrat Alan Bell1934.8N/A
Independent Jimmy Seymour1684.2-7.7
UKIP Tim Illingworth1443.6N/A
Independent Christine Moore1192.9N/A
Turnout 2,17328.6-7.1
Conservative gain from Labour Swing N/A
Labour hold Swing N/A
Sherburn (2 seats)
PartyCandidateVotes%±
Labour David Hall1,13132.1+7.0
Labour Bill Kellett1,05629.9N/A
Conservative Raymond Taffurelli52314.8N/A
Liberal Democrat Ellie Hopgood45212.8N/A
Liberal Democrat Andrew Tibbs36610.4N/A
Turnout 1,98429.9-0.8
Labour hold Swing N/A
Shildon and Dene Valley (3 seats)
PartyCandidateVotes%±
Labour Henry Nicholson1,17217.7+0.5
Labour Brian Stephens1,12917.0-2.2
Labour Shirley Quinn1,02315.4N/A
Liberal Democrat James Huntington81712.3N/A
Independent Robert Ingledew81412.3+3.1
Liberal Democrat Lenny Cockfield6259.4N/A
Conservative Mary Gilbertson5878.8N/A
UKIP John Brigstock4687.1N/A
Turnout 2,72228.8+1.3
Labour hold Swing N/A
Shotton and South Hetton (2 seats)
PartyCandidateVotes%±
Independent Ivan Cochrane80825.0+1.7
Labour Eunice Huntington73822.9-7.4
Labour Alan Liversidge69521.5N/A
Independent Christopher Hood61719.1N/A
Conservative Vicki Lincoln2688.3N/A
Liberal Democrat Christian Round1033.2N/A
Turnout 1,76826.7+2.7
Independent gain from Labour Swing N/A
Labour hold Swing N/A
Spennymoor (3 seats)
PartyCandidateVotes%±
Spennymoor IndependentsKevin Thompson1,14013.5-3.8
Spennymoor IndependentsGeoff Darkes93811.1N/A
Spennymoor IndependentsLiz Maddison89410.5-4.2
Liberal Democrat Ben Ord8249.7-4.9
Labour Ian Geldard7458.8-7.1
Labour Steven Jones6427.6N/A
Independent Pete Molloy6017.1N/A
Liberal Democrat Beckie Calder5796.8N/A
Labour Kathleen Griffiths5176.1N/A
Liberal Democrat Dean Ranyard5176.1N/A
Conservative Alan Booth3624.3N/A
Conservative Richard Child3323.9N/A
UKIP James Hargrave2583.0N/A
Green Mark Quinn1301.5N/A
Turnout 3,09236.2+8.6
Spennymoor Independents hold
Spennymoor Independents gain from Labour
Stanley (2 seats)
PartyCandidateVotes%±
Labour Carl Marshall92430.5-6.7
Labour Lyn Boyd91930.4N/A
Derwentside Independents David Walker49616.4N/A
Derwentside Independents Mary Wilkinson43714.4N/A
Conservative Gary McCallum2508.3N/A
Turnout 1,66226.5+1.4
Labour hold Swing N/A

T − W

Tanfield (2 seats)
PartyCandidateVotes%±
Derwentside Independents Joyce Charlton92925.1+1.6
Labour Olga Milburn83922.7-4.9
Labour Gordon Binney80021.6N/A
Derwentside Independents Colin Thompson76620.7N/A
Conservative Kevin Foster2747.4N/A
Liberal Democrat Julia Wright942.5N/A
Turnout 1,99130.4+3.7
Derwentside Independents hold Swing N/A
Labour hold Swing N/A
Tow Law (1 seat)
PartyCandidateVotes%±
Labour Richard Manchester43346.7N/A
Independent John Bailey30032.3N/A
Conservative Andrew Dixon19521.0N/A
Turnout 92827.8+2.6
Labour hold Swing N/A
Trimdon and Thornley (3 seats)
PartyCandidateVotes%±
Labour Lucy Hovvels1,43324.3-2.8
Labour Peter Brookes1,41324.0-2.5
Labour Morris Nicholls1,39223.6-5.3
UKIP Clive Taylor-Sholl5829.9N/A
Conservative Ilsa Graham5469.3N/A
Liberal Democrat Martin Jones2955.0N/A
Liberal Democrat Elizabeth Temple2313.9N/A
Turnout 2,43325.0+0.1
Labour hold Swing N/A
Tudhoe (2 seats)
PartyCandidateVotes%±
Spennymoor IndependentsNeil Grayson80220.8N/A
Spennymoor IndependentsAlan Gardner77520.1N/A
Labour Barbara Graham65417.0-11.3
Independent Billy McAloon63516.4N/A
Labour Neil Foster62416.2-9.7
Conservative Linda Raper3679.5N/A
Turnout 2,14833.7+1.7
Spennymoor Independents gain from Labour
Weardale (2 seats)
PartyCandidateVotes%±
Independent John Shuttleworth1,89938.2+1.7
Independent Mary Savory1,71734.5+0.4
Labour Robert George50910.2N/A
Conservative Peter Gilbertson4959.9N/A
Labour Alan Myers3587.2N/A
Turnout 2,97645.6+3.9
Independent hold Swing N/A
West Auckland (2 seats)
PartyCandidateVotes%±
Labour Rob Yorke80826.9-5.0
Labour Christine Wilson75925.3-2.9
Conservative Mark Roberts58519.5N/A
Conservative Victor Thompson35911.9N/A
Independent Alex Tighe2548.4N/A
UKIP Lee Harris2398.0N/A
Turnout 1,63325.2+4.1
Labour hold Swing N/A
Willington and Hunwick (2 seats)
PartyCandidateVotes%±
Labour Fraser Tinsley1,08635.0N/A
Labour Olwyn Gunn1,06934.4+5.4
Conservative Helen Hannar62920.3N/A
Liberal Democrat Samuel Richardson31810.3N/A
Turnout 1,84627.1+2.2
Labour hold Swing N/A
Wingate (1 seat)
PartyCandidateVotes%±
Labour Robert Taylor57773.7+5.9
Conservative Greta Pike10713.6N/A
North East Party Stephen Miles7810.0N/A
Liberal Democrat Cameron Lord212.7N/A
Turnout 78326.0+1.6
Labour hold Swing N/A
Woodhouse Close (2 seats)
PartyCandidateVotes%±
Labour John Lethbridge76537.1+6.0
Labour Tanya Tucker59428.8N/A
Conservative Nichola Thompson39619.2N/A
UKIP Colin Race30614.9N/A
Turnout 1,28720.9+1.6
Labour hold Swing N/A

Related Research Articles

Derwentside Independents

Derwentside Independents is a localist political party in County Durham, England. It was established in 2001 to contest elections to Derwentside District Council, later contesting elections to Durham County Council following the establishment of a unitary authority in 2013.

Stockton-on-Tees is a unitary authority in County Durham and North Yorkshire, England. Until 1 April 1996 it was a non-metropolitan district in Cleveland.

Darlington is a unitary authority in County Durham, England. Until 1 April 1997 it was a non-metropolitan district.

2009 Suffolk County Council election

Elections to Suffolk County Council were held on 4 June 2009 as part of the 2009 United Kingdom local elections on the same day as the elections to the European Parliament. 75 councillors were elected from 63 electoral divisions, which returned either one or two county councillors each by first-past-the-post voting for a four-year term of office. The electoral divisions were the same as those used at the previous election in 2004.

Shropshire Council is elected in full every four years.

The Church of the Militant Elvis Party is a political party in the United Kingdom. The leader of the party is David Bishop who also goes by the nicknames of 'Lord Biro' and 'Bus-pass Elvis'. The party has six registered campaign groups: 'Bus-pass Elvis Party', 'Elvis Defence League', 'Elvis turns Green Party', 'Grumpy old Elvis Party', 'Militant Elvis Anti-Tesco Popular Front' (MEAT-PF), the 'Elvis and the Yeti Himalayan Preservation Party', and 'Militant Elvis Anti-HS2'.

2013 Kent County Council election

The Kent County Council election, 2013 was an election to all 84 seats on Kent County Council held on Thursday 2 May as part of the United Kingdom local elections, 2013. 84 councillors were elected from 72 electoral divisions, which returned either one or two county councillors each by first-past-the-post voting for a four-year term of office. The electoral divisions were the same as those used at the previous election in 2009. No elections were held in Medway, which is a unitary authority outside the area covered by the County Council. The election saw the Conservative Party narrowly retain overall control of the council.

2013 Cambridgeshire County Council election

An election to Cambridgeshire County Council took place on 2 May 2013 as part of the United Kingdom local elections, 2013. 69 councillors were elected from 60 electoral divisions, which returned either one or two county councillors each by first-past-the-post voting for a four-year term of office. The electoral divisions were the same as those used at the previous election in 2009. No elections were held in Peterborough, which is a unitary authority outside the area covered by the County Council. The election saw the Conservative Party lose overall control of the council.

2013 Durham County Council election

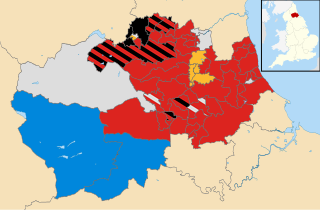
An election to Durham County Council took place on 2 May 2013 as part of the United Kingdom local elections, 2013. Following a boundary review, 126 councillors were elected from 63 electoral divisions which returned either one, two or three councillors each by first-past-the-post voting for a four-year term of office. The previous election took place in 2008 in advance of the council becoming a unitary authority after the 2009 changes to local government. The election saw the Labour Party increase their majority on the council.

2005 Durham County Council election

Elections to Durham County Council took place on 5 May 2005 as part of the 2005 local elections in the United Kingdom. The election also took place on the same day as the 2005 general election. This was the council's final election before it became a unitary authority as part of changes to local government in 2009, with the first elections to the new unitary council taking place in 2008. New electoral division boundaries were introduced for this election, with 63 divisions returning one councillor each using the first past the post voting system.

The 2015 Crawley Borough Council election took place on 7 May 2015 to elect approximately one third of the members of Crawley Borough Council in England as part of the English local elections coinciding with the 2015 General Election.

2016 Liverpool City Council election

The 2016 Liverpool City Council election took place on 5 May 2016 to elect members of Liverpool City Council in England. This was on the same day as the election for the Elected Mayor of Liverpool and the Police and Crime Commissioner for Merseyside.

2017 Cambridgeshire County Council election

The 2017 Cambridgeshire County Council election was held on 4 May 2017 as part of the 2017 local elections in the United Kingdom. All 61 councillors were elected from 59 electoral divisions, which returned either one or two county councillors each by first-past-the-post voting for a four-year term of office.

2017 Cornwall Council election

The 2017 Cornwall Council election was held on 4 May 2017 as part of the 2017 local elections in the United Kingdom. 122 councillors were elected from the 121 electoral divisions of Cornwall Council, which returned either one or two councillors each by first-past-the-post voting for a four-year term of office. Although originally scheduled to take place on the same day, the election in the Bodmin St Petroc ward was countermanded following the death of Liberal Democrat candidate Steve Rogerson and was held on 8 June.

2017 Powys County Council election

The fifth election to the Powys County Council since local government reorganization in Wales in 1995 was held on 4 May 2017, along with other local government elections. It was preceded by the 2012 election and will be followed by the 2022 election.

Langworthy (ward) Electoral ward in England, United Kingdom

Langworthy (ward) is an electoral ward of Salford, England. It is represented in Westminster by Rebecca Long-Bailey MP for Salford and Eccles. A profile of the ward conducted by Salford City Council in 2014 recorded a population of 12,980.

2003 Mid Bedfordshire District Council election

Elections to Mid Bedfordshire District Council were held on 1 May 2003. All 53 seats were up for election. Councillors elected would serve a four-year term, expiring in 2007. The Conservative Party retained overall control of the council, winning 37 of 53 seats on the council. The Conservatives won 7 seats unopposed.

Rory Palmer politician

Rory Palmer is a British Labour Party politician. He became Labour Member of the European Parliament for the East Midlands on 3 October 2017.

2018 Hyndburn Borough Council election

A by-thirds Hyndburn Borough Council local election, was held on Thursday 03 May 2018. Approximately one third of the local council's 35 seats fall up for election on that day.

2018 Tower Hamlets London Borough Council election

Elections to Tower Hamlets London Borough Council were held on 3 May 2018, the same day as other borough council elections in London. The directly-elected mayor of Tower Hamlets was also up for election.

References

  1. "Upcoming elections & referendums". Electoral Commission. Retrieved 15 September 2016.
  2. "Statement of Persons Nominated" (PDF). Durham County Council. 5 April 2017. Retrieved 5 April 2017.