Durham County Council election, 2005

Last updated

Results by electoral division. Key:
Conservative
Labour
Liberal Democrat
Independent
Derwentside Independents Durham UK local election 2005 map.svg
Results by electoral division. Key:
  Conservative
  Labour
  Liberal Democrat
  Independent
  Derwentside Independents

Elections to Durham County Council took place on 5 May 2005 as part of the 2005 local elections in the United Kingdom. The election also took place on the same day as the 2005 general election. This was the council's final election before it became a unitary authority as part of changes to local government in 2009, with the first elections to the new unitary council taking place in 2008. New electoral division boundaries were introduced for this election, with 63 divisions returning one councillor each using the first past the post voting system. [1]

Durham County Council British administrative body

Durham County Council is the local authority of the non-metropolitan County Durham in North East England. Since 2009 it has been a unitary authority, having the powers of a non-metropolitan county and district council combined. From 1889 to 2009 it was a county council in a two-tier arrangement.

Contents

Labour kept control of the council with 53 seats. The Liberal Democrats were second with five seats and the Conservatives won two seats. [2] There were also three independents elected, including two from the Derwentside Independents group.

The Labour Party is a centre-left political party in the United Kingdom which has been described as an alliance of social democrats, democratic socialists and trade unionists. The party's platform emphasises greater state intervention, social justice and strengthening workers' rights.

Liberal Democrats (UK) Political party in the United Kingdom

The Liberal Democrats are a liberal political party in the United Kingdom. They presently have 11 Members of Parliament in the House of Commons, 96 members of the House of Lords, and one member of the European Parliament. They also have five Members of the Scottish Parliament and a member each in the Welsh Assembly and London Assembly. The party reached the height of its influence in the early 2010s, forming a junior partner in a coalition government from 2010 to 2015. It is presently led by Vince Cable.

Conservative Party (UK) Political party in the United Kingdom

The Conservative Party, officially the Conservative and Unionist Party, is a centre-right political party in the United Kingdom. The governing party since 2010, it is the largest in the House of Commons, with 314 Members of Parliament, and also has 249 members of the House of Lords, 18 members of the European Parliament, 31 Members of the Scottish Parliament, 12 members of the Welsh Assembly, eight members of the London Assembly and 9,008 local councillors.

Results

Durham County Council election, 2005 [3] [4]
PartySeatsGainsLossesNet gain/lossSeats %Votes %Votes+/−
  Labour 53N/AN/AN/A 84.1% 56.7% 124,683N/A
  Liberal Democrat 5N/AN/AN/A 7.9% 20.4% 44,878N/A
  Conservative 2N/AN/AN/A 3.2% 14.7% 32,358N/A
  Derwentside Independents 2N/AN/AN/A 3.2% 3.6% 7,835N/A
  Independent 1N/AN/AN/A 1.6% 4.5% 9,833N/A
  Socialist (GB) 0N/AN/AN/A 0.0% 0.1% 288N/A
  BNP 0N/AN/AN/A 0.0% 0.1% 119N/A

Results by electoral division

Chester-le-Street (7 seats)

Chester-le-Street North & East
PartyCandidateVotes%±
Labour Joseph Knox 1,816 47.3N/A
Liberal Democrat Sandra Hutchinson 799 20.8N/A
Conservative Beatrice Bainbridge 630 16.4N/A
Independent Lancelot Edward William Brown 592 15.4N/A
Chester-le-Street South
PartyCandidateVotes%±
Labour Rita Greener Carr 1,946 49.3N/A
Liberal Democrat Russell Amor Haswell 1,254 31.8N/A
Conservative Amanda Jane Hall 745 18.9N/A
Chester-le-Street West Central
PartyCandidateVotes%±
Labour Brian David Ebbatson 1,853 63.6N/A
Liberal Democrat Sean Kilkenny 682 23.4N/A
Conservative Philip Clive Stevens 378 12.9N/A
Lumley
PartyCandidateVotes%±
Labour John Brian Walker 1,860 53.1N/A
Liberal Democrat Angela Mary Rae 593 16.9N/A
Conservative Justin Matthew Garrod 576 16.4N/A
Independent Audrey Willis 475 13.6N/A
Ouston and Urpeth
PartyCandidateVotes%±
Labour Christine Teresa Smith 2,170 60.5N/A
Liberal Democrat Paul John Leake 827 23.1N/A
Conservative James Norman 588 16.4N/A
Pelton
PartyCandidateVotes%±
Labour James Sands Cordon 1,848 49.3N/A
Liberal Democrat George Herbert Gardner 698 18.6N/A
Conservative Frank Lumsden 655 17.5N/A
Independent William Laverick 545 14.5N/A
Sacriston
PartyCandidateVotes%±
Labour Linda Anne Wright 1,693 66.6N/A
Liberal Democrat Simon James Key 499 19.6N/A
Conservative Mark Anthony Watson 349 13.7N/A

Derwentside (11 seats)

Annfield Plain
PartyCandidateVotes%±
Labour Michele Hodgson 2,119 70.1N/A
Liberal Democrat Gillian Raine 623 20.6N/A
Conservative Julie Ann Watson 280 9.3N/A
Benfieldside
PartyCandidateVotes%±
Labour John Davies 1,250 40.4N/A
Derwentside Independents John Joseph Healey 866 27.9N/A
Liberal Democrat Bruce Neilson McCaig 647 20.9N/A
Conservative Julia Carole Ross 330 10.7N/A
Burnopfield and Dipton
PartyCandidateVotes%±
Derwentside Independents Reginald Ord 1,578 45.9N/A
Labour Eunice Wilkinson Turnbull 1,474 42.9N/A
Conservative Russell Alan Ross 385 11.2N/A
Consett North
PartyCandidateVotes%±
Labour Clive Robson 2,120 61.2N/A
Liberal Democrat Owen Leighton Temple 947 27.4N/A
Conservative Kenneth Hall Wilson 395 11.4N/A
Craghead and Southmoor
PartyCandidateVotes%±
Labour David Haddon Marshall 1,825 67.8N/A
Derwentside Independents James William Harper 450 16.7N/A
Liberal Democrat Denis Edwin Jackson 279 10.4N/A
Conservative Judith Turner 136 5.1N/A
Delves Lane and Consett South
PartyCandidateVotes%±
Labour Robert Young 2,178 56.1N/A
Derwentside Independents Anthony Westgarth 1,389 35.8N/A
Conservative Ivy Wilson 316 8.1N/A
Esh
PartyCandidateVotes%±
Labour Joseph Armstrong 1,463 50.9N/A
Derwentside Independents Wallace Joseph Tyrie 556 19.3N/A
Liberal Democrat Neil Robert Michael Shaw 484 16.8N/A
Conservative Patricia Ann Adams 374 12.9N/A
Lanchester
PartyCandidateVotes%±
Labour Thomas Forster 1,508 40.4N/A
Conservative Peter Michael Carr 797 21.3N/A
Derwentside Independents Richard Young 717 19.2N/A
Liberal Democrat Christine English 713 19.1N/A
Leadgate and Medomsley
PartyCandidateVotes%±
Derwentside Independents Watts Stelling 2,279 51.4N/A
Labour Eric Turner 1,663 37.5N/A
Conservative George Andrew Adams 495 11.2N/A
Stanley
PartyCandidateVotes%±
Labour Claire Louise Vasey 2,169 69.2N/A
Liberal Democrat David Agutter Rolfe 628 20.0N/A
Conservative Jonathan Turner 220 7.0N/A
BNP Dean Kevin Frederick McAdam 119 3.8N/A
Tanfield
PartyCandidateVotes%±
Labour Edna Hunter 2,036 60.3N/A
Liberal Democrat Andrew David Curtis 945 27.9N/A
Conservative Judith May Webb 395 11.7N/A

Durham (11 seats)

Belmont
PartyCandidateVotes%±
Liberal Democrat Kenneth Holroyd 1,768 52.5N/A
Labour Patricia Margaret Johnston 1,256 37.3N/A
Conservative Darren Bean 345 10.2N/A
Brandon
PartyCandidateVotes%±
Labour Ronald Clive Rodgers 2,593 61.4N/A
Liberal Democrat Maureen Jean Ann Smith 1,629 38.6N/A
Coxhoe
PartyCandidateVotes%±
Labour Dennis Morgan 2,260 65.9N/A
Liberal Democrat Stephen Maurice Martin 866 25.3N/A
Conservative Frederick Farley 300 8.8N/A
Deerness Valley
PartyCandidateVotes%±
Labour Jean Kathleen Chaplow 2,705 60.9N/A
Liberal Democrat Arnold Simpson 1,357 30.5N/A
Conservative Alistair Tebbit 381 8.6N/A
Durham South
PartyCandidateVotes%±
Labour Donna Michelle Whitfield 1,526 46.8N/A
Liberal Democrat Isabell Lunan 1,429 43.8N/A
Conservative Jennifer Duncan Wakefield 306 9.4N/A
Elvet
PartyCandidateVotes%±
Liberal Democrat David Robert Freeman 2,184 56.8N/A
Labour John Ashby 925 24.0N/A
Conservative Christopher John Arthur 739 19.2N/A
Framwellgate Moor
PartyCandidateVotes%±
Labour Norman Donald Parker Ross 2,339 48.9N/A
Liberal Democrat Redvers Frederick Crooks 1,952 40.8N/A
Conservative Patricia Wynne 496 10.4N/A
Gilesgate
PartyCandidateVotes%±
Liberal Democrat Dennis James Southwell 1,848 48.2N/A
Labour Peter James Thompson 1,763 45.9N/A
Conservative Jeremy Richard Stocker 226 5.9N/A
Neville's Cross
PartyCandidateVotes%±
Liberal Democrat Nigel Martin 2,681 63.8N/A
Labour Jonathan George Alfred Roberts 923 21.9N/A
Conservative Michael Drummond Moverley Smith 601 14.3N/A
Newton Hall
PartyCandidateVotes%±
Liberal Democrat Frances Marnie Simmons 2,328 53.9N/A
Labour Aurelia Constance Smith 1,569 36.4N/A
Conservative Helen Dorothy Osborn 415 9.6N/A
Sherburn
PartyCandidateVotes%±
Labour Raymond Pye 2,412 53.8N/A
Liberal Democrat Lesley Jane King 1,690 37.7N/A
Conservative Michael James Fishwick 385 8.6N/A

Easington (12 seats)

Blackhalls
PartyCandidateVotes%±
Labour Alan Cox 2,639 80.1N/A
Conservative Julia Anne Welford 655 19.9N/A
Dawdon
PartyCandidateVotes%±
Labour Alan Fenwick 1,717 79.7N/A
Conservative Jacquelyn Butler 438 20.3N/A
Deneside
PartyCandidateVotes%±
Labour Albert Nugent 1,921 74.7N/A
Conservative Mark Thomas Nicholson 361 14.0N/A
Socialist (GB) Stephen Paul Colborn 288 11.2N/A
Easington
PartyCandidateVotes%±
Labour Alan Barker 2,519 79.4N/A
Conservative Margaret Reid 652 20.6N/A
Horden
PartyCandidateVotes%±
Labour Peter Paul Stradling 2,723 88.2N/A
Conservative Mona Riley 366 11.8N/A
Murton
PartyCandidateVotes%±
Labour John William Downie Maddison 2,510 85.2N/A
Conservative Christopher Edward James Butler 436 14.8N/A
Peterlee East
PartyCandidateVotes%±
Labour Gordon Tennant 1,856 75.2N/A
Independent Leslie Reynolds 404 16.4N/A
Conservative Roger John Nimmo Booth 209 8.5N/A
Peterlee West
PartyCandidateVotes%±
Labour Dennis Coates 2,276 85.8N/A
Conservative Hazel Lodge 376 14.2N/A
Seaham
PartyCandidateVotes%±
Labour Ronald Meir 2,246 69.8N/A
Conservative Derick Dixon 971 30.2N/A
Shotton
PartyCandidateVotes%±
Labour Norman Wade 2,735 83.6N/A
Conservative Lucille Diana Nicholson 538 16.4N/A
Thornley
PartyCandidateVotes%±
Labour Morris Nicholls 2,642 89.9N/A
Conservative Jack Victor Seear 297 10.1N/A
Wingate
PartyCandidateVotes%±
Labour Leonard O'Donnell 3,205 78.7N/A
Conservative Lindsay Marigold Seear 870 21.3N/A

Sedgefield (11 seats)

Aycliffe East
PartyCandidateVotes%±
Labour Sarah Jane Iveson 1,836 59.6N/A
Independent William Maurice Blenkinsopp 890 28.9N/A
Conservative Geoffrey Nicholas Crass 356 11.6N/A
Aycliffe North
PartyCandidateVotes%±
Labour Keith Henderson 1,859 53.3N/A
Independent Terence Hogan 991 28.4N/A
Conservative Joyce Mary Raine 636 18.2N/A
Aycliffe West
PartyCandidateVotes%±
Labour George Coulson Gray 1,815 57.0N/A
Independent Enid Marion Paylor 956 30.0N/A
Conservative Patricia Margaret Waller 412 12.9N/A
Chilton
PartyCandidateVotes%±
Labour George Porter 2,516 65.2N/A
Liberal Democrat Christine Sproat 890 23.1N/A
Conservative William Leslie Turner 453 11.7N/A
Ferryhill
PartyCandidateVotes%±
Labour Charles Magee 2,728 66.1N/A
Liberal Democrat Paul Mountford 1,156 28.0N/A
Conservative Patricia Anne Whan 243 5.9N/A
Sedgefield
PartyCandidateVotes%±
Labour John Robinson 2,196 57.6N/A
Conservative David Ralph Brown 1,616 42.4N/A
Shildon East
PartyCandidateVotes%±
Labour Dorothy Bowman 1,968 53.0N/A
Liberal Democrat Gareth Michael Robinson Howe 791 21.3N/A
Independent Simon Joseph Brown 595 16.0N/A
Conservative Alan Booth 356 9.6N/A
Shildon West
PartyCandidateVotes%±
Labour Vernon Chapman 1,312 42.5N/A
Liberal Democrat James Garry Huntington 1,310 42.5N/A
Independent John Mayfors Smith 337 10.9N/A
Conservative Marney Jane Swan 126 4.1N/A
Spennymoor and Middlestone
PartyCandidateVotes%±
Labour Ernest Foster 2,413 57.4N/A
Liberal Democrat Kevin Thompson 1,358 32.3N/A
Conservative Paul Andrew Carmedy 431 10.3N/A
Trimdon
PartyCandidateVotes%±
Labour Paul Trippett 2,744 76.2N/A
Conservative Christine Moyle 857 23.8N/A
Tudhoe
PartyCandidateVotes%±
Labour Neil Crowther Foster 2,526 61.8N/A
Liberal Democrat Martin Thomas Brian Jones 1,041 25.5N/A
Conservative Matthew Miller 523 12.8N/A

Teesdale (3 seats)

Barnard Castle East
PartyCandidateVotes%±
Conservative Josephine Hazel Fergus 2,423 57.5N/A
Labour Fred Blackwell 1,788 42.5N/A
Barnard Castle West
PartyCandidateVotes%±
Conservative Richard Andrew Bell 2,155 52.1N/A
Labour Keith Stokeld 1,143 27.6N/A
Independent David Andrew Wearmouth 842 30.3N/A
Evenwood
PartyCandidateVotes%±
Labour John Priestley 2,246 58.5N/A
Conservative George Morland Richardson 1,592 41.5N/A

Wear Valley (8 seats)

Bishop Auckland Town
PartyCandidateVotes%±
Labour Kenneth Manton 1,459 41.4N/A
Liberal Democrat Chris Foote-Wood 1,042 29.6N/A
Conservative Colin Raine 666 18.9N/A
Independent Stephen Anthony Hare 208 5.9N/A
Independent Thomas Waggott 145 4.1N/A
Coundon
PartyCandidateVotes%±
Labour Philip Robert Graham 1,616 59.8N/A
Liberal Democrat Thomas Taylor 787 29.1N/A
Conservative Douglas David Milne 300 11.1N/A
Crook North and Tow Law
PartyCandidateVotes%±
Labour Trevor Carroll 1,553 54.2N/A
Liberal Democrat John Bailey 1,314 45.8N/A
Crook South
PartyCandidateVotes%±
Labour Robert Pendlebury 2,194 68.9N/A
Liberal Democrat David English 987 31.0N/A
Weardale
PartyCandidateVotes%±
Independent John Shuttleworth 2,853 67.8N/A
Liberal Democrat Dorothy Allan 774 18.4N/A
Labour Alison Mary Hiles 583 13.8N/A
West Auckland
PartyCandidateVotes%±
Labour Harold Douthwaite 1,619 52.5N/A
Liberal Democrat John Ferguson 1,057 34.3N/A
Conservative Howard Bowen-Jones 407 13.2N/A
Willington
PartyCandidateVotes%±
Labour Brian Leslie Myers 2,199 62.7N/A
Liberal Democrat Anne Maria Glynn 1,309 37.3N/A
Woodhouse Close
PartyCandidateVotes%±
Labour John Lethbridge 2,119 67.7N/A
Liberal Democrat Winston Edward Frank Perkins 712 22.7N/A
Conservative Sandra J Moorhouse 299 9.6N/A

Related Research Articles

Stockton-on-Tees is a unitary authority in County Durham and North Yorkshire, England. Until 1 April 1996 it was a non-metropolitan district in Cleveland.

Darlington is a unitary authority in County Durham, England. Until 1 April 1997 it was a non-metropolitan district.

Elections to Durham County Council are held every four years. The council was created as part of the 1972 local government reforms. The first elections to the new authority were held in 1973 in advance of the council taking office in 1974. As part of changes to local government in 2009, the council became a unitary authority with the first elections to the new council taking place in 2008. Since becoming a unitary authority, 126 councillors have been elected from 63 wards.

As a result of the 2009 structural changes to local government in England, the former Wiltshire County Council and the four districts within its geographical area were replaced by the new Wiltshire Council, which is a unitary authority covering the same area, with elections continuing to be held every four years, beginning in June 2009. Previously, Wiltshire County Council had been elected between 1889 and 2005, initially every three years, later every four years.

Shropshire Council British administrative body

Shropshire Council is the local authority of Shropshire in England. It is a unitary authority, having the powers of a non-metropolitan county and district council combined.

Shropshire Council is elected in full every four years.

2009 Cornwall Council election

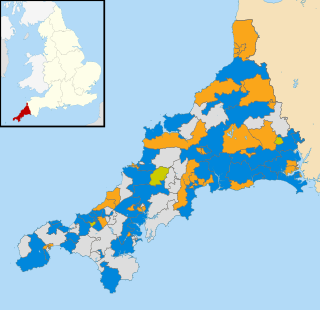
The Cornwall Council election, 2009, was an election for all 123 seats on the council. Cornwall Council is a unitary authority that covers the majority of the ceremonial county of Cornwall, with the exception of the Isles of Scilly which have an independent local authority. The elections took place concurrently with other local elections across England and Wales as well as the UK component of the elections to the European Parliament. Cornwall had seen its district and county councils abolished, replaced by a single 123-member Cornish unitary authority, for which councillors were elected for a full term.

2009 Hampshire County Council election

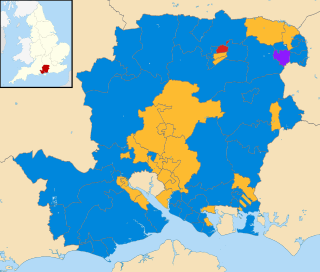
An election to Hampshire County Council took place on 4 June 2009 as part of the United Kingdom local elections, 2009, having been delayed from 7 May, to coincide with elections to the European Parliament. 78 councillors were elected from 75 electoral divisions, which returned either one or two county councillors each by first-past-the-post voting for a four-year term of office. The electoral divisions were the same as those used at the previous election in 2005. Elections in Portsmouth and Southampton do not coincide with this set, being unitary authorities outside the area covered by the County Council.

2008 Durham County Council election

Elections to Durham County Council took place on 1 May 2008, along with other local elections in the UK. This was the first election to the unitary authority established as part of the 2009 changes to local government, and all seats were up for election using the first past the post voting system. The election saw the council double in size to 126 councillors, with 63 electoral divisions each returning two members.

2013 United Kingdom local elections

The 2013 United Kingdom local elections took place on Thursday 2 May 2013. Elections were held in 35 English councils: all 27 non-metropolitan county councils and eight unitary authorities, and in one Welsh unitary authority. Direct mayoral elections took place in Doncaster and North Tyneside. These elections last took place on the 4 June 2009 at the same time as the 2009 European Parliament Elections, except for County Durham, Northumberland and the Anglesey where elections last took place in 2008.

2013 Shropshire Council election

Elections to Shropshire Council were held on 2 May 2013 as part of the United Kingdom local elections, 2013. These were the second elections to the unitary authority created as part of local government restructuring in Shropshire, following on from the previous elections in 2009. All 74 seats in the 63 electoral divisions were up for election across Shropshire. At the same time, all town and parish council contested elections took place, most notably including Shrewsbury Town Council.

2013 Hampshire County Council election

An election to Hampshire County Council took place on 2 May 2013 as part of the United Kingdom local elections, 2013. 78 councillors were elected from 75 electoral divisions, which returned either one or two county councillors each by first-past-the-post voting for a four-year term of office. The electoral divisions were the same as those of the previous election in 2009. No elections were held in Portsmouth and Southampton, which are unitary authorities outside the area covered by the County Council. The election saw the Conservative Party retain overall control of the council, with a reduced majority of five councillors.

2013 Durham County Council election

An election to Durham County Council took place on 2 May 2013 as part of the United Kingdom local elections, 2013. Following a boundary review, 126 councillors were elected from 63 electoral divisions which returned either one, two or three councillors each by first-past-the-post voting for a four-year term of office. The previous election took place in 2008 in advance of the council becoming a unitary authority after the 2009 changes to local government. The election saw the Labour Party increase their majority on the council.

2013 Essex County Council election

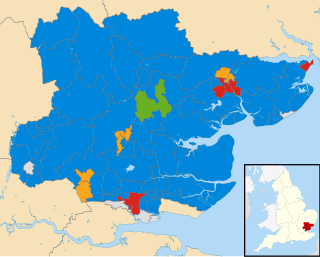
An election to Essex County Council took place on 2 May 2013 as part of the United Kingdom local elections, 2013. 75 councillors were elected from 70 electoral divisions, which returned either one or two county councillors each by first-past-the-post voting for a four-year term of office. The electoral divisions were the same as those used at the previous election in 2009. No elections were held in Thurrock or Southend-on-Sea, which are unitary authorities outside the area covered by the County Council.

2013 Staffordshire County Council election

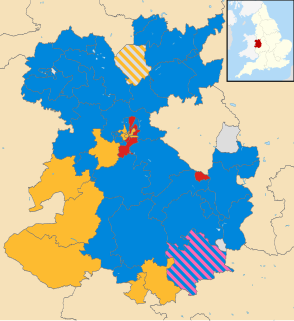
An election to Staffordshire County Council took place on 2 May 2013 as part of the United Kingdom local elections, 2013. 62 electoral divisions returned one county councillor each by first-past-the-post voting for a four-year term of office. Following a boundary review, new electoral division boundaries were established for this election. No elections were held in Stoke-on-Trent, which is a unitary authority outside the area covered by the County Council. The council continues to be administered on the Leader and Cabinet model.

2017 United Kingdom local elections

The 2017 United Kingdom local elections were held on Thursday 4 May 2017. Local elections were held across Great Britain, with elections to 35 English local authorities and all councils in Scotland and Wales.

2017 Essex County Council election

Elections to Essex County Council took place on 4 May 2017 as part of the 2017 local elections. All 75 councillors were elected from 70 electoral divisions, which each returned either one or two councillors by first-past-the-post voting for a four-year term of office.

2017 Derbyshire County Council election

An election to Derbyshire County Council took place on 4 May 2017 as part of the United Kingdom local elections, 2017. 64 councillors were elected from 61 electoral divisions which returned either one or two county councillors each by first-past-the-post voting for a four-year term of office. No elections were held in the City of Derby, which is a unitary authority outside the area covered by the County Council. The Conservative Party won back control of the council, taking thirty-seven of the authority's sixty-four seats.

2017 Lincolnshire County Council election

The 2017 Lincolnshire County Council election took place in non-metropolitan Lincolnshire on 4 May 2017 as part of the 2017 local elections in the United Kingdom. A total of 70 councillors were elected from each of the seven district councils that make up non-metropolitan Lincolnshire from 70 one member electoral divisions by first-past-the-post voting for a four-year term of office. The election did not include North Lincolnshire and North East Lincolnshire as they are separate unitary authorities.

2017 Cornwall Council election

The 2017 Cornwall Council election was held on 4 May 2017 as part of the 2017 local elections in the United Kingdom. 122 councillors were elected from the 121 electoral divisions of Cornwall Council, which returned either one or two councillors each by first-past-the-post voting for a four-year term of office. Although originally scheduled to take place on the same day, the election in the Bodmin St Petroc ward was countermanded following the death of Liberal Democrat candidate Steve Rogerson and was held on 8 June.

References

  1. UK Parliament. The County of Durham (Electoral Changes) Order 2005 as made, from legislation.gov.uk .
  2. "Local election results: Durham". BBC News. 6 May 2005. Retrieved 3 April 2013.
  3. "Durham County Council results". The Journal. 7 May 2005. Retrieved 3 April 2013.
  4. "Durham". Andrew Teale. Retrieved 3 April 2013.