Cambridgeshire County Council election, 2005

Last updated

Results by electoral division. Striped wards have mixed representation. Cambridgeshire UK local election 2005 map.svg
Results by electoral division. Striped wards have mixed representation.

An election to Cambridgeshire County Council took place on 5 May 2005 as part of the United Kingdom local elections, 2005. The election took place on the same day as the United Kingdom general election, 2005. 69 councillors were elected from 60 electoral divisions, which returned either one or two county councillors each by first-past-the-post voting. New electoral division boundaries were brought in for this election, increasing the number of seats from 59. The Conservative Party retained their majority on the council, while the Labour Party lost all their rural councillors with their representation limited to the city of Cambridge.

Cambridgeshire County Council British administrative body

Cambridgeshire County Council is the county council of Cambridgeshire, England. The council consists of 61 councillors, representing 59 electoral divisions. The Conservative Party took control of the council at the 2017 election after four years of no party having overall control. The council meets at Shire Hall in Cambridge. It is a member of the East of England Local Government Association.

Contents

Results

Cambridgeshire County Council election, 2005 [1] [2] [3]
PartySeatsGainsLossesNet gain/lossSeats %Votes %Votes+/−
  Conservative 42N/AN/AN/A60.9%41.9%138,135N/A
  Liberal Democrat 23N/AN/AN/A33.3%37.4%123,533N/A
  Labour 3N/AN/AN/A4.3%14.9%49,252N/A
  Green 0N/AN/AN/A0.0%3.3%10,979N/A
  Labour Co-op 1N/AN/AN/A1.4%1.5%5,014N/A
  Independent 0N/AN/AN/A0.0%0.5%1,625N/A
  UKIP 0N/AN/AN/A0.0%0.4%1,416N/A

Party strength by electoral division

The following maps show the percentage of the vote each party obtained by electoral division. A colour key for each map can be viewed by clicking on the image.

Conservative Party Liberal Democrats
Cambridgeshire UK local election 2005 Con strength.svg Cambridgeshire UK local election 2005 LD strength.svg
Labour Party Green Party
Cambridgeshire UK local election 2005 Lab strength.svg Cambridgeshire UK local election 2005 Green strength.svg

Results by electoral division

Cambridge (14 seats)

Abbey electoral division
PartyCandidateVotes%±
Labour Co-op Paul Sales1,38439.9N/A
Liberal Democrat Edward Thomas Sexton1,03329.8N/A
Conservative Simon Anthony Mitton63118.2N/A
Green Margaret Elizabeth Wright41612.0N/A
Turnout 55.5
Labour Co-op win (new seat)
Arbury electoral division
PartyCandidateVotes%±
Liberal Democrat Rupert William George Moss-Eccardt1,68641.0N/A
Labour Co-op Ian Charles Kidman1,38633.7N/A
Conservative Shapour Meftah74318.1N/A
Green Michael Smith2957.2N/A
Turnout 60.6
Liberal Democrat win (new seat)
Castle electoral division
PartyCandidateVotes%±
Liberal Democrat John David Cyril White2,13252.2N/A
Conservative Robert William Boorman76718.8N/A
Labour Jane Jacks73317.9N/A
Green Stephen Roger Lawrence45111.1N/A
Turnout 62.6
Liberal Democrat win (new seat)
Cherry Hinton electoral division
PartyCandidateVotes%±
Labour Christine Margaret Carter1,63340.5N/A
Liberal Democrat Benjamin William Hutchings1,10527.4N/A
Conservative Edward Alexander MacNaghten1,05426.2N/A
Green Neil Alan Ford2375.9N/A
Turnout 64.0
Labour win (new seat)
Coleridge electoral division
PartyCandidateVotes%±
Labour Martin Ballard1,25535.9N/A
Liberal Democrat Andrew Blackhurst1,20334.4N/A
Conservative Steve Alexander Jones71820.6N/A
Green Marilyn Carter2416.9N/A
UKIP Albert Charles Watts772.2N/A
Turnout 59.9
Labour win (new seat)
East Chesterton electoral division
PartyCandidateVotes%±
Liberal Democrat Julian Leon Huppert 1,41139.2N/A
Labour Janet Robertson1,18732.9N/A
Conservative Kevin Andre Francis69419.3N/A
Green Peter Harry Pope3068.5N/A
Turnout 60.8
Liberal Democrat win (new seat)
King's Hedges electoral division
PartyCandidateVotes%±
Labour Primrose Elizabeth Hughes1,22836.9N/A
Liberal Democrat Clive Hollins1,12933.9N/A
Conservative Rhona Corinne Boorman72821.9N/A
Green Gerhard Ernst Goldbeck-Wood2437.3N/A
Turnout 55.2
Labour win (new seat)
Market electoral division
PartyCandidateVotes%±
Liberal Democrat Gaynor Victoria Griffiths1,87750.1N/A
Conservative Timothy James Haire66517.8N/A
Labour Elizabeth Walter61016.3N/A
Green Martin Vaughan Lucas-Smith59215.8N/A
Turnout 57.5
Liberal Democrat win (new seat)
Newnham electoral division
PartyCandidateVotes%±
Liberal Democrat Alexander Arthur Luttrell Reid1,97850.7N/A
Conservative Alasdair Ewen Ross70318.0N/A
Labour Rita Rosemary Gaggs67117.2N/A
Green Anna Serena Gomori-Woodcock55314.2N/A
Turnout 62.1
Liberal Democrat win (new seat)
Petersfield electoral division
PartyCandidateVotes%±
Liberal Democrat Nichola Jane Harrison1,35640.4N/A
Labour Lucy Ann Sheerman1,05231.3N/A
Green John Collins52715.7N/A
Conservative Rosemary Anne Clarkson42612.7N/A
Turnout 54.8
Liberal Democrat win (new seat)
Queen Edith's electoral division
PartyCandidateVotes%±
Liberal Democrat Geoffrey John Heathcock2,39259.2N/A
Conservative Andre Beaumont84821.0N/A
Labour Co-op Leonard Arthur Freeman57414.2N/A
Green Shayne Mary Mitchell2255.6N/A
Turnout 63.0
Liberal Democrat win (new seat)
Romsey electoral division
PartyCandidateVotes%±
Liberal Democrat Joanna Toomey1,66844.9N/A
Labour Co-op Jozef Lawrence Gluza1,23533.3N/A
Green Hamish Downer40210.8N/A
Conservative Mark Patrick Fanken-Hall3599.7N/A
UKIP Marjorie Ruth Hadley Barr451.2N/A
Turnout 59.1
Liberal Democrat win (new seat)
Trumpington electoral division
PartyCandidateVotes%±
Liberal Democrat Anne Christine Kent1,66950.9N/A
Conservative John Ionides90427.6N/A
Labour Co-op George Samuel Tudor43513.3N/A
Green Ceri Barbara Galloway2668.1N/A
Turnout 61.1
Liberal Democrat win (new seat)
West Chesterton electoral division
PartyCandidateVotes%±
Liberal Democrat Kevin Wilkins1,86946.7N/A
Labour Simon Richard Ainsley Watkins96424.1N/A
Conservative James Andrew Strachan69917.5N/A
Green Sarah Peake46811.7N/A
Turnout 62.8
Liberal Democrat win (new seat)

East Cambridgeshire (9 seats)

Burwell electoral division
PartyCandidateVotes%±
Liberal Democrat Hazel Williams2,22055.9N/A
Conservative Lavinia Rebecca Edwards1,74944.1N/A
Turnout 64.4
Liberal Democrat win (new seat)
Ely North and East electoral division
PartyCandidateVotes%±
Liberal Democrat Nigel Charles Bell2,58959.6N/A
Conservative Victoria Angela Hearne-Casapieri1,75440.4N/A
Turnout 60.2
Liberal Democrat win (new seat)
Ely South and West electoral division
PartyCandidateVotes%±
Liberal Democrat Linda Jane Crossley2,12356.2N/A
Conservative Andrew Roderick Mair1,65643.8N/A
Turnout 64.7
Liberal Democrat win (new seat)
Haddenham electoral division
PartyCandidateVotes%±
Conservative William Thomas Ian Hunt1,99441.3N/A
Liberal Democrat Gareth Laurence Philip Wilson1,78937.1N/A
Labour Michele Wilkinson71014.7N/A
Green Astra Patricia Carter-Marsh3366.9N/A
Turnout 66.8
Conservative win (new seat)
Littleport electoral division
PartyCandidateVotes%±
Liberal Democrat Brenda Miriam Bean1,59955.2N/A
Conservative Frederick John William Brown1,29944.8N/A
Turnout 51.9
Liberal Democrat win (new seat)
Soham and Fordham Villages electoral division
PartyCandidateVotes%±
Liberal Democrat Judith Broadway3,38027.9N/A
Conservative John Albert Powley3,03925.1N/A
Liberal Democrat Michael William Allan2,87223.7N/A
Conservative Jacqueline Petts2,83723.4N/A
Turnout 50.6
Liberal Democrat win (new seat)
Conservative win (new seat)
Sutton electoral division
PartyCandidateVotes%±
Liberal Democrat Philip David Bailey2,12256.8N/A
Conservative Philip Anderson Edmund Read1,61743.3N/A
Turnout 63.2
Liberal Democrat win (new seat)
Woodditton electoral division
PartyCandidateVotes%±
Conservative Mathew Gauntlett Shuter2,47649.7N/A
Liberal Democrat Beate (Sisse) McCall1,64433.0N/A
Labour Steven John O'Dell85917.3N/A
Turnout 65.2
Conservative win (new seat)

Fenland (11 seats)

Chatteris electoral division
PartyCandidateVotes%±
Conservative Alan Keith Melton1,60446.0N/A
Liberal Democrat David Neale Upstone95527.4N/A
Labour Susan Margaret Coomey92626.6N/A
Turnout 62.1
Conservative win (new seat)
Forty Foot electoral division
PartyCandidateVotes%±
Conservative Geoffrey Farrar Harper2,11452.6N/A
Labour Grant Charles Osbourn1,14228.4N/A
Liberal Democrat Evelyn Vernon Bradford76519.0N/A
Turnout 62.9
Conservative win (new seat)
March East electoral division
PartyCandidateVotes%±
Conservative Frederick Hartley Yeulett1,62344.5N/A
Labour Karon Andree Webb1,19032.6N/A
Liberal Democrat Michael Hal Pitt55115.1N/A
Green Christopher John Bennett2877.9N/A
Turnout 60.9
Conservative win (new seat)
March North electoral division
PartyCandidateVotes%±
Conservative John Frederick West1,49752.1N/A
Liberal Democrat Edna Howarth1,37847.9N/A
Turnout 57.5
Conservative win (new seat)
March West electoral division
PartyCandidateVotes%±
Conservative Michael Kirby Ogden2,10557.6N/A
Liberal Democrat Simon Michael Rodgers1,54942.4N/A
Turnout 61.5
Conservative win (new seat)
Roman Bank and Peckover electoral division
PartyCandidateVotes%±
Conservative Brian Hardy2,29459.1N/A
Liberal Democrat Toby Fisher1,59140.9N/A
Turnout 57.9
Conservative win (new seat)
Waldersey electoral division
PartyCandidateVotes%±
Conservative Jillian Mary Tuck2,16458.8N/A
Liberal Democrat Shirley Fieldhouse1,51741.2N/A
Turnout 57.7
Conservative win (new seat)
Whittlesey North electoral division
PartyCandidateVotes%±
Conservative Martin John Curtis2,01452.5N/A
Labour Richard Jeremy Hibbert1,34134.9N/A
Liberal Democrat Malcolm Philip Schofield48312.6N/A
Turnout 62.7
Conservative win (new seat)
Whittlesey South electoral division
PartyCandidateVotes%±
Conservative Thomas Ralph Butcher2,29157.9N/A
Labour Mark William Goffrey1,08227.3N/A
Liberal Democrat Thomas Spencer Yates58514.8N/A
Turnout 61.6
Conservative win (new seat)
Wisbech North electoral division
PartyCandidateVotes%±
Conservative Leslie Sims1,58547.0N/A
Labour Kevin Roy Goddard1,18435.1N/A
Liberal Democrat Anthony William Morris60217.9N/A
Turnout 48.2
Conservative win (new seat)
Wisbech South electoral division
PartyCandidateVotes%±
Conservative Simon John Edward King1,94153.7N/A
Liberal Democrat Louis Jerome Rodrigues1,08429.9N/A
UKIP Paul Sydney Clapp59216.4N/A
Turnout 51.0
Conservative win (new seat)

Huntingdonshire (19 seats)

Brampton and Kimbolton electoral division
PartyCandidateVotes%±
Liberal Democrat Peter James Downes2,56348.3N/A
Conservative Ian Derek Gardner2,28542.1N/A
Labour Robert Kenneth Pugh4608.7N/A
Turnout 73.7
Liberal Democrat win (new seat)
Buckden, Gransden and The Offords electoral division
PartyCandidateVotes%±
Conservative Barbara Elizabeth Boddington2,09247.6N/A
Liberal Democrat William Terence Clough1,27729.1N/A
Independent Alec Baynton Stenner57913.2N/A
Labour David Robert Nicholls44210.1N/A
Turnout 72.1
Conservative win (new seat)
Godmanchester electoral division
PartyCandidateVotes%±
Conservative Jeffery John Dutton3,11423.9N/A
Conservative Colin Richard Hyams2,84721.9N/A
Liberal Democrat Peter Ronald Fleming2,39718.4N/A
Liberal Democrat Michael Frederick Shellens2,04715.7N/A
Labour William Francis Hennessey1,30110.0N/A
Labour David Michael Brown1,2989.9N/A
Turnout 57.5
Conservative win (new seat)
Huntingdon electoral division
PartyCandidateVotes%±
Conservative Peter Randolph Brown2,83025.9N/A
Conservative Elaine Victoria Kadic2,35221.5N/A
Liberal Democrat Michael Philip Burrell1,37512.6N/A
Labour Ann Elizabeth Beevor1,33012.2N/A
Liberal Democrat Ann Monk1,22711.2N/A
Labour David Mitchell King1,11910.2N/A
UKIP Leonard Bruce3763.4N/A
UKIP Andrew David Manning3262.9N/A
Turnout 52.1
Conservative win (new seat)
Little Paxton and St Neots North electoral division
PartyCandidateVotes%±
Conservative David Harty3,59825.9N/A
Conservative Sharon Rosemary Lee3,34224.1N/A
Liberal Democrat Robert William Joseph Eaton2,38817.2N/A
Liberal Democrat Gordon Sydney Edward Thorpe2,01714.6N/A
Labour Janet Boston1,2729.2N/A
Labour Patricia Anne Nicholls1,2408.9N/A
Turnout 55.9
Conservative win (new seat)
Norman Cross electoral division
PartyCandidateVotes%±
Conservative Lawrence Walter McGuire3,45426.2N/A
Conservative William George Martin Hensley3,10823.6N/A
Labour Margaret Cochrane2,00915.2N/A
Liberal Democrat John Robert Davidson1,72713.1N/A
Labour Graeme Leslie Watkins1,57311.9N/A
Liberal Democrat Janet Siobhan Nevin Dutton1,32810.1N/A
Turnout 54.8
Conservative win (new seat)
Ramsey electoral division
PartyCandidateVotes%±
Conservative Susan Bridget Normington1,73746.3N/A
Liberal Democrat Raymond Powell1,41237.6N/A
Labour Carol Ann Harper60316.1N/A
Turnout 58.9
Conservative win (new seat)
Sawtry and Ellington electoral division
PartyCandidateVotes%±
Conservative John Keith Walters2,89858.1N/A
Liberal Democrat Martin Graham Land1,24424.9N/A
Labour Mary Theresa Howell84616.9N/A
Turnout 67.9
Conservative win (new seat)
Somersham and Earith electoral division
PartyCandidateVotes%±
Conservative John Ackerly Penhall Eddy2,38649.2N/A
Liberal Democrat Anthony Bell Hulme1,81437.4N/A
Labour Mark George Harry Holman64913.38N/A
Turnout 66.5
Conservative win (new seat)
St Ives electoral division
PartyCandidateVotes%±
Conservative Kevin Antony Reynolds3,74723.8N/A
Conservative Dennis Roy Pegram3,22920.5N/A
Liberal Democrat David Frederick Hodge2,69117.1N/A
Liberal Democrat Gillian Ann Jackson2,47115.7N/A
Labour Richard John Allen1,3688.7N/A
Labour Angela Louise Richards1,1917.6N/A
Independent Stuart Frederick Littlewood1,0466.7N/A
Turnout 55.5
Conservative win (new seat)
St Neots Eaton Socon electoral division
PartyCandidateVotes%±
Liberal Democrat Sandra Anne Giles2,40520.8N/A
Conservative Rodney Samuel Farrer2,29319.9N/A
Liberal Democrat Ian Pele Taylor2,05517.8N/A
Conservative Paul Keith Ursell1,93516.8N/A
Labour Anthony Jude Gregory1,52413.2N/A
Labour William Francis O'Connor1,33711.6N/A
Turnout 50.6
Liberal Democrat win (new seat)
Conservative win (new seat)
The Hemingfords and Fenstanton electoral division
PartyCandidateVotes%±
Conservative Ian Cyril Bates2,59852.8N/A
Liberal Democrat Mark George Rainer1,65733.7N/A
Labour John Philip Watson66213.5N/A
Turnout 69.8
Conservative win (new seat)
Warboys and Upwood electoral division
PartyCandidateVotes%±
Conservative Victor Harold Lucas2,54455.4N/A
Liberal Democrat John Michael Souter1,48932.4N/A
Labour Steven Hicks56312.3N/A
Turnout 64.6
Conservative win (new seat)

South Cambridgeshire (16 seats)

Bar Hill electoral division
PartyCandidateVotes%±
Conservative John Edward Reynolds2,26645.8N/A
Liberal Democrat Thomas Joseph Flanagan1,80836.6N/A
Labour John Samuel Shepherd87017.6N/A
Turnout 69.5
Conservative win (new seat)
Bassingbourn electoral division
PartyCandidateVotes%±
Conservative Linda Joan Oliver1,98154.4N/A
Liberal Democrat Ashley Woodford98226.9N/A
Green Simon Peter Saggers67918.6N/A
Turnout 67.3
Conservative win (new seat)
Bourn electoral division
PartyCandidateVotes%±
Conservative Lister John Wilson1,12545.3N/A
Liberal Democrat Jonathan Rolf Hansford80732.5N/A
Labour Mark David Hurn40616.4N/A
Green Pauline Radley1435.8N/A
Turnout 68.8
Conservative win (new seat)
Cottenham, Histon and Impington electoral division
PartyCandidateVotes%±
Conservative Matthew Bradney3,26921.3N/A
Liberal Democrat John David Jenkins3,21320.9N/A
Conservative Peter Cecil Henry Hudson2,71717.7N/A
Liberal Democrat Linden Mary Leeke2,37715.5N/A
Labour Helen Patricia Wright1,4539.5N/A
Labour Aidan Romaine Hervey1,3578.9N/A
Green Mark Johan Alexander Claessen9496.2N/A
Turnout 61.7
Conservative win (new seat)
Liberal Democrat win (new seat)
Duxford electoral division
PartyCandidateVotes%±
Liberal Democrat Timothy James Stone2,14043.9N/A
Conservative Robin Driver2,10043.1N/A
Labour Alexandra Mayer63413.0N/A
Turnout 72.9
Liberal Democrat win (new seat)
Fulbourn electoral division
PartyCandidateVotes%±
Conservative Robert John Turner2,01043.2N/A
Liberal Democrat Frances Aisha Roberts Amrani1,93941.7N/A
Green Mary Anne Lawson70515.2N/A
Turnout 61.1
Conservative win (new seat)
Gamlingay electoral division
PartyCandidateVotes%±
Liberal Democrat Sebastian Gerald Molesworth Kindersley2,54145.1N/A
Conservative Josephine Percy2,08436.9N/A
Labour Mirian Lynn66311.8N/A
Green Stephen Roy Edmondson3476.2N/A
Turnout 72.8
Liberal Democrat win (new seat)
Hardwick electoral division
PartyCandidateVotes%±
Conservative Denzil John Baldwin2,16841.3N/A
Liberal Democrat Livia Medb Mitson1,85535.4N/A
Labour John Kazer78614.9N/A
Green William Michael Connolley4388.4N/A
Turnout 71.8
Conservative win (new seat)
Linton electoral division
PartyCandidateVotes%±
Liberal Democrat John Dennis Batchelor2,29843.7N/A
Conservative Peter Norman Hase2,02338.5N/A
Labour Michael Gale69613.2N/A
Green William John Quinn2404.6N/A
Turnout 72.8
Liberal Democrat win (new seat)
Melbourn electoral division
PartyCandidateVotes%±
Conservative David Charles McCraith2,08342.1N/A
Liberal Democrat Anthony Stuart Milton1,85437.4N/A
Labour Donald John McCallum73514.8N/A
Green Sally A S Nichols2815.7N/A
Turnout 70.5
Conservative win (new seat)
Papworth and Swavesey electoral division
PartyCandidateVotes%±
Conservative Mandy Lorraine Smith2,03352.5N/A
Liberal Democrat Robin Barry Martlew1,84047.5N/A
Turnout 67.9
Conservative win (new seat)
Sawston electoral division
PartyCandidateVotes%±
Conservative Christine Gail Kenney3,27020.2N/A
Conservative Anthony Geoffrey Orgee3,22519.9N/A
Liberal Democrat Max Arnold Parke Campbell2,91517.9N/A
Liberal Democrat David Terrance Ford2,82917.5N/A
Labour Ronald Hornby1,5779.7N/A
Labour Pamela Mary Stacey1,5219.4N/A
Green Jacquelyn Jean Garfit8775.4N/A
Turnout 61.8
Conservative win (new seat)
Waterbeach electoral division
PartyCandidateVotes%±
Liberal Democrat Robert Michael Williamson2,82061.2N/A
Conservative Gerda Ann Covell1,78938.8N/A
Turnout 63.4
Liberal Democrat win (new seat)
Willingham electoral division
PartyCandidateVotes%±
Conservative Shona Fay Johnstone2,01146.7N/A
Liberal Democrat Rebecca Anne Mead1,82542.3N/A
Green Marion Eva Barber47511.0N/A
Turnout 65.8
Conservative win (new seat)

Related Research Articles

Cambridgeshire County Council elections

Cambridgeshire County Council is elected every four years by the first past the post system of election. The council currently consists of 69 councillors, representing 60 electoral divisions. The Conservative Party is currently the largest party on the council, having lost overall control in the 2013 local elections. The council meets at Shire Hall in Cambridge, on the site of Cambridge Castle's bailey and a 19th-century prison.

Peterborough City Council council for Peterborough

Peterborough City Council is the local authority for Peterborough in the East of England. It is a unitary authority, having the powers of a non-metropolitan county and district council combined. The City was incorporated as a municipal borough in 1874; from 1888, it fell within the jurisdiction of the Soke of Peterborough county council and from 1965, Huntingdon and Peterborough county council. In 1974, it was replaced by a wholly new non-metropolitan district, broadly corresponding to the Soke, in the new enlarged Cambridgeshire. In 1998, Peterborough became independent of Cambridgeshire as a unitary authority, but the city continues to form part of that county for ceremonial purposes as defined by the Lieutenancies Act 1997.

2009 Suffolk County Council election

Elections to Suffolk County Council were held on 4 June 2009 as part of the 2009 United Kingdom local elections on the same day as the elections to the European Parliament. 75 councillors were elected from 63 electoral divisions, which returned either one or two county councillors each by first-past-the-post voting for a four-year term of office. The electoral divisions were the same as those used at the previous election in 2004.

2009 Cambridgeshire County Council election

An election to Cambridgeshire County Council took place on 4 June 2009 as part of the United Kingdom local elections, 2009. The election was delayed from 7 May to coincide with elections to the European Parliament. 69 councillors were elected from 60 electoral divisions, which returned either one or two county councillors each by first-past-the-post voting. The Conservative Party retained their majority on the council, while the Green Party and UKIP gained their first seats.

2009 Essex County Council election

An election to Essex County Council took place on 4 June 2009 as part of the United Kingdom local elections, 2009. The elections had been delayed from 7 May, to coincide with elections to the European Parliament. 75 councillors were elected from various electoral divisions, which returned either one or two county councillors each by first-past-the-post voting for a four-year term of office. The electoral divisions were the same as those used at the previous election in 2005.

2009 Hampshire County Council election

An election to Hampshire County Council took place on 4 June 2009 as part of the United Kingdom local elections, 2009, having been delayed from 7 May, to coincide with elections to the European Parliament. 78 councillors were elected from 75 electoral divisions, which returned either one or two county councillors each by first-past-the-post voting for a four-year term of office. The electoral divisions were the same as those used at the previous election in 2005. Elections in Portsmouth and Southampton do not coincide with this set, being unitary authorities outside the area covered by the County Council.

2009 Oxfordshire County Council election

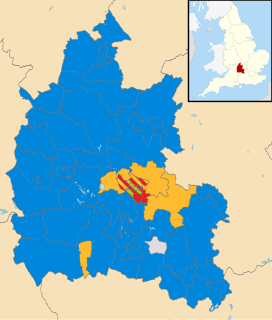
An election to Oxfordshire County Council took place on 4 June 2009 as part of the United Kingdom local elections, 2009, having been delayed from 7 May, to coincide with elections to the European Parliament. 73 councillors were elected from various electoral divisions, which returned either one, two or three county councillors each by first-past-the-post voting for a four-year term of office. The electoral divisions were the same as those used at the previous election in 2005.

2009 Staffordshire County Council election

Elections to Staffordshire County Council took place on 4 June 2009 as part of the United Kingdom local elections, 2009, having been delayed from 7 May, in order to coincide with elections to the European Parliament. 62 councillors were elected from the various electoral divisions, which returned either one or two county councillors each by first-past-the-post voting for a four-year term of office. The electoral divisions were the same as those used at the previous election in 2005. The council continues to be administered on the Leader and Cabinet model.

2013 North Yorkshire County Council election

An election to North Yorkshire County Council took place on 2 May 2013 as part of the United Kingdom local elections, 2013. 72 councillors were elected from 68 electoral divisions, which returned either one or two county councillors each by first-past-the-post voting for a four-year term of office. The four divisions which elected two members were Harrogate Bilton & Nidd Gorge, Harrogate Central, Knaresborough, and Selby Barlby. The electoral divisions were the same as those used at the previous election in 2009. The election saw the Conservative Party maintain overall control of the council.

2013 Cumbria County Council election

An election to Cumbria County Council took place on 2 May013 as part of the United Kingdom local elections, 2013. All 84 councillors were elected from electoral divisions which returned one county councillor each by first-past-the-post voting for a four-year term of office. Following an electoral review carried out by the Local Government Boundary Commission for England, newly drawn electoral divisions were used without change in the number of county councillors.

2013 Leicestershire County Council election

An election to Leicestershire County Council took place on 2 May 2013 as part of the United Kingdom local elections, 2013. 55 councillors were elected from 52 electoral divisions, which returned either one or two county councillors each by first-past-the-post voting for a four-year term of office. The Conservatives held control of the council with a reduced majority of 5 seats. Despite a strong challenge from UKIP, the party only gained 2 seats whilst the Liberal Democrats lost one seat and Labour recouped some of their 2009 losses, gaining 6 seats.

2013 Hampshire County Council election

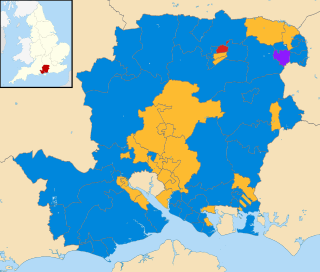
An election to Hampshire County Council took place on 2 May 2013 as part of the United Kingdom local elections, 2013. 78 councillors were elected from 75 electoral divisions, which returned either one or two county councillors each by first-past-the-post voting for a four-year term of office. The electoral divisions were the same as those of the previous election in 2009. No elections were held in Portsmouth and Southampton, which are unitary authorities outside the area covered by the County Council. The election saw the Conservative Party retain overall control of the council, with a reduced majority of five councillors.

2013 Cambridgeshire County Council election

An election to Cambridgeshire County Council took place on 2 May 2013 as part of the United Kingdom local elections, 2013. 69 councillors were elected from 60 electoral divisions, which returned either one or two county councillors each by first-past-the-post voting for a four-year term of office. The electoral divisions were the same as those used at the previous election in 2009. No elections were held in Peterborough, which is a unitary authority outside the area covered by the County Council. The election saw the Conservative Party lose overall control of the council.

2013 Durham County Council election

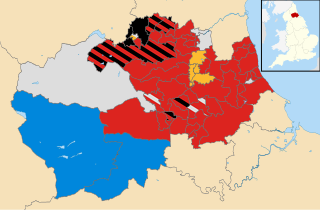
An election to Durham County Council took place on 2 May 2013 as part of the United Kingdom local elections, 2013. Following a boundary review, 126 councillors were elected from 63 electoral divisions which returned either one, two or three councillors each by first-past-the-post voting for a four-year term of office. The previous election took place in 2008 in advance of the council becoming a unitary authority after the 2009 changes to local government. The election saw the Labour Party increase their majority on the council.

2013 Hertfordshire County Council election

An election to Hertfordshire County Council took place on 2 May 2013 as part of the United Kingdom local elections, 2013. 77 electoral divisions elected one county councillor each by first-past-the-post voting for a four-year term of office. The electoral divisions were the same as those used at the previous election in 2009.

2013 Essex County Council election

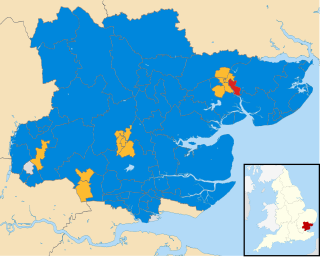
An election to Essex County Council took place on 2 May 2013 as part of the United Kingdom local elections, 2013. 75 councillors were elected from 70 electoral divisions, which returned either one or two county councillors each by first-past-the-post voting for a four-year term of office. The electoral divisions were the same as those used at the previous election in 2009. No elections were held in Thurrock or Southend-on-Sea, which are unitary authorities outside the area covered by the County Council.

2013 Staffordshire County Council election

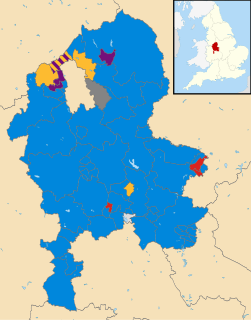
An election to Staffordshire County Council took place on 2 May 2013 as part of the United Kingdom local elections, 2013. 62 electoral divisions returned one county councillor each by first-past-the-post voting for a four-year term of office. Following a boundary review, new electoral division boundaries were established for this election. No elections were held in Stoke-on-Trent, which is a unitary authority outside the area covered by the County Council. The council continues to be administered on the Leader and Cabinet model.

2013 Suffolk County Council election

Elections to Suffolk County Council took place on 2 May 2013 as part of the United Kingdom local elections, 2013. 75 councillors were elected from 63 electoral divisions, which returned either one or two county councillors each by first-past-the-post voting for a four-year term of office. The electoral divisions were the same as those used at the previous election in 2009.

2017 Derbyshire County Council election

An election to Derbyshire County Council took place on 4 May 2017 as part of the United Kingdom local elections, 2017. 64 councillors were elected from 61 electoral divisions which returned either one or two county councillors each by first-past-the-post voting for a four-year term of office. No elections were held in the City of Derby, which is a unitary authority outside the area covered by the County Council. The Conservative Party won back control of the council, taking thirty-seven of the authority's sixty-four seats.

2017 Cambridgeshire County Council election

The 2017 Cambridgeshire County Council election was held on 4 May 2017 as part of the 2017 local elections in the United Kingdom. All 61 councillors were elected from 59 electoral divisions, which returned either one or two county councillors each by first-past-the-post voting for a four-year term of office.

References

  1. "Election results and information for 2005". Cambridgeshire County Council. Archived from the original on 12 June 2012. Retrieved 18 April 2012.
  2. "Local election results: Cambridgeshire". BBC News. Retrieved 2012-04-18.
  3. "Cambridgeshire". Andrew Teale. Retrieved 2012-04-18.