Cambridgeshire County Council election, 2013

Last updated

Cambridgeshire County Council election, 2013
Flag of England.svg
  2009 2 May 2013 2017  

All 69 seats to Cambridgeshire County Council
35 seats needed for a majority
 First partySecond party
 
Party Conservative Liberal Democrat
Seats won3214
Seat changeDecrease2.svg10Decrease2.svg9

 Third partyFourth party
 
Party UKIP Labour
Seats won127
Seat changeIncrease2.svg11Increase2.svg5

Cambridgeshire UK local election 2013 map.svg
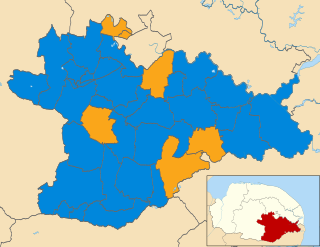
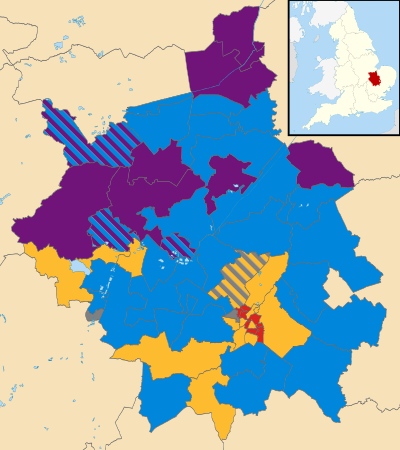
Map showing the results of the 2013 Cambridgeshire County Council elections.

Council control before election

Conservative

Council control after election

No Overall Control

An election to Cambridgeshire County Council took place on 2 May 2013 as part of the United Kingdom local elections, 2013. [1] 69 councillors were elected from 60 electoral divisions, which returned either one or two county councillors each by first-past-the-post voting for a four-year term of office. The electoral divisions were the same as those used at the previous election in 2009. No elections were held in Peterborough, which is a unitary authority outside the area covered by the County Council. The election saw the Conservative Party lose overall control of the council. [2]

Cambridgeshire County Council British administrative body

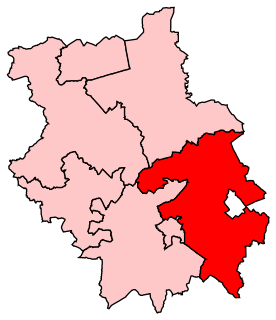
Cambridgeshire County Council is the county council of Cambridgeshire, England. The council consists of 61 councillors, representing 59 electoral divisions. The Conservative Party took control of the council at the 2017 election after four years of no party having overall control. The council meets at Shire Hall in Cambridge. It is a member of the East of England Local Government Association.

First-past-the-post voting voting system in which voters select one candidate, and the candidate who receives more votes than any other candidate wins

A first-past-the-post electoral system is one in which voters indicate on a ballot the candidate of their choice, and the candidate who receives the most votes wins. This is sometimes described as winner takes all. First-past-the-post voting is a plurality voting method. FPTP is a common, but not universal, feature of electoral systems with single-member electoral divisions, and is practiced in close to one third of countries. Notable examples include Canada, India, the United Kingdom, and the United States, as well as most of their current or former colonies and protectorates.

Contents

All locally registered electors (British, Irish, Commonwealth and European Union citizens) who were aged 18 or over on Thursday 2 May 2013 were entitled to vote in the local elections. Those who were temporarily away from their ordinary address (for example, away working, on holiday, in student accommodation or in hospital) were also entitled to vote in the local elections, [3] although those who had moved abroad and registered as overseas electors cannot vote in the local elections. It is possible to register to vote at more than one address (such as a university student who had a term-time address and lives at home during holidays) at the discretion of the local Electoral Register Office, but it remains an offence to vote more than once in the same local government election. [4]

In general, a Commonwealth citizen is a citizen of a member state of the Commonwealth of Nations. This designation is given legal effect in the nationality laws of some Commonwealth countries, and Commonwealth citizens may enjoy some privileges in the United Kingdom and, less commonly, other member states. Each Commonwealth country determines what special rights, if any, are accorded to citizens of other Commonwealth countries. The status is most significant in British law and has little effect in many other Commonwealth countries, such as Canada.

European Union Economic and poitical union of states located in Europe

The European Union (EU) is a political and economic union of 28 member states that are located primarily in Europe. It has an area of 4,475,757 km2 (1,728,099 sq mi) and an estimated population of about 513 million. The EU has developed an internal single market through a standardised system of laws that apply in all member states in those matters, and only those matters, where members have agreed to act as one. EU policies aim to ensure the free movement of people, goods, services and capital within the internal market, enact legislation in justice and home affairs and maintain common policies on trade, agriculture, fisheries and regional development. For travel within the Schengen Area, passport controls have been abolished. A monetary union was established in 1999 and came into full force in 2002 and is composed of 19 EU member states which use the euro currency.

Summary

In total 292 candidates stood in the election. Only the Labour Party and the Conservative Party contested all 69 seats on the council. The Liberal Democrats stood 61 candidates, not standing in four divisions in Fenland and only contesting one seat in some two-member divisions. The United Kingdom Independence Party stood 52 candidates, including a full slate in Huntingdonshire, although two nominated candidates in Fenland withdrew before the deadline and did not appear on the ballot. [5] The Green Party stood 25 candidates, mostly in Cambridge and South Cambridgeshire. The English Democrats stood two candidates in Whittlesey, while the Trade Unionist and Socialist Coalition stood two candidates in the Godmanchester & Huntingdon East division. The Official Monster Raving Loony Party stood two candidates in St Ives and in Bar Hill divisions, and one candidate stood for the Cambridge Socialists in Romsey. There were also nine independent candidates.

The Labour Party is a centre-left political party in the United Kingdom which has been described as an alliance of social democrats, democratic socialists and trade unionists. The party's platform emphasises greater state intervention, social justice and strengthening workers' rights.

Liberal Democrats (UK) Political party in the United Kingdom

The Liberal Democrats are a liberal political party in the United Kingdom. They presently have 11 Members of Parliament in the House of Commons, 96 members of the House of Lords, and one member of the European Parliament. They also have five Members of the Scottish Parliament and a member each in the Welsh Assembly and London Assembly. The party reached the height of its influence in the early 2010s, forming a junior partner in a coalition government from 2010 to 2015. It is presently led by Vince Cable.

Fenland District Non-metropolitan district in England

Fenland is a local government district in Cambridgeshire, England. Its council is based in March, and it covers the neighbouring market towns of Chatteris, Whittlesey and Wisbech; the last is often called the "capital of the fens".

The United Kingdom Independence Party made substantial gains, taking 11 seats from the Conservatives mostly in Fenland and northern Huntingdonshire. Southern Huntingdonshire saw the Conservatives lose a seat to the Liberal Democrats in the Godmanchester & Huntingdon East division, as well as two seats to independents in the St Neots Eaton Socon & Eynesbury division. The Labour Party gained seats in Cambridge from the Liberal Democrats and the Green Party, including Arbury which Labour had won in a 2011 by-election, winning half of the city's 14 county council divisions. [6] In East Cambridgeshire, the Conservatives gained both divisions in Ely from the Liberal Democrats but lost Littleport to UKIP. In South Cambridgeshire, Conservative council leader Nick Clarke lost his seat in Fulbourn to the Liberal Democrats. The Liberal Democrats however lost four other seats in the district including in Linton, where the Conservative candidate won by a single vote.

St Neots town in Cambridgeshire, England

St Neots is a town and civil parish in the non-metropolitan county of Cambridgeshire, England, within the historic county of Huntingdonshire, next to the Bedfordshire county border. It lies on the banks of the River Great Ouse in the Huntingdonshire District, 15 miles (24 km) west of Cambridge and 50 miles (80 km) north of central London. St Neots is the largest town in Cambridgeshire with a population of approximately 40,000 in 2014. The town is named after the Cornish monk Saint Neot, whose bones were subject to translation from the hamlet of St Neot on Bodmin Moor on consecration of the Priory of St Neots circa 980.

Eaton Socon village in the United Kingdom

Eaton Socon is a district of St Neots in Cambridgeshire, England. It was originally a village in Bedfordshire, along with the neighbouring village of Eaton Ford, but officially became part of the town in 1965. Eaton Socon changed relatively little until this time, but on its inclusion into Cambridgeshire a significant amount of development took place to the west of the village into the 1980s, with areas covering Monarch Road and the upper end of Nelson Road being developed in a particularly short space of time. The population of Eaton Socon is around 5000 people.

Eynesbury, Cambridgeshire village in United Kingdom

Eynesbury is a settlement in Cambridgeshire, England. Eynesbury forms part of present-day St Neots, but before 1876 was a separate village. It is situated within Huntingdonshire which is a non-metropolitan district of Cambridgeshire as well as being a historic county of England.

Aftermath

The Conservatives will continue to run the council however they will do so in a minority, with Whittlesey councillor Martin Curtis as council leader. [7] In addition the council structure will switch from a cabinet system to a committee system, starting from May 2014. [8]

Whittlesey Fenland market town in Cambridgeshire in England

Whittlesey is an English market town 6 miles (10 km) east of Peterborough in the Fenland district of Cambridgeshire. Including the neighbouring villages of Coates, Eastrea, Pondersbridge and Turves, it had a population of 16,058 at the 2011 Census.

Results summary

Cambridgeshire County Council election, 2013 [9] [10]
PartySeatsGainsLossesNet gain/lossSeats %Votes %Votes+/−
  Conservative 32515104633.659,12912.0%
  Liberal Democrat 1421192019.734,58814.0%
  UKIP 12110+111721.137,132+17.8%
  Labour 750+51017.430,632 [lower-alpha 1] +8.3%
  Independent 440+464.27,354+2.0%
  Green 001103.35,8731.6%
  English Democrat 000000.3584n/a
  Monster Raving Loony 000000.12250.2%
  TUSC 000000.1148n/a
  Cambridge Socialists 000000.1118n/a

Results by District

Cambridge (14 seats)

Abbey [11] [12]
PartyCandidateVotes%±
Labour Joan Whitehead92653.4+24.1
Green Brett Hughes32118.522.1
Conservative David Smith29617.10.1
Liberal Democrat Christopher Brown19211.11.9
Turnout 1,75126.1
Labour gain from Green Swing
Arbury [11] [12]
PartyCandidateVotes%±
Labour Paul Sales94749.4+20.4
Liberal Democrat Daniel Levy33116.825.2
UKIP Hugh Mennie24612.5n/a
Conservative Ali Meftah22611.54.3
Green Stephen Lawrence1959.93.3
Turnout 1,97729.0
Labour gain from Liberal Democrat Swing
Castle [11] [12]
PartyCandidateVotes%±
Independent John Hipkin78141.0+11.2
Liberal Democrat Belinda Brooks-Gordon62032.610.5
Labour Edward Browne31716.7+8.9
Conservative Richard Jeffs1095.74.8
UKIP Nicholas Wilson764.0n/a
Turnout 1,91229.8
Independent gain from Liberal Democrat Swing
Cherry Hinton [11] [12]
PartyCandidateVotes%±
Labour Sandra Crawford1,15058.5+16.3
Conservative Timothy Haire45322.98.5
Green Megan Parry21410.82.4
Liberal Democrat William Barter1557.85.4
Turnout 1,99831.4
Labour hold Swing
Coleridge [11] [12]
PartyCandidateVotes%±
Labour Noel Kavanagh1,07153.9+17.6
Conservative Sam Barker34717.514.9
UKIP Bill Kaminski27213.7+7.5
Green Shaun Esgate1497.54.8
Liberal Democrat Thomas Yates1487.45.3
Turnout 1,99030.6
Labour hold Swing
East Chesterton [11] [12]
PartyCandidateVotes%±
Liberal Democrat Ian Manning1,14745.9+10.1
Labour Clare Blair83233.3+18.3
UKIP Peter Burkinshaw2218.80.9
Conservative Tom Kerby1606.418.4
Green Peter Pope1405.69.1
Turnout 2,50937.5
Liberal Democrat hold Swing
King's Hedges [11] [12]
PartyCandidateVotes%±
Labour Fiona Onasanya 71648.9+22.8
Liberal Democrat Neale Upstone28119.219.9
Independent Ian Tyes24316.6n/a
Conservative Anette Karimi22415.37.6
Turnout 1,48723.5
Labour gain from Liberal Democrat Swing
Market [11] [12]
PartyCandidateVotes%±
Liberal Democrat Edward Cearns47533.111.6
Labour Dan Ratcliffe43430.2+17.6
Green Simon Sedgwick-Jell26818.72.5
Conservative Sheila Lawlor25818.03.4
Turnout 1,45222.7
Liberal Democrat hold Swing
Newnham [11] [12]
PartyCandidateVotes%±
Liberal Democrat Lucy Nethsingha79743.23.1
Labour Peter Sarris66135.8+21.6
Conservative Jonathan Farmer23012.59.7
Green Tom Watkins1508.68.7
Turnout 1,85427.9
Liberal Democrat hold Swing
Petersfield [11] [12]
PartyCandidateVotes%±
Labour Ashley Walsh94355.9+26.2
Liberal Democrat Keith Edkins27016.025.8
Green Sandra Billington26715.8+1.2
Conservative Linda Yeatman20612.21.7
Turnout 1,69728.3
Labour gain from Liberal Democrat Swing
Queen Edith's [11] [12]
PartyCandidateVotes%±
Liberal Democrat Amanda Taylor1,18844.811.5
Labour Co-op John Beresford93135.1+27.7
Conservative Tom Bygott36113.610.5
Green William Birkin1726.55.7
Turnout 2,66240.2
Liberal Democrat hold Swing
Romsey [11] [12]
PartyCandidateVotes%±
Liberal Democrat Kilian Bourke1,11847.9+13.5
Labour Martin Smart74131.7+11.2
Green Hywel Sedgwick-Jell1385.96.4
UKIP Marjorie Barr1185.1+1.1
Cambridge Socialists Tom Woodcock1185.112.5
Conservative Andrew Bower1034.46.8
Turnout 2,34436.9
Liberal Democrat hold Swing
Trumpington [11] [12]
PartyCandidateVotes%±
Liberal Democrat Barbara Ashwood76337.06.6
Conservative John Ionides73535.60.4
Labour Peter Snow23915.9+8.4
Green Ceri Galloway23611.41.5
Turnout 2,07034.5
Liberal Democrat hold Swing
West Chesterton [11] [12]
PartyCandidateVotes%±
Labour Jocelynne Scutt1,04640.9+25.3
Liberal Democrat David Grace96037.68.1
Conservative James Strachan33713.27.4
Green Shayne Mitchell2128.39.8
Turnout 2,57341.1
Labour gain from Liberal Democrat Swing

East Cambridgeshire (9 seats)

Burwell [13] [14]
PartyCandidateVotes%±
Conservative David Brown89346.11.5
Liberal Democrat Charlotte Cane39420.326.2
UKIP Michael Banahan37419.3n/a
Labour Liz Swift27714.3+8.4
Turnout 1,94230.2
Conservative hold Swing
Ely North and East [15] [14]
PartyCandidateVotes%±
Conservative Mike Rouse1,08639.85.3
Liberal Democrat Nigel Bell61222.424.7
UKIP Peter Dawe48217.6n/a
Labour Clem Butler38514.1+6.3
Green Robert Edwards1666.1n/a
Turnout 2,74331.9
Conservative gain from Liberal Democrat Swing
Ely South and West [16] [14]
PartyCandidateVotes%±
Conservative Anna Bailey97338.53.7
Liberal Democrat Sue Austen71228.223.8
UKIP Jeremy Tyrrell44117.5n/a
Labour Ruth Barber27510.9+5.1
Green Andrew Allen1265.0n/a
Turnout 2,53437.4
Conservative gain from Liberal Democrat Swing
Haddenham [17] [14]
PartyCandidateVotes%±
Conservative Bill Hunt1,29249.32.0
UKIP Mark Higginson53820.5n/a
Liberal Democrat Gareth Wilson46317.726.9
Labour Rob Bayley2399.0+4.9
Green Gemma Bristow903.4n/a
Turnout 2,62433.9
Conservative hold Swing
Littleport [18] [14]
PartyCandidateVotes%±
UKIP Daniel Divine47535.8n/a
Conservative Fred Brown38929.324.9
Liberal Democrat Neil Morrison26019.618.3
Labour Edna Simms20215.2+7.3
Turnout 1,33420.3
UKIP gain from Conservative Swing
Soham and Fordham Villages (2 seats) [19] [14]
PartyCandidateVotes%±
Conservative James Palmer2,06425.012.9
Conservative Joshua Schumann1,62319.7
UKIP Dick Bourne1,36416.5n/a
UKIP John Howlett1,19814.5
Labour Mike Swift5977.2+5.9
Liberal Democrat Charles Warner5887.124.1
Labour Chris Horne4996.0
Liberal Democrat Chika Akinwale3193.9
Turnout 8,25222.3
Conservative hold Swing
Sutton [20] [14]
PartyCandidateVotes%±
Conservative Philip Read81749.4+3.9
Liberal Democrat Lorna Dupre54232.8+8.9
Labour Peter Allenson29517.8+10.6
Turnout 1,69425.7
Conservative hold Swing
Woodditton [21] [14]
PartyCandidateVotes%±
Conservative Mathew Shuter1,32760.2+5.6
Labour Steven O'Dell46621.1+14.6
Liberal Democrat Jennifer Liddle41118.620.3
Turnout 2,24128.1
Conservative hold Swing

Fenland (11 seats)

Chatteris [5] [22]
PartyCandidateVotes%±
UKIP Sandra Rylance58434.8n/a
Conservative Mark Buckton57934.515.7
Liberal Democrat Josephine Ratcliffe35821.321.6
Labour Ann Beevor1599.5+2.6
Turnout 1,68927.6
UKIP gain from Conservative Swing
Forty Foot [5] [22]
PartyCandidateVotes%±
Conservative David Connor84539.3+0.6
UKIP David Kelley68131.7+16.7
Independent Mark Archer42819.910.4
Labour Valerie Brooker1979.2+4.3
Turnout 2,15730.2
Conservative hold Swing
March East [5] [22]
PartyCandidateVotes%±
Conservative Fred Yeulett67335.125.5
UKIP Richard Mason63533.1n/a
Labour Martin Field50826.5+8.8
Liberal Democrat Diane Baldry1035.418.3
Turnout 1,92629.4
Conservative hold Swing
March North [5] [22]
PartyCandidateVotes%±
Conservative Steve Count61638.017.8
UKIP Christina Towns50130.9n/a
Liberal Democrat Stephen Court32820.210.3
Labour David Brown17710.92.8
Turnout 1,62429.4
Conservative hold Swing
March West [23] [22]
PartyCandidateVotes%±
Conservative John Clark1,02360.3+6.6
Labour Charlotte Goodhall-Perry40223.7+15.6
Liberal Democrat Heather Kinnear27116.0+3.3
Turnout 1,76227.6
Conservative hold Swing
Roman Bank and Peckover [5] [22]
PartyCandidateVotes%±
UKIP Alan Lay95541.2+16.5
Conservative Steve Tierney94440.712.3
Labour Barry Diggle33514.4+2.2
Liberal Democrat Robert McLaren853.76.4
Turnout 2,32632.5
UKIP gain from Conservative Swing
Waldersey [5] [22]
PartyCandidateVotes%±
UKIP Gordon Gillick71335.9+27.4
Liberal Democrat Gavin Booth60830.6+2.9
Conservative Will Sutton52826.613.8
Labour Jess Hibbert1397.0+0.7
Turnout 1,99628.8
UKIP gain from Conservative Swing
Whittlesey North [5] [22]
PartyCandidateVotes%±
Conservative Martin Curtis1,15155.66.7
UKIP John Redding61129.5n/a
Labour Colin Gale26012.62.7
English Democrat Maria Goldspink482.3n/a
Turnout 2,08433.7
Conservative hold Swing
Whittlesey South [23] [22]
PartyCandidateVotes%±
Conservative Ralph Butcher99054.213.2
English Democrat Stephen Goldspink53629.3n/a
Labour Aidan Hervey30216.5+6.6
Turnout 1,85127.9
Conservative hold Swing
Wisbech North [5] [22]
PartyCandidateVotes%±
UKIP Paul Clapp80840.3+9.6
Independent Virginia Bucknor52926.4n/a
Conservative Samantha Hoy47323.618.1
Labour Dean Reeves1939.65.9
Turnout 2,00826.3
UKIP gain from Conservative Swing
Wisbech South [5] [22]
PartyCandidateVotes%±
UKIP Peter Lagoda77438.2+11.7
Conservative Simon King63631.414.9
Labour Malcom Gamble33316.5+5.9
Liberal Democrat Patrick Roy28113.9+4.4
Turnout 2,02925.1
UKIP gain from Conservative Swing

Huntingdonshire (19 seats)

Brampton and Kimbolton [24] [25]
PartyCandidateVotes%±
Liberal Democrat Peter Downes1,39647.711.8
Conservative Jane King76926.311.9
UKIP Jenny O'Dell64622.1n/a
Labour Mark Johnson1184.0+1.8
Turnout 2,93540.5
Liberal Democrat hold Swing
Buckden, Gransden and The Offords [24] [25]
PartyCandidateVotes%±
Conservative Julie Wisson1,03943.612.8
UKIP Lynne Bullen57324.1n/a
Liberal Democrat Terry Clough55523.316.3
Labour Patrick Hickey2149.0+5.0
Turnout 2,38630.1
Conservative hold Swing
Godmanchester and Huntingdon East (2 seats) [24] [25]
PartyCandidateVotes%±
Liberal Democrat Michael Shellens1,22616.314.2
Liberal Democrat Graham Wilso1,19515.9
UKIP Martin Cohen1,17115.5n/a
UKIP Derek Norman1,08014.3
Conservative Andrew Bish1,02613.620.0
Conservative Daryl Brown1,02413.6
Labour David King3314.4+2.4
Labour Robert Pugh3304.4
TUSC Antony Staples761.0n/a
TUSC Robert Cossey-Mowle721.0
Turnout 32.0
Liberal Democrat hold Swing
Liberal Democrat gain from Conservative Swing
Huntingdon (2 seats) [24] [25]
PartyCandidateVotes%±
UKIP Peter Ashcroft1,11819.3n/a
Conservative Peter Brown1,10617.520.2
UKIP Kay Norman98517.0
Conservative Laine Kadic83614.4
Labour Nik Johnson72112.4+9.9
Labour Marion Kadewere61110.5
Liberal Democrat Michael Burrell2774.817.1
Liberal Democrat Trish Shrapnel2384.1
Turnout 26.7
UKIP gain from Conservative Swing
Conservative hold Swing
Little Paxton and St Neots North (2 seats) [24] [25]
PartyCandidateVotes%±
Conservative Barry Chapman1,31219.321.8
Conservative David Harty1,15817.1
UKIP Marian Appleton94713.9n/a
Independent Bob Farrer85812.6n/a
Independent Ken Churchill74611.0n/a
UKIP Sherrell Smart5968.8
Labour Emlyn Rees3605.3+3.7
Liberal Democrat Gordon Thorpe3114.621.8
Labour Jim Lomax2864.2
Green Melina Lafirenze2163.26.5
Turnout 28.2
Conservative hold Swing
Norman Cross (2 seats) [24] [25]
PartyCandidateVotes%±
UKIP Roger Henson1,27021.3+25.2
Conservative Mac McGuire1,23120.615.8
Conservative Nick Guyatt1,22420.5
UKIP Barry Hyland1,14619.2
Labour Margaret Cochrane4818.1+4.4
Labour Graeme Watkins4056.8
Liberal Democrat Christopher Waites2183.613.8
Turnout 25.2
UKIP gain from Conservative Swing
Conservative hold Swing
Ramsey [24] [25]
PartyCandidateVotes%±
UKIP Peter Reeve1,40666.7+21.4
Conservative Madeleine Jackson52324.810.9
Labour Susan Coomey1105.2+2.4
Liberal Democrat Anthony Jebson703.312.8
Turnout 2,10932.7
UKIP hold Swing
Sawtry and Ellington [24] [25]
PartyCandidateVotes%±
UKIP Simon Bywater1,22849.1+29.2
Conservative Viv McGuire89435.720.0
Labour Mary Howell2309.2+3.7
Liberal Democrat Rupert Moss-Eccardt1496.012.8
Turnout 2,51734.3
UKIP gain from Conservative Swing
Somersham and Earith [24] [25]
PartyCandidateVotes%±
Conservative Steve Criswell1,32152.210.9
UKIP Peter Verrechia71728.3+13.1
Liberal Democrat Tony Hulme28811.45.9
Labour Iain Ramsbottom2068.1+3.7
Turnout 2,53534.0
Conservative hold Swing
St Ives (2 seats) [24] [25]
PartyCandidateVotes%±
UKIP Paul Bullen1,58119.7n/a
Conservative Kevin Reynolds1,52118.916.7
UKIP Margaret King1,45918.2
Conservative Ryan Fuller1,43317.9
Liberal Democrat David Hodge5146.421.3
Labour Richard Allen4866.1+3.9
Labour Angela Richards4485.6
Liberal Democrat Colin Saunderson3894.8
Monster Raving Loony Lord Toby Jug1972.53.7
Turnout 28.4
UKIP gain from Conservative Swing
Conservative hold Swing
St Neots Eaton Socon and Eynesbury (2 seats) [24] [25]
PartyCandidateVotes%±
Independent Derek Giles1,31122.6n/a
Independent Steven Van de Kerkhove1,14119.7n/a
Conservative Roger Harrison72812.625.5
Conservative Adrian Usher71012.2
UKIP Dave Howard69211.9n/a
UKIP Steve Lancaster4708.1
Labour Wendy Hurst2504.30.4
Labour William O'Connor2093.6
Liberal Democrat Martin Land1622.838.6
Green Gareth Thomas1262.2n/a
Turnout 25.9
Independent gain from Conservative Swing
The Hemingfords and Fenstanton [24] [25]
PartyCandidateVotes%±
Conservative Ian Bates1,14147.618.4
UKIP Philip Foster79433.1n/a
Liberal Democrat David Priestman2329.717.7
Labour John Watson2319.6+3.0
Turnout 2,40232.3
Conservative hold Swing
Warboys and Upwood [24] [25]
PartyCandidateVotes%±
UKIP Michael Tew1,00247.0+18.5
Conservative Jason Ablewhite79637.312.8
Labour Kevin Goddard1718.0+4.5
Liberal Democrat Christine Wills1647.710.2
Turnout 2,14229.6
UKIP gain from Conservative Swing

South Cambridgeshire (16 seats)

Bar Hill [26] [27]
PartyCandidateVotes%±
Conservative John Reynolds1,17545.410.3
UKIP Helene Davies-Green57022.0+11.9
Labour Norman Crowther35213.6+5.1
Green Teal Riley2429.40.2
Liberal Democrat Andy Pellew2198.57.6
Monster Raving Loony Lord Broughall281.1n/a
Turnout 2,59335.1
Conservative hold Swing
Bassingbourn [26] [27]
PartyCandidateVotes%±
Conservative Adrian Dent72645.812.2
Green Simon Saggers54434.3+12.1
Labour Mark Toner19912.5+3.9
Liberal Democrat Mark Holmes1177.43.7
Turnout 1,61329.5
Conservative hold Swing
Bourn [26] [27]
PartyCandidateVotes%±
Conservative Mervyn Loynes44926.023.3
Liberal Democrat Roger Hume43425.111.8
Labour Gavin Clayton39322.7+8.9
UKIP Lister Wilson36321.0n/a
Green Marcus Pitcaithly895.2n/a
Turnout 1,73225.9
Conservative hold Swing
Cottenham, Histon and Impington (2 seats) [26] [27]
PartyCandidateVotes%±
Independent Mike Mason1,31714.8n/a
Liberal Democrat John Jenkins1,26014.218.4
Conservative Lynda Harford1,14712.916.5
Liberal Democrat Sue Gymer1,12712.7
Conservative Timothy Wotherspoon1,08212.2
Labour Huw Jones93110.5+13.4
Labour Brenda Biamonti8179.2
UKIP Eric Heaver6377.2n/a
UKIP Joe Webster5676.4
Turnout 4,75334.5
Independent gain from Liberal Democrat Swing
Liberal Democrat hold Swing
Duxford [26] [27]
PartyCandidateVotes%±
Conservative Peter Topping1,12542.7+7.1
Liberal Democrat Warren Wilson76529.022.6
UKIP Elizabeth Wade48818.5n/a
Labour Ann Sinnott2569.7+5.2
Turnout 2,64437.9
Conservative gain from Liberal Democrat Swing
Fulbourn [26] [27]
PartyCandidateVotes%±
Liberal Democrat John Williams1,18044.8+18.5
Conservative Nick Clarke84832.23.4
Labour June Ford43416.5+8.6
Green David Smith1696.4n/a
Turnout 2,65434.6
Liberal Democrat gain from Conservative Swing
Gamlingay [26] [27]
PartyCandidateVotes%±
Liberal Democrat Sebastian Kindersley1,45649.87.7
Conservative Alison Elcox73024.912.3
UKIP Diane Birnie47816.3n/a
Labour Peter Smith2629.0+3.7
Turnout 2,94437.6
Liberal Democrat hold Swing
Hardwick [26] [27]
PartyCandidateVotes%±
Conservative Stephen Frost1,00641.7+10.1
Liberal Democrat Peter Fane90537.516.9
Labour Adam Dutton50320.8+16.2
Turnout 2,46831.9
Conservative gain from Liberal Democrat Swing
Linton [26] [27]
PartyCandidateVotes%±
Conservative Roger Hickford1,25340.26.2
Liberal Democrat John Batchelor1,25240.18.3
UKIP Timothy Skottowe34611.1n/a
Labour Tom Purser2698.6+3.4
Turnout 3,12942.6
Conservative gain from Liberal Democrat Swing
Melbourn [26] [27]
PartyCandidateVotes%±
Liberal Democrat Susan Van de Ven1,87562.6+12.8
UKIP David Kendrick47515.8n/a
Conservative Duncan Bullivant44014.724.4
Labour Angela Patrick2076.9+2.4
Turnout 3,00640.8
Liberal Democrat hold Swing
Papworth and Swavesey [26] [27]
PartyCandidateVotes%±
Conservative Mandy Smith93849.614.5
UKIP David Birnie39120.7n/a
Labour David Barrett23412.4+3.8
Green Gaynor Clements19710.4n/a
Liberal Democrat Richard Gymer1316.920.5
Turnout 1,89930.9
Conservative hold Swing
Sawston (2 seats) [26] [27]
PartyCandidateVotes%±
Conservative Tony Orgee1,85224.07.0
Conservative Gail Kenney1,75422.7
UKIP Andrew Billinge95412.4n/a
Labour Adrian French88011.4+9.8
Green Linda Whitebread81010.54.9
Labour Mike Nettleton80110.4
Liberal Democrat Michael Kilpatrick6698.710.1
Turnout 4,24132.2
Conservative hold Swing
Waterbeach [26] [27]
PartyCandidateVotes%±
Liberal Democrat Maurice Leeke1,21742.59.8
Conservative James Hockney1,05336.86.0
UKIP Richard Glover2799.7n/a
Labour Paul Finley1916.7+1.8
Green Eleanor Crane1224.3n/a
Turnout 2,87240.9
Liberal Democrat hold Swing
Willingham [26] [27]
PartyCandidateVotes%±
Conservative Ray Manning88239.618.5
UKIP Martin Hale63628.5n/a
Labour Ben Monks38717.4+10.2
Green Helen Stocks1757.9n/a
Liberal Democrat Barry Platt1486.628.1
Turnout 2,23129.9
Conservative hold Swing

Related Research Articles

South East Cambridgeshire (UK Parliament constituency) Parliamentary constituency in the United Kingdom

South East Cambridgeshire is a constituency represented in the House of Commons of the UK Parliament since 2015 by Lucy Frazer, a Conservative.

Cambridgeshire County Council elections

Cambridgeshire County Council is elected every four years by the first past the post system of election. The council currently consists of 69 councillors, representing 60 electoral divisions. The Conservative Party is currently the largest party on the council, having lost overall control in the 2013 local elections. The council meets at Shire Hall in Cambridge, on the site of Cambridge Castle's bailey and a 19th-century prison.

2009 Cambridgeshire County Council election

An election to Cambridgeshire County Council took place on 4 June 2009 as part of the United Kingdom local elections, 2009. The election was delayed from 7 May to coincide with elections to the European Parliament. 69 councillors were elected from 60 electoral divisions, which returned either one or two county councillors each by first-past-the-post voting. The Conservative Party retained their majority on the council, while the Green Party and UKIP gained their first seats.

2011 South Norfolk District Council election

The elections to South Norfolk District Council were held on Thursday 5 May 2011 along with various other local elections around England, elections to the Scottish Parliament, National Assembly of Wales and Northern Ireland Assembly, and a referendum on whether to adopt the Alternative Vote electoral system for elections to the House of Commons. All 46 council seats were up for election. The previous council was controlled by the Conservatives, with the Liberal Democrats being the only opposition.

2007 Fenland District Council election

The 2007 Fenland District Council election took place on 4 May 2007 to elect members of Fenland District Council in Cambridgeshire, England. The whole council was up for election and the Conservative party stayed in overall control of the council.

2011 Fenland District Council election

The 2011 Fenland District Council election took place on 5 May 2011 to elect members of Fenland District Council in Cambridgeshire, England. The whole council was up for election and the Conservative party stayed in overall control of the council.

2013 Durham County Council election

An election to Durham County Council took place on 2 May 2013 as part of the United Kingdom local elections, 2013. Following a boundary review, 126 councillors were elected from 63 electoral divisions which returned either one, two or three councillors each by first-past-the-post voting for a four-year term of office. The previous election took place in 2008 in advance of the council becoming a unitary authority after the 2009 changes to local government. The election saw the Labour Party increase their majority on the council.

2014 South Cambridgeshire District Council election

Elections to South Cambridgeshire District Council took place on Thursday 22 May 2014, as part of the United Kingdom local elections, 2014. The election was held at the same time as elections to the European Parliament. Nineteen seats, making up one third of South Cambridgeshire District Council, were up for election. Seats up for election in 2014 were last contested at the 2010 election.

2006 Huntingdonshire District Council election

The 2006 Huntingdonshire District Council election took place on 4 May 2006 to elect members of Huntingdonshire District Council in Cambridgeshire, England. One third of the council was up for election and the Conservative party stayed in overall control of the council.

2007 Huntingdonshire District Council election

The 2007 Huntingdonshire District Council election took place on 3 May 2007 to elect members of Huntingdonshire District Council in Cambridgeshire, England. One third of the council was up for election and the Conservative party stayed in overall control of the council.

2008 Huntingdonshire District Council election

The 2008 Huntingdonshire District Council election took place on 1 May 2008 to elect members of Huntingdonshire District Council in Cambridgeshire, England. One third of the council was up for election and the Conservative party stayed in overall control of the council.

2011 Huntingdonshire District Council election

The 2011 Huntingdonshire District Council election took place on 5 May 2011 to elect members of Huntingdonshire District Council in Cambridgeshire, England. One third of the council was up for election and the Conservative party stayed in overall control of the council.

2012 Huntingdonshire District Council election

The 2012 Huntingdonshire District Council election took place on 3 May 2012 to elect members of Huntingdonshire District Council in Cambridgeshire, England. One third of the council was up for election and the Conservative party stayed in overall control of the council.

2014 Huntingdonshire District Council election

The 2014 Huntingdonshire District Council election took place on 22 May 2014 to elect members of Huntingdonshire District Council in Cambridgeshire, England. One third of the council was up for election and the Conservative party stayed in overall control of the council.

2015 South Cambridgeshire District Council election

Elections to South Cambridgeshire District Council took place on Thursday 7 May 2015, as part of the United Kingdom local elections, 2015. The election was held at the same time as the United Kingdom general election. Nineteen seats, making up one third of South Cambridgeshire District Council, were up for election. Seats up for election in 2015 were last contested at the 2011 election.

2016 South Cambridgeshire District Council election

Elections to South Cambridgeshire District Council took place on Thursday 5 May 2016 as part of the United Kingdom local elections, 2016. Nineteen seats, making up one third of South Cambridgeshire District Council, were up for election. Seats up for election in 2016 were last contested at the 2012 election.

2017 Cambridgeshire County Council election

The 2017 Cambridgeshire County Council election was held on 4 May 2017 as part of the 2017 local elections in the United Kingdom. All 61 councillors were elected from 59 electoral divisions, which returned either one or two county councillors each by first-past-the-post voting for a four-year term of office.

2017 Cornwall Council election

The 2017 Cornwall Council election was held on 4 May 2017 as part of the 2017 local elections in the United Kingdom. 122 councillors were elected from the 121 electoral divisions of Cornwall Council, which returned either one or two councillors each by first-past-the-post voting for a four-year term of office. Although originally scheduled to take place on the same day, the election in the Bodmin St Petroc ward was countermanded following the death of Liberal Democrat candidate Steve Rogerson and was held on 8 June.

2017 Cambridgeshire and Peterborough mayoral election

The inaugural Cambridgeshire and Peterborough mayoral election was held on 4 May 2017 to elect the Mayor of Cambridgeshire and Peterborough. The supplementary vote system was used to elect the mayor for a four-year term of office. Subsequent elections will be held in May 2021 and every four years after.

2018 South Cambridgeshire District Council election Event held on Thursday 3 May 2018 as part of the United Kingdom local elections, 2018

Elections to South Cambridgeshire District Council were held on Thursday 3 May 2018 as part of the United Kingdom local elections, 2018. Forty five seats, making up the whole of South Cambridgeshire District Council, were up for election in twenty six wards. The council previously had 57 members, last elected by thirds in 2016, 2015 and 2014. Following a boundary review, there has been a reduction of twelve seats to 45 and the electoral pattern has changed from election by thirds to all out elections, meaning that all seats were up for election on this occasion.

References

  1. "County Council Election – 2nd May 2013". Cambridgeshire County Council. 28 March 2013. Retrieved 2 April 2013.
  2. "Cambridgeshire County Council election: Tories lose control". BBC News. 3 May 2013. Retrieved 6 May 2013.
  3. "The Representation of the People (Form of Canvass) (England and Wales) Regulations 2006, Schedule Part 1". Legislation.gov.uk. 13 October 2011. Retrieved 18 April 2012.
  4. "I have two homes. Can I register at both addresses?". The Electoral Commission. Retrieved 5 January 2011.
  5. 1 2 3 4 5 6 7 8 9 10 "Statement of Persons Nominated". Fenland District Council. 5 April 2013. Retrieved 5 April 2013.
  6. "Victories for Labour make it city's biggest party". Cambridge News. 3 May 2013. Retrieved 6 May 2013.
  7. "Cambridgeshire's council leader is Tory Martin Curtis". BBC News. 21 May 2013. Retrieved 10 July 2013.
  8. "Cambridgeshire County Council to adopt committee led system of governance in May 2014". Cambs Times 24. 20 June 2013. Retrieved 10 July 2013.
  9. "Elections 2013 results". Cambridgeshire County Council. 3 May 2013. Retrieved 4 May 2013.
  10. "Results for Cambridgeshire". BBC News. 3 May 2013. Retrieved 4 May 2013.
  11. 1 2 3 4 5 6 7 8 9 10 11 12 13 14 "Statement of Persons Nominated" (PDF). Cambridge City Council. 5 April 2013. Retrieved 5 April 2013.
  12. 1 2 3 4 5 6 7 8 9 10 11 12 13 14 "Election 2013 results for Cambridge City district". 3 May 2013. Archived from the original on 5 May 2013. Retrieved 4 May 2013.
  13. "Burwell Division - Statement as to Persons Nominated" (PDF). East Cambridgeshire District Council. 5 April 2013. Retrieved 5 April 2013.
  14. 1 2 3 4 5 6 7 8 "Election results 2013 for East Cambridgeshire district". Cambridgeshire County Council. 3 May 2013. Archived from the original on 5 May 2013. Retrieved 4 May 2013.
  15. "Ely North and East Division - Statement as to Persons Nominated" (PDF). East Cambridgeshire District Council. 5 April 2013. Retrieved 5 April 2013.
  16. "Ely South and West Division - Statement as to Persons Nominated" (PDF). East Cambridgeshire District Council. 5 April 2013. Retrieved 5 April 2013.
  17. "Haddenham Division - Statement as to Persons Nominated" (PDF). East Cambridgeshire District Council. 5 April 2013. Retrieved 5 April 2013.
  18. "Littleport Division - Statement as to Persons Nominated" (PDF). East Cambridgeshire District Council. 5 April 2013. Retrieved 5 April 2013.
  19. "Soham and Fordham Villages Division - Statement as to Persons Nominated" (PDF). East Cambridgeshire District Council. 5 April 2013. Retrieved 5 April 2013.
  20. "Sutton Division - Statement as to Persons Nominated" (PDF). East Cambridgeshire District Council. 5 April 2013. Retrieved 5 April 2013.
  21. "Woodditton Division - Statement as to Persons Nominated" (PDF). East Cambridgeshire District Council. 5 April 2013. Retrieved 5 April 2013.
  22. 1 2 3 4 5 6 7 8 9 10 11 "Election results 2013 for Fenland district". Cambridgeshire County Council. 3 May 2013. Archived from the original on 6 May 2013. Retrieved 4 May 2013.
  23. 1 2 "Notice of Poll". Fenland District Council. 11 April 2013. Retrieved 14 April 2013.
  24. 1 2 3 4 5 6 7 8 9 10 11 12 13 "Statement of Persons Nominated" (PDF). Huntingdonshire District Council. 5 April 2013. Archived from the original (PDF) on 9 January 2014. Retrieved 5 April 2013.
  25. 1 2 3 4 5 6 7 8 9 10 11 12 13 "Election 2013 results for Huntingdonshire district". Cambridgeshire County Council. 3 May 2013. Archived from the original on 6 May 2013. Retrieved 6 May 2013.
  26. 1 2 3 4 5 6 7 8 9 10 11 12 13 14 "Statement of Persons Nominated". South Cambridgeshire District Council. 5 April 2013. Archived from the original on 9 January 2014. Retrieved 5 April 2013.
  27. 1 2 3 4 5 6 7 8 9 10 11 12 13 14 "Election results 2013 for South Cambridgeshire district". Cambridgeshire County Council. 3 May 2013. Archived from the original on 7 May 2013. Retrieved 6 May 2013.