Bristol City Council election, 2013

Last updated

Bristol City Council election, 2013
Flag of England.svg
  2011 2 May 2013 2014  

23 OF 70 seats (One Third) to Bristol City Council
36 seats needed for a majority

  First party Second party Third party
 
Party Labour Liberal Democrat Conservative
Seats won 28 23 14
Seat changeIncrease2.svg7Decrease2.svg10Steady2.svg
Popular vote17,75512,20313,712
Percentage30.34%20.85%23.43%
SwingDecrease2.svg 5.45%Decrease2.svg 4.05%Increase2.svg 2.52%

  Fourth party Fifth party
 
Party Green Independent
Seats won 4 1
Seat changeIncrease2.svg2Increase2.svg1
Popular vote8,0553,443
Percentage13.76%5.88%
SwingDecrease2.svg 0.63%Increase2.svg 5.35%

Bristol UK local election 2013 map.svg

Results by ward. Key:
  Conservative
  Labour
  Liberal Democrat
  Green Party of England and Wales
  Independents for Bristol
  No election in 2013

Council control before election

No Overall Control

Council control after election

No Overall Control

Elections for one third (23 seats) of Bristol City Council were held on 2 May 2013 as part of the United Kingdom local elections, 2013. [lower-alpha 1] No party gained overall control.

Bristol City Council local authority of Bristol, England

Bristol City Council is the local authority of Bristol, England. The council is a unitary authority, and is unusual in the United Kingdom in that its executive function is controlled by a directly elected mayor of Bristol. Bristol has 35 wards, electing a total of 70 councillors.

In the context of local authorities in the United Kingdom, the term no overall control refers to a situation in which no single political group achieves a majority of seats; and is analogous to a hung parliament. Of the 310 councils who had members up for election in the 2007 local elections, 85 resulted in a NOC administration.

Contents

The Liberal Democrats, who had been the largest party on the council, lost 10 seats and conceded largest party status to Labour. The Green Party also gained 2 new seats, whilst Independents for Bristol gained their first seat on the Council.

Liberal Democrats (UK) Political party in the United Kingdom

The Liberal Democrats are a liberal political party in the United Kingdom. They presently have 11 Members of Parliament in the House of Commons, 96 members of the House of Lords, and one member of the European Parliament. They also have five Members of the Scottish Parliament and a member each in the Welsh Assembly and London Assembly. The party reached the height of its influence in the early 2010s, forming a junior partner in a coalition government from 2010 to 2015. It is presently led by Vince Cable.

Green Party of England and Wales Political party in England and Wales

The Green Party of England and Wales is a green, left-wing political party in England and Wales. Headquartered in London, since September 2018, its co-leaders are Siân Berry and Jonathan Bartley. The Green Party has one representative in the House of Commons, one in the House of Lords, and three in the European Parliament. In addition, it has various councillors in UK local government and two members of the London Assembly.

Independents For Bristol (IFB) was a British political party for Independent candidates who wished to stand for either local government election or parliamentary election. IFB did not dictate policy but instead enabled individuals to become candidates. The Electoral Commission noted its voluntary deregistration as a political party on 22 July 2016.

Ward results

Bristol Council composition following the 2013 local elections Composition of Bristol City Council following the 2013 local elections.svg
Bristol Council composition following the 2013 local elections

Ashley

Bristol City Council Elections: Ashley Ward 2013 [3]
PartyCandidateVotes%±
Green Rob Telford 1,223 34.54 -8.11
Labour Mary Caroline Southcott 1,056 29.82 +4.65
Liberal Democrat Jon Charles Rogers 1,008 28.47 +0.78
Conservative Iain Jenkins Dennis 101 2.85 -1.64
Independents for Bristol Karl Belizaire 76 2.15N/A
TUSC Tom Baldwin 49 1.38N/A
Birthday Party Dave Dobbs 28 0.79N/A
Majority 167 4.72 -10.24
Green gain from Liberal Democrat Swing -6.38

Avonmouth

Bristol City Council Elections: Avonmouth Ward 2013 [4]
PartyCandidateVotes%±
Conservative Wayne Raymond Harvey 1,068 39.38 +6.70
Labour Nicola Bowden-Jones 824 30.38 -2.32
UKIP Spud Murphy 648 23.89N/A
Green Justin Quinnell 80 2.95 +0.25
Liberal Democrat Ian Humfrey Campion-Smith 64 2.36 -19.92
TUSC Patrick Dorian Hulme 28 9.00N/A
Majority 244 4.72 +4.70
Conservative hold Swing +4.51

Bishopston

Bristol City Council Elections: Bishopston Ward 2013 [5]
PartyCandidateVotes%±
Green Daniella Radice 1,256 36.10 +21.67
Labour Kye Dudd 675 19.40 -1.48
Independents for Bristol John James Hickey 665 19.11N/A
Liberal Democrat Chris Harris 626 17.99 -33.39
Conservative Richard James Manns 225 6.47 -6.84
TUSC Chris Farrell 32 0.92N/A
Majority 581 16.70 -13.80
Green gain from Liberal Democrat Swing +11.58

Cabot

Bristol City Council Elections: Cabot Ward 2013 [6]
PartyCandidateVotes%±
Liberal Democrat Mark Michael Wright 852 40.61 +3.16
Labour Simon Firth 541 25.79 +1.47
Green Charlie Bolton 425 20.26 +1.06
Conservative Chris Didcote 280 13.35 -3.46
Majority 311 14.82 +1.69
Liberal Democrat hold Swing +0.85

Clifton

Bristol City Council Elections: Clifton Ward 2013 [7]
PartyCandidateVotes%±
Conservative Charles James Hastings Lucas 638 26.76 +3.07
Independents for Bristol Brenda Jane McLennan 547 22.94N/A
Liberal Democrat Andy Morgan 459 19.25 -20.62
Labour Rosemary Chamberlin 320 13.42 -2.85
Green Simon Stafford-Townsend 249 10.44 -8.93
UKIP Alex Zychowski 171 7.17N/A
Majority 91 3.82 -12.36
Conservative gain from Liberal Democrat Swing -9.94

Clifton East

Bristol City Council Elections: Clifton East Ward 2013 [8]
PartyCandidateVotes%±
Liberal Democrat Simon Timothy Cook 576 34.68 -0.26
Conservative Gareth Alan-Williams 559 33.65 +3.14
Labour Peter Kennedy-Chapman 268 16.13 -3.52
Green Simon Bennett 258 15.53 +2.01
Majority 17 1.03 -3.40
Liberal Democrat hold Swing -1.70

Cotham

Bristol City Council Elections: Cotham Ward 2013 [9]
PartyCandidateVotes%±
Liberal Democrat Anthony Negus 942 41.37 +1.08
Labour Eileen Lepine 563 24.73 +3.59
Green Ani Stafford-Townsend 418 18.36 -1.45
Conservative Christopher Morton 320 14.05 -3.36
TUSC Caroline Louisa Vincent 34 1.49 +0.13
Majority 379 16.64 -2.51
Liberal Democrat hold Swing -1.26

Easton

Bristol City Council Elections: Easton Ward 2013 [10]
PartyCandidateVotes%±
Labour Afzal Shah 974 33.95 -4.02
Green Anna McMullen 840 29.28 +2.09
Liberal Democrat John Francis Kiely 698 24.33 -3.42
Independents for Bristol Jane Westhead 267 9.31N/A
Conservative Tony Lee 90 3.14 -3.94
Majority 134 4.67 -5.55
Labour gain from Liberal Democrat Swing -3.06

Eastville

Bristol City Council Elections: Eastville Ward 2013 [11]
PartyCandidateVotes%±
Labour Mhairi Threlfall 1,021 39.50 -0.25
Liberal Democrat Steven Robert Comer 1,020 39.46 +10.40
Conservative Mike Williams 237 9.17 -8.16
Green Josie McLellan 223 8.63 -1.90
TUSC Mark Baker 84 3.25N/A
Majority 1 0.04 -10.65
Labour gain from Liberal Democrat Swing -5.33

Frome Vale

Bristol City Council Elections: Frome Vale Ward 2013 [12]
PartyCandidateVotes%±
Labour Bill Payne 907 34.36 -2.38
Conservative Nigel Currie 872 33.03 -12.18
UKIP Steve Wood 573 21.70N/A
Green John Hills 144 5.45 -1.12
Liberal Democrat Daniel Alexander Kelly 108 4.09 -1.81
TUSC Philip John Bishop 36 1.36 -0.53
Majority 35 1.33 -7.14
Labour gain from Conservative Swing +4.90

Henbury

Bristol City Council Elections: Henbury Ward 2013 [13]
PartyCandidateVotes%±
Conservative Chris Windows 1,157 47.73 +12.79
Labour Eileen Means 950 39.19 +6.88
Liberal Democrat Mike Popham 153 6.31 -19.25
Green Tim Malnick 134 5.53 +2.41
Birthday Party Simon James Lewis 30 1.24N/A
Majority 207 8.54 +5.91
Conservative hold Swing +2.10

Henleaze

Bristol City Council Elections: Henleaze Ward 2013 [14]
PartyCandidateVotes%±
Liberal Democrat Glenise Sweeting Morgan 1,559 44.49 -0.11
Conservative Kevin Michael Staples 1,245 35.53 -5.39
Labour Barry Thompson Trahar 439 12.53 +2.14
Green Jane Devlin 261 7.45 +3.37
Majority 314 8.96 +5.28
Liberal Democrat hold Swing +2.64

Hillfields

Bristol City Council Elections: Hillfields Ward 2013 [15]
PartyCandidateVotes%±
Labour Noreen Daniels 1,089 52.97 +8.11
Conservative Roy Towler 379 18.43 +1.09
Green Rick Lovering 246 11.96 +6.06
TUSC Matthew Gordon 188 9.14 +6.10
Liberal Democrat Andrew Charles Brown 154 7.49 -21.38
Majority 710 34.54 +18.55
Labour gain from Liberal Democrat Swing +3.51

Horfield

Bristol City Council Elections: Horfield Ward 2013 [16]
PartyCandidateVotes%±
Conservative Claire Michelle Hiscott 721 28.57 -0.34
Labour Oliver Mead 711 28.17 +6.13
Liberal Democrat Cheryl Ann 579 22.94 -16.68
Independents for Bristol Oliver Randall Mochizuki 241 9.55N/A
Green Jude English 237 9.39 +3.35
TUSC John Yeandle 35 1.39N/A
Majority 10 0.40 -10.31
Conservative gain from Liberal Democrat Swing -3.24

Kingsweston

Bristol City Council Elections: Kingsweston Ward 2013 [17]
PartyCandidateVotes%±
Independents for Bristol Jason Budd 620 27.60N/A
Labour Mike Thorne 584 26.00 -4.24
Liberal Democrat Alex Smethurst 521 23.20 -11.96
Conservative Barbara Madeleine Lewis 404 17.99 -7.33
Green Lela McTernan 77 3.43 -0.28
TUSC Roger Thomas 40 1.78N/A
Majority 36 1.60 -3.32
Independents for Bristol gain from Liberal Democrats Swing +15.92

Lawrence Hill

Bristol City Council Elections: Lawrence Hill Ward 2013 [18]
PartyCandidateVotes%±
Labour Hibaq Jama 1,300 51.61 +10.04
UKIP Pete Brown 324 12.86N/A
Liberal Democrat Abdul Raoof Malik 274 10.88 -16.25
Independents for Bristol Christine Townsend 227 9.01N/A
Green Chloe Somers 207 8.22 -1.20
Conservative David Lewis 121 4.80 -3.49
TUSC Roger Thomas 66 2.62 +0.82
Majority 976 38.75 +24.31
Labour hold Swing -1.41

Lockleaze

Bristol City Council Elections: Lockleaze Ward 2013 [19]
PartyCandidateVotes%±
Labour Estella Tincknell 960 46.40 +14.30
Liberal Democrat Guy James Baiden Poultney 624 30.16 -9.58
Conservative Stephanie Joanne North 257 12.42 -4.43
Green Chrissy Quinnell 228 11.02 +6.59
Majority 336 16.24 +8.60
Labour gain from Liberal Democrat Swing +11.94

Redland

Bristol City Council Elections: Redland Ward 2013 [20]
PartyCandidateVotes%±
Liberal Democrat Fi Hance 881 32.82 -11.82
Green Martin Fodor 590 21.98 +3.49
Labour Philip Jardine 535 19.93 +4.55
Conservative Graham Roger Godwin-Pearson 448 16.69 -4.79
UKIP Christine Thomas 200 7.45N/A
TUSC Martyn Joseph Ahmet 30 1.12N/A
Majority 291 10.84 -12.32
Liberal Democrat hold Swing +7.66

Southmead

Bristol City Council Elections: Southmead Ward 2013 [21]
PartyCandidateVotes%±
Labour Brenda Massey 1,199 61.27 +15.74
Conservative Rob Edwards 376 19.21 -12.19
Green Chris Millman 178 9.10 +4.17
Liberal Democrat Tom Stubbs 123 6.29 -8.69
TUSC Domenico William Hill 81 4.14 +0.98
Majority 823 42.06 +27.93
Labour hold Swing +13.97

St George East

Bristol City Council Elections: St George East Ward 2013 [22]
PartyCandidateVotes%±
Labour Steve Pearce 1,056 50.02 -0.08
Conservative Edward Alan Cullen 580 27.48 -4.27
Green Don Brown 233 11.04 +4.73
Liberal Democrat Paul Elvin 132 6.25 -2.57
TUSC Mike Luff 110 5.21 +2.18
Majority 476 22.54 +4.19
Labour gain from Conservative Swing +2.01

St George West

Bristol City Council Elections: St George West Ward 2013 [23]
PartyCandidateVotes%±
Labour Ron Stone 1,052 46.71 +4.67
UKIP Philip John Collins 520 23.09N/A
Liberal Democrat Tony Potter 284 12.61 -16.62
Green Ben Appleby 174 7.73 -5.76
Conservative Sarah Helen Cleave 168 7.46 -6.03
TUSC Bernie Lyons 54 2.40 -0.04
Majority 532 23.62 +10.81
Labour hold Swing -9.21

Stoke Bishop

Bristol City Council Elections: Stoke Bishop Ward 2013 [24]
PartyCandidateVotes%±
Conservative Peter John Abraham 1,724 68.39 +12.41
Labour Jasvant Singh Badesha 307 12.18 +2.46
Liberal Democrat Mary Elizabeth Page 276 10.95 -17.42
Green Geoff Collard 214 8.49 +2.56
Majority 1417 56.21 +28.60
Conservative hold Swing +4.98

Westbury-on-Trym

Bristol City Council Elections: Westbury-on-Trym Ward 2013 [25]
PartyCandidateVotes%±
Conservative Geoffrey Richard Gollop 1,742 51.00 +4.31
Independents for Bristol Helen Louise Mott 800 23.42N/A
Labour Gillian Kirk 424 12.41 +0.60
Liberal Democrat Graham Christopher Donald 290 8.49 -25.59
Green Alex Dunn 160 4.68 -1.40
Majority 942 27.58 +14.97
Conservative hold Swing -9.56

Notes

  1. All locally registered electors (British, Irish, Commonwealth and European Union citizens) who were aged 18 or over on Thursday 2 May 2013 were entitled to vote in the local elections. Those who were temporarily away from their ordinary address (for example, away working, on holiday, in student accommodation or in hospital) were also entitled to vote in the local elections, [1] although those who had moved abroad and registered as overseas electors cannot vote in the local elections. It is possible to register to vote at more than one address (such as a university student who had a term-time address and lives at home during holidays) at the discretion of the local Electoral Register Office, but it remains an offence to vote more than once in the same local government election. [2]

Related Research Articles

2009 Hertfordshire County Council election

An election to Hertfordshire County Council took place on 4 June 2009 the date of the United Kingdom local elections, 2009. The whole elected council was up for election. The councillors were elected from the 77 wards, which return one each by first-past-the-post voting for a four-year term of office. The wards were the same as those used at the previous election in 2005.
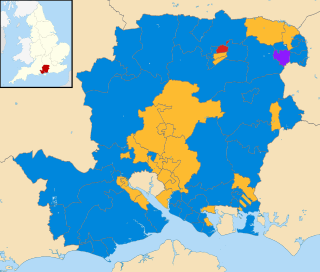
2009 Hampshire County Council election

An election to Hampshire County Council took place on 4 June 2009 as part of the United Kingdom local elections, 2009, having been delayed from 7 May, to coincide with elections to the European Parliament. 78 councillors were elected from 75 electoral divisions, which returned either one or two county councillors each by first-past-the-post voting for a four-year term of office. The electoral divisions were the same as those used at the previous election in 2005. Elections in Portsmouth and Southampton do not coincide with this set, being unitary authorities outside the area covered by the County Council.
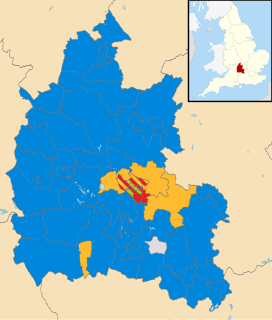
2009 Oxfordshire County Council election

An election to Oxfordshire County Council took place on 4 June 2009 as part of the United Kingdom local elections, 2009, having been delayed from 7 May, to coincide with elections to the European Parliament. 73 councillors were elected from various electoral divisions, which returned either one, two or three county councillors each by first-past-the-post voting for a four-year term of office. The electoral divisions were the same as those used at the previous election in 2005.
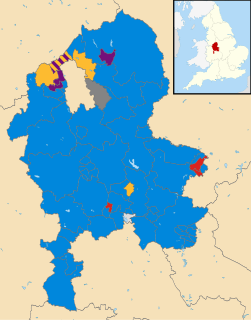
2009 Staffordshire County Council election

Elections to Staffordshire County Council took place on 4 June 2009 as part of the United Kingdom local elections, 2009, having been delayed from 7 May, in order to coincide with elections to the European Parliament. 62 councillors were elected from the various electoral divisions, which returned either one or two county councillors each by first-past-the-post voting for a four-year term of office. The electoral divisions were the same as those used at the previous election in 2005. The council continues to be administered on the Leader and Cabinet model.

2012 United Kingdom local elections elections that were held across England, Scotland and Wales

The 2012 United Kingdom local elections were held across England, Scotland and Wales on 3 May 2012. Elections were held in 128 English local authorities, all 32 Scottish local authorities and 21 of the 22 Welsh unitary authorities, alongside three mayoral elections including the London mayoralty and the London Assembly. Referendums were also held in 11 English cities to determine whether or not to introduce directly elected mayors.
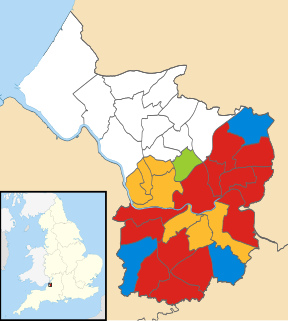
2011 Bristol City Council election

The 2011 Bristol City Council elections were held on Thursday 5 May 2011, for 24 seats, that being one third of the total number of councillors. The Liberal Democrats, who had won overall control of the council in 2009 and increased their majority in 2010, experienced a drop in support and lost 5 seats; 4 to the Labour Party and 1 to the Green Party, which gained its second ever council seat in Bristol. This meant that the Lib Dems no longer had a majority on the council. However, they continued to run the council, relying on opposition groups to vote through any proposal.

The 2012 City of Lincoln Council election took place on 3 May 2012 to elect one-third of the members of City of Lincoln Council in Lincolnshire, England, for a 4-year term of office. This was on the same day as other United Kingdom local elections, 2012.

2013 Leicestershire County Council election

An election to Leicestershire County Council took place on 2 May 2013 as part of the United Kingdom local elections, 2013. 55 councillors were elected from 52 electoral divisions, which returned either one or two county councillors each by first-past-the-post voting for a four-year term of office. The Conservatives held control of the council with a reduced majority of 5 seats. Despite a strong challenge from UKIP, the party only gained 2 seats whilst the Liberal Democrats lost one seat and Labour recouped some of their 2009 losses, gaining 6 seats.
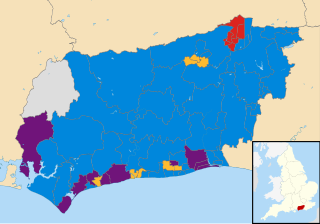
2013 West Sussex County Council election

The West Sussex County Council election, 2013 took place on 2 May 2013, as part of the United Kingdom local elections, 2013. All 71 electoral divisions were up for election, which returned one county councillor each by first-past-the-post voting for a four-year term of office. At this election, the Conservative Party was seeking to retain overall control of the council, and the Liberal Democrats to maintain their position as the main opposition party.

2013 Hampshire County Council election

An election to Hampshire County Council took place on 2 May 2013 as part of the United Kingdom local elections, 2013. 78 councillors were elected from 75 electoral divisions, which returned either one or two county councillors each by first-past-the-post voting for a four-year term of office. The electoral divisions were the same as those of the previous election in 2009. No elections were held in Portsmouth and Southampton, which are unitary authorities outside the area covered by the County Council. The election saw the Conservative Party retain overall control of the council, with a reduced majority of five councillors.
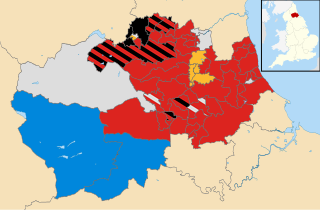
2013 Durham County Council election

An election to Durham County Council took place on 2 May 2013 as part of the United Kingdom local elections, 2013. Following a boundary review, 126 councillors were elected from 63 electoral divisions which returned either one, two or three councillors each by first-past-the-post voting for a four-year term of office. The previous election took place in 2008 in advance of the council becoming a unitary authority after the 2009 changes to local government. The election saw the Labour Party increase their majority on the council.

2013 Worcestershire County Council election

An election to Worcestershire County Council took place on 2 May 2013 as part of the United Kingdom local elections, 2013. 57 councillors were elected from 53 electoral divisions, which returned either one or two county councillors each by first-past-the-post voting for a four-year term of office. The divisions were the same as those used at the previous election in 2009. The election saw the Conservative Party retain overall control of the council with a significantly reduced majority of just 2 seats.

2013 Gloucestershire County Council election

Elections to Gloucestershire County Council took place on 2 May 2013 as part of the United Kingdom local elections, 2013. 53 electoral divisions elected one county councillor each by first-past-the-post voting for a four-year term of office. No elections were held in South Gloucestershire, which is a unitary authority outside the area covered by the County Council.

2013 Hertfordshire County Council election

An election to Hertfordshire County Council took place on 2 May 2013 as part of the United Kingdom local elections, 2013. 77 electoral divisions elected one county councillor each by first-past-the-post voting for a four-year term of office. The electoral divisions were the same as those used at the previous election in 2009.

2013 Essex County Council election

An election to Essex County Council took place on 2 May 2013 as part of the United Kingdom local elections, 2013. 75 councillors were elected from 70 electoral divisions, which returned either one or two county councillors each by first-past-the-post voting for a four-year term of office. The electoral divisions were the same as those used at the previous election in 2009. No elections were held in Thurrock or Southend-on-Sea, which are unitary authorities outside the area covered by the County Council.

2013 Staffordshire County Council election

An election to Staffordshire County Council took place on 2 May 2013 as part of the United Kingdom local elections, 2013. 62 electoral divisions returned one county councillor each by first-past-the-post voting for a four-year term of office. Following a boundary review, new electoral division boundaries were established for this election. No elections were held in Stoke-on-Trent, which is a unitary authority outside the area covered by the County Council. The council continues to be administered on the Leader and Cabinet model.

2013 Suffolk County Council election

Elections to Suffolk County Council took place on 2 May 2013 as part of the United Kingdom local elections, 2013. 75 councillors were elected from 63 electoral divisions, which returned either one or two county councillors each by first-past-the-post voting for a four-year term of office. The electoral divisions were the same as those used at the previous election in 2009.

Council elections for the City of Preston, Lancashire were held on 22 May 2014 as part of the 2014 United Kingdom local elections. The elections have been moved from earlier on in May to coincide with the North West component of the 2014 European Parliament election. Nineteen electoral wards were fought with those councillors elected in the corresponding elections in 2010 defending their seats due to the "in thirds" system employed in Preston local elections. The previous elections to Preston council occurred in 2012 but due to the "in thirds" system employed by Preston council, councillors are elected for four-year terms. This means gains, losses, and vote share comparisons this year are with those fought in 2010.

2017 Gloucestershire County Council election

The 2017 Gloucestershire County Council election took place on 4 May 2017 as part of the 2017 local elections in the United Kingdom. All 53 councillors were elected from electoral divisions which returned one county councillor each by first-past-the-post voting for a four-year term of office. Control of the council went from a Conservative Party minority to a majority administration.

2017 Cornwall Council election

The 2017 Cornwall Council election was held on 4 May 2017 as part of the 2017 local elections in the United Kingdom. 122 councillors were elected from the 121 electoral divisions of Cornwall Council, which returned either one or two councillors each by first-past-the-post voting for a four-year term of office. Although originally scheduled to take place on the same day, the election in the Bodmin St Petroc ward was countermanded following the death of Liberal Democrat candidate Steve Rogerson and was held on 8 June.

References

  1. "The Representation of the People (Form of Canvass) (England and Wales) Regulations 2006, Schedule Part 1". Legislation.gov.uk. 13 October 2011. Retrieved 18 April 2012.
  2. "I have two homes. Can I register at both addresses?". The Electoral Commission. Retrieved 5 January 2011.
  3. "Ashley Ward". Bristol City Council. Retrieved 23 March 2016.
  4. "Avonmouth Ward". Bristol City Council. Retrieved 23 March 2016.
  5. "Bishopston Ward". Bristol City Council. Retrieved 23 March 2016.
  6. "Cabot Ward". Bristol City Council. Retrieved 23 March 2016.
  7. "Clifton Ward". Bristol City Council. Retrieved 23 March 2016.
  8. "Clifton East Ward". Bristol City Council. Retrieved 23 March 2016.
  9. "Cotham Ward". Bristol City Council. Retrieved 23 March 2016.
  10. "Easton Ward". Bristol City Council. Retrieved 23 March 2016.
  11. "Eastville Ward". Bristol City Council. Retrieved 23 March 2016.
  12. "Frome Vale Ward". Bristol City Council. Retrieved 23 March 2016.
  13. "Henbury Ward". Bristol City Council. Retrieved 23 March 2016.
  14. "Henleaze Ward". Bristol City Council. Retrieved 23 March 2016.
  15. "Hillfields Ward". Bristol City Council. Retrieved 23 March 2016.
  16. "Horfield Ward". Bristol City Council. Retrieved 23 March 2016.
  17. "Kingsweston Ward". Bristol City Council. Retrieved 23 March 2016.
  18. "Lawrence Hill Ward". Bristol City Council. Retrieved 23 March 2016.
  19. "Lockleaze Ward". Bristol City Council. Retrieved 23 March 2016.
  20. "Redland Ward". Bristol City Council. Retrieved 23 March 2016.
  21. "Southmead Ward". Bristol City Council. Retrieved 23 March 2016.
  22. "St George East Ward". Bristol City Council. Retrieved 23 March 2016.
  23. "St George West Ward". Bristol City Council. Retrieved 23 March 2016.
  24. "Stoke Bishop Ward". Bristol City Council. Retrieved 23 March 2016.
  25. "Westbury-on-Trym Ward". Bristol City Council. Retrieved 23 March 2016.