Bristol City Council election, 2011

Last updated

Bristol City Council election, 2011
Flag of England.svg
  2010 5 May 2011 2013  

24 of 70 seats (One Third) to Bristol City Council
36 seats needed for a majority

  First party Second party Third party
 
Party Liberal Democrat Labour Conservative
Seats won 33 21 14
Seat changeDecrease2.svg5Increase2.svg4Steady2.svg
Popular vote21,68231,17618,215
Percentage24.9%35.79%20.91%
SwingDecrease2.svg 9.38%Increase2.svg 9%Decrease2.svg 6.31%

  Fourth party
 
Party Green
Seats won 2
Seat changeIncrease2.svg1
Popular vote12,535
Percentage14.39%
SwingIncrease2.svg 6.46%

Council control before election

Liberal Democrats

Council control after election

No Overall Control

The 2011 Bristol City Council elections were held on Thursday 5 May 2011, for 24 seats, that being one third of the total number of councillors. [lower-alpha 1] The Liberal Democrats, who had won overall control of the council in 2009 and increased their majority in 2010, experienced a drop in support and lost 5 seats; 4 to the Labour Party and 1 to the Green Party, which gained its second ever council seat in Bristol. This meant that the Lib Dems no longer had a majority on the council. However, they continued to run the council, relying on opposition groups to vote through any proposal.

Contents

Party 2010 Cllrs Net Gain/Loss 2011 Cllrs
Conservative 14 - 14
Green 1 +1 2
Labour 17 +4 21
Liberal Democrat 38 -5 33
Total 70 - 70
2011 local election results in Bristol Bristol wards 2011.svg
2011 local election results in Bristol

Ward results

Bristol Council composition following the 2011 local elections Composition of Bristol City Council following the 2011 local elections.svg
Bristol Council composition following the 2011 local elections

Ashley

Bristol City Council Elections: Ashley Ward 2011 [3]
PartyCandidateVotes%±
Green Gus Hoyt 2,206 42.65 +11.62
Liberal Democrat Waliur Rahman 1,432 27.69 -20.15
Labour Thangam Debbonaire 1,302 25.17 +12.06
Conservative Graham Roger Godwin Pearson 232 4.49 -0.50
Majority 774 14.96 -1.85
Green gain from Liberal Democrat Swing +15.89

Bedminster

Bristol City Council Elections: Bedminster Ward 2011 [4]
PartyCandidateVotes%±
Labour Colin John Smith 1,694 40.93 +8.21
Liberal Democrat Ian Robert Cooper 839 20.27 -8.98
Conservative Doug Newton 749 18.10 -3.57
Green Cath Slade 621 15.00 +5.39
TUSC Robin Victor Clapp 125 3.02N/A
English Democrat Jon Baker 111 2.68N/A
Majority 855 20.66 17.19
Labour hold Swing +8.60

Bishopsworth

Bristol City Council Elections: Bishopsworth Ward 2011 [5]
PartyCandidateVotes%±
Conservative Richard Stephen Eddy 1,606 51.52 +11.20
Labour Darren Eurwyn Lewis 1,126 36.12 +1.91
Green Barrie Robert Lewis 279 8.95 +1.40
Liberal Democrat Ian Humfrey Campion-Smith 106 3.40 -14.52
Majority 480 15.40 +9.29
Conservative hold Swing +4.65

Brislington East

Bristol City Council Elections: Brislington East Ward 2011 [6]
PartyCandidateVotes%±
Labour Mike Langley 1,383 39.46 +7.11
Conservative Lara Cozens 1,224 34.92 +3.42
Liberal Democrat Pauline Mary Allen 374 10.67 -12.86
Green Robin Whitlock 270 7.70 +3.26
UKIP Mark Stanley Smith 218 6.22N/A
TUSC Martyn Ahmet 36 1.03N/A
Majority 159 4.54 +3.69
Labour hold Swing +1.85

Brislington West

Bristol City Council Elections: Brislington West Ward 2011 [7]
PartyCandidateVotes%±
Liberal Democrat Jackie Norman 1,123 32.34 -5.47
Labour Liam John McDonough 1,068 30.75 +6.73
Conservative Colin Robert Bretherton 663 19.09 -5.71
UKIP Philip John Collins 336 9.67N/A
Green Lucy MacKilligin 247 7.11 +1.02
TUSC John Mark Yeandle 36 1.04N/A
Majority 55 1.59 -11.42
Liberal Democrat hold Swing -6.10

Cabot

Bristol City Council Elections: Cabot Ward 2011 [8]
PartyCandidateVotes%±
Liberal Democrat Alex Woodman 1,441 37.45 -10.17
Labour Ben Mosley 936 24.32 +10.44
Green Ben Appleby 739 19.20 -2.24
Conservative Iain Jenkins Dennis 647 16.81 -0.25
TUSC Chris Farrell 85 2.21N/A
Majority 505 13.13 -13.05
Liberal Democrat hold Swing -10.31

Clifton

Bristol City Council Elections: Clifton Ward 2011 [9]
PartyCandidateVotes%±
Liberal Democrat Barbara Lilian Janke 1,661 39.87 -2.59
Conservative Charles James Hastings Lucas 987 23.69 -3.50
Green Georgina Mary Bavetta 807 19.37 0.61
Labour Rosemary Patricia Chamberlin 678 16.27 +4.67
TUSC Jack Jeffery 33 0.79N/A
Majority 674 16.18 +0.91
Liberal Democrat hold Swing +0.46

Clifton East

Bristol City Council Elections: Clifton East Ward 2011 [10]
PartyCandidateVotes%±
Liberal Democrat Christian Martin 1,191 34.94 -13.01
Conservative Marcus Bruton 1,040 30.51 -1.58
Labour Charlotte Elisabeth Martin 670 19.65 +11.74
Green Simon James Bennett 461 13.52 +1.47
TUSC Patrick Burland 47 1.38N/A
Majority 151 4.43 -11.43
Liberal Democrat hold Swing -5.72

Cotham

Bristol City Council Elections: Cotham Ward 2011 [11]
PartyCandidateVotes%±
Liberal Democrat Neil Robert Harrison 1,694 40.29 -4.60
Labour Estella Jane Tincknell 889 21.14 +7.37
Green Graham Woodruff 833 19.81 -3.01
Conservative Gareth Alan-Williams 732 17.41 -1.11
TUSC Amy Hillgrove 57 1.36N/A
Majority 805 19.15 -2.92
Liberal Democrat hold Swing -5.99

Easton

Bristol City Council Elections: Easton Ward 2011 [12]
PartyCandidateVotes%±
Labour Faruk Choudhury 1,501 37.97 +7.49
Liberal Democrat Zahir Malik 1,097 27.75 -7.49
Green Katie Buse 1,075 27.19 +1.57
Conservative David Thomas Harrison Lewis 280 7.08 +1.07
Majority 404 10.22 +5.46
Labour hold Swing +7.49

Eastville

Bristol City Council Elections: Eastville Ward 2011 [13]
PartyCandidateVotes%±
Labour Mahmadur Khan 1,457 39.75 +15.81
Liberal Democrat Muriel Cole 1,065 29.06 -14.68
Conservative Nazir Muhammad 635 17.33 -0.77
Green Josephine McLellan 386 10.53 -3.69
TUSC Roger Stephen Thomas 122 3.33N/A
Majority 392 10.69 -9.11
Labour gain from Liberal Democrat Swing +15.25

Filwood

Bristol City Council Elections: Filwood Ward 2011 [14]
PartyCandidateVotes%±
Labour Jeff Lovell 1,400 63.84 +11.14
Conservative Paul Francis Smith 311 14.18 -2.47
Liberal Democrat Roger Graham Norman 135 6.16 -10.13
BNP Michael John Hamblin 112 5.11 -3.31
Green Stephen Petter 108 4.92 +1.74
English Democrat Barbara Ann Wright 92 4.20 +1.44
TUSC Wayne Jefferson Coombes 35 1.60N/A
Majority 1089 49.66 +13.61
Labour hold Swing +6.81

Frome Vale

Bristol City Council Elections: Frome Vale Ward 2011 [15]
PartyCandidateVotes%±
Conservative Lesley Ann Alexander 1,671 45.21 +8.11
Labour Bill Payne 1,358 36.74 +8.90
Green Nick Foster 243 6.57 -4.13
Liberal Democrat Jason Budd 218 5.90 -7.39
English Democrat Greg Shaw 136 3.68N/A
TUSC Mark Ian Baker 70 1.89N/A
Majority 313 8.47 -0.79
Conservative hold Swing -0.40

Hartcliffe

Bristol City Council Elections: Hartcliffe Ward 2011 [16]
PartyCandidateVotes%±
Labour Mark Brain 1,500 55.80 +16.87
Conservative Shirley Hodges 642 23.88 -3.11
English Democrat Stephen Michael Wright 272 10.12N/A
Liberal Democrat Anne Pauline White 148 5.51 -16.97
Green Patrick Slade 126 4.69 +1.58
Majority 858 31.92 +19.98
Labour hold Swing +9.99

Hengrove

Bristol City Council Elections: Hengrove Ward 2011 [17]
PartyCandidateVotes%±
Labour Barry Clark 1,331 37.55 +8.50
Conservative George William Pendrill Maggs 1,010 28.49 -0.85
Liberal Democrat Jos Clark 924 26.06 -12.56
English Democrat Mike Blundell 189 5.33N/A
Green Graham Hugh Davey 91 2.57 -0.43
Majority 321 9.06 -0.17
Labour gain from Liberal Democrat Swing 4.68

Hillfields

Bristol City Council Elections: Hillfields Ward 2011 [18]
PartyCandidateVotes%±
Labour Phil Hanby 1,537 44.86 +18.34
Liberal Democrat Helene Louise Gibson 989 28.87 -8.55
Conservative Barbara Madeleine Lewis 594 17.34 +2.27
Green Rob Telford 202 5.90 -2.05
TUSC Matt Gordon 104 3.04N/A
Majority 548 15.99 +5.09
Labour hold Swing +13.45

Knowle

Bristol City Council Elections: Knowle Ward 2011 [19]
PartyCandidateVotes%±
Liberal Democrat Christopher Davies 1,413 39.14 -9.35
Labour Gwyneth Brain 1,210 33.52 +9.09
Conservative Graham David Morris 527 14.60 -0.59
Green Glenn Royston Vowles 380 10.53 +3.58
TUSC Domenico William Hill 80 2.22N/A
Majority 203 5.62 -18.44
Liberal Democrat hold Swing -9.22

Lawrence Hill

Bristol City Council Elections: Lawrence Hill Ward 2011 [20]
PartyCandidateVotes%±
Labour Margaret Elizabeth Hickman 1,615 41.57 +10.04
Liberal Democrat Abdul Malik 1,054 27.13 -4.09
Independent Liiban Mohamed Abdi 458 11.79N/A
Green Christine Mary Prior 366 9.42 -3.00
Conservative Charles William Alexander 322 8.29 -8.41
TUSC Matthew Edward Carey 70 1.80N/A
Majority 561 14.44 +14.13
Labour gain from Liberal Democrat Swing +7.07

Southville

Bristol City Council Elections: Southville Ward 2011 [21]
PartyCandidateVotes%±
Labour Sean David Beynon 1,856 43.34 +13.57
Green Charles Nicholas Bolton 1,613 37.67 +3.84
Conservative Adam Beda Tayler 499 11.65 +0.52
Liberal Democrat Lena Wright 314 7.33 -17.94
Majority 561 14.44 +10.38
Labour hold Swing +4.87

St George East

Bristol City Council Elections: St George East Ward 2011 [22]
PartyCandidateVotes%±
Labour Fabian Breckels 1,739 50.10 +27.93
Conservative Philip Hutton 1,102 31.75 -4.08
Liberal Democrat Paul Elvin 306 8.82 -5.36
Green Chloe Alice Somers 219 6.31 -4.12
TUSC Mike Luff 105 3.03N/A
Majority 637 18.35 +4.69
Labour hold Swing +16.01

St George West

Bristol City Council Elections: St George West Ward 2011 [23]
PartyCandidateVotes%±
Labour Peter Warren Hammond 1,346 42.04 +10.39
Liberal Democrat Tony Potter 936 29.23 +0.81
Conservative Sylvia Christine Windows 432 13.49 -1.98
Green Genevieve Liveley 432 13.49 +3.09
English Democrat Eddie Tranter 181 5.65 -0.91
TUSC Bernie Lyons 78 2.44N/A
Majority 410 12.81 +9.58
Labour gain from Liberal Democrat Swing +5.60

Stockwood

Bristol City Council Elections: Stockwood Ward 2011 [24]
PartyCandidateVotes%±
Conservative Jay Jethwa 1,606 47.10 +5.67
Labour Yvonne Clapp 1,022 29.97 +3.30
Liberal Democrat Michael Alan Goulden 426 12.49 -12.03
Green Peter Anthony Goodwin 356 10.44 +3.05
Majority 584 17.13 +2.37
Conservative hold Swing +1.19

Whitchurch Park

Bristol City Council Elections: Whitchurch Park Ward 2011 [25]
PartyCandidateVotes%±
Labour Helen Holland 1,472 51.59 +13.46
Liberal Democrat Lorraine Horgan 688 24.11 -15.27
Conservative Jenny Rogers 449 15.74 +0.92
English Democrat Ray Carr 154 5.40N/A
Green Barney Smith 90 3.15 +1.35
Majority 784 27.48 +26.23
Labour hold Swing +14.37

Windmill Hill

Bristol City Council Elections: Windmill Hill Ward 2011 [26]
PartyCandidateVotes%±
Liberal Democrat Mark Bailey 2,118 50.55 -1.28
Labour Narraser Rochelle Gordon 1,086 25.92 +1.96
Green Lex Cumber 588 14.03 +2.98
Conservative Tony Lee 255 6.09 -4.31
TUSC Tom Baldwin 143 3.41N/A
Majority 1032 24.63 -3.24
Liberal Democrat hold Swing -1.62

Notes

  1. All locally registered electors (British, Irish, Commonwealth and European Union citizens) who were aged 18 or over on Thursday 2 May 2013 were entitled to vote in the local elections. Those who were temporarily away from their ordinary address (for example, away working, on holiday, in student accommodation or in hospital) were also entitled to vote in the local elections, [1] although those who had moved abroad and registered as overseas electors cannot vote in the local elections. It is possible to register to vote at more than one address (such as a university student who had a term-time address and lives at home during holidays) at the discretion of the local Electoral Register Office, but it remains an offence to vote more than once in the same local government election. [2]

Related Research Articles

2009 Hertfordshire County Council election

An election to Hertfordshire County Council took place on 4 June 2009 the date of the United Kingdom local elections, 2009. The whole elected council was up for election. The councillors were elected from the 77 wards, which return one each by first-past-the-post voting for a four-year term of office. The wards were the same as those used at the previous election in 2005.

2009 Cornwall Council election

The Cornwall Council election, 2009, was an election for all 123 seats on the council. Cornwall Council is a unitary authority that covers the majority of the ceremonial county of Cornwall, with the exception of the Isles of Scilly which have an independent local authority. The elections took place concurrently with other local elections across England and Wales as well as the UK component of the elections to the European Parliament. Cornwall had seen its district and county councils abolished, replaced by a single 123-member Cornish unitary authority, for which councillors were elected for a full term.

2009 East Sussex County Council election

The East Sussex County Council election, 2009 took place on 4 June 2009 as part of the United Kingdom local elections, 2009, having been delayed from 7 May, to coincide with elections to the European Parliament. All 49 seats of this council were up for election. The councillors were elected from 44 electoral divisions, which accordingly return one or two by first-past-the-post voting, for a four-year term of office.

2009 Hampshire County Council election

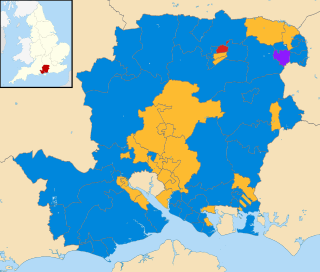
An election to Hampshire County Council took place on 4 June 2009 as part of the United Kingdom local elections, 2009, having been delayed from 7 May, to coincide with elections to the European Parliament. 78 councillors were elected from 75 electoral divisions, which returned either one or two county councillors each by first-past-the-post voting for a four-year term of office. The electoral divisions were the same as those used at the previous election in 2005. Elections in Portsmouth and Southampton do not coincide with this set, being unitary authorities outside the area covered by the County Council.

2009 Oxfordshire County Council election

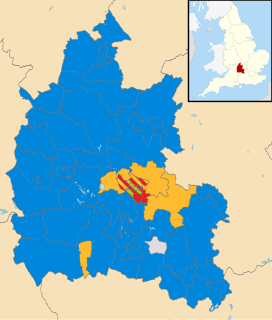
An election to Oxfordshire County Council took place on 4 June 2009 as part of the United Kingdom local elections, 2009, having been delayed from 7 May, to coincide with elections to the European Parliament. 73 councillors were elected from various electoral divisions, which returned either one, two or three county councillors each by first-past-the-post voting for a four-year term of office. The electoral divisions were the same as those used at the previous election in 2005.

2009 Staffordshire County Council election

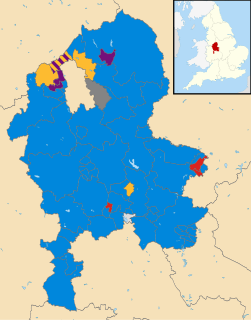
Elections to Staffordshire County Council took place on 4 June 2009 as part of the United Kingdom local elections, 2009, having been delayed from 7 May, in order to coincide with elections to the European Parliament. 62 councillors were elected from the various electoral divisions, which returned either one or two county councillors each by first-past-the-post voting for a four-year term of office. The electoral divisions were the same as those used at the previous election in 2005. The council continues to be administered on the Leader and Cabinet model.

2009 Worcestershire County Council election

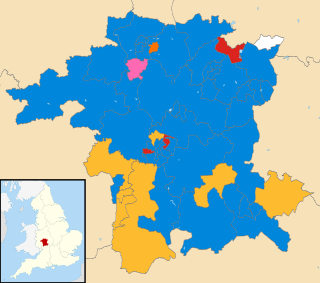
An election to Worcestershire County Council took place on 4 June 2009 as part of the United Kingdom local elections, 2009, alongside the 31 other County Councils, five of which are unitary, and a few other areas. The election had been delayed from 7 May, to coincide with elections to the European Parliament. 57 councillors were elected from 53 wards, which returned either one or two county councillors each by first-past-the-post voting for a four-year term of office. The wards were unchanged from the previous election in 2005. The election saw the Conservative Party retain overall control of the council with a majority of 14 seats, up from a majority of just 2 seats.

2012 United Kingdom local elections elections that were held across England, Scotland and Wales

The 2012 United Kingdom local elections were held across England, Scotland and Wales on 3 May 2012. Elections were held in 128 English local authorities, all 32 Scottish local authorities and 21 of the 22 Welsh unitary authorities, alongside three mayoral elections including the London mayoralty and the London Assembly. Referendums were also held in 11 English cities to determine whether or not to introduce directly elected mayors.

The 2012 City of Lincoln Council election took place on 3 May 2012 to elect one-third of the members of City of Lincoln Council in Lincolnshire, England, for a 4-year term of office. This was on the same day as other United Kingdom local elections, 2012.

2013 Leicestershire County Council election

An election to Leicestershire County Council took place on 2 May 2013 as part of the United Kingdom local elections, 2013. 55 councillors were elected from 52 electoral divisions, which returned either one or two county councillors each by first-past-the-post voting for a four-year term of office. The Conservatives held control of the council with a reduced majority of 5 seats. Despite a strong challenge from UKIP, the party only gained 2 seats whilst the Liberal Democrats lost one seat and Labour recouped some of their 2009 losses, gaining 6 seats.

2013 Essex County Council election

An election to Essex County Council took place on 2 May 2013 as part of the United Kingdom local elections, 2013. 75 councillors were elected from 70 electoral divisions, which returned either one or two county councillors each by first-past-the-post voting for a four-year term of office. The electoral divisions were the same as those used at the previous election in 2009. No elections were held in Thurrock or Southend-on-Sea, which are unitary authorities outside the area covered by the County Council.

2013 Staffordshire County Council election

An election to Staffordshire County Council took place on 2 May 2013 as part of the United Kingdom local elections, 2013. 62 electoral divisions returned one county councillor each by first-past-the-post voting for a four-year term of office. Following a boundary review, new electoral division boundaries were established for this election. No elections were held in Stoke-on-Trent, which is a unitary authority outside the area covered by the County Council. The council continues to be administered on the Leader and Cabinet model.

2013 Bristol City Council election

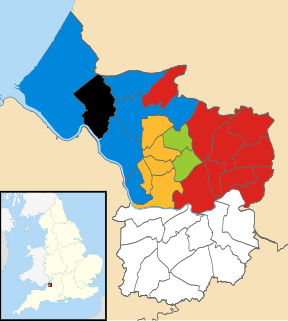
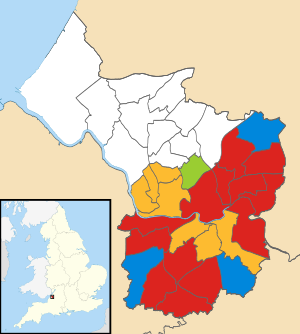
Elections for one third of Bristol City Council were held on 2 May 2013 as part of the United Kingdom local elections, 2013. No party gained overall control.

2013 Suffolk County Council election

Elections to Suffolk County Council took place on 2 May 2013 as part of the United Kingdom local elections, 2013. 75 councillors were elected from 63 electoral divisions, which returned either one or two county councillors each by first-past-the-post voting for a four-year term of office. The electoral divisions were the same as those used at the previous election in 2009.

Council elections for the City of Preston, Lancashire were held on 22 May 2014 as part of the 2014 United Kingdom local elections. The elections have been moved from earlier on in May to coincide with the North West component of the 2014 European Parliament election. Nineteen electoral wards were fought with those councillors elected in the corresponding elections in 2010 defending their seats due to the "in thirds" system employed in Preston local elections. The previous elections to Preston council occurred in 2012 but due to the "in thirds" system employed by Preston council, councillors are elected for four-year terms. This means gains, losses, and vote share comparisons this year are with those fought in 2010.

2014 Harrogate Borough Council election

Elections to Harrogate Borough Council were held on 22 May 2014. A third of the council was up for election, with voting only in the urban wards of Harrogate, Knaresborough and Ripon. The elections were held on the same day as the British local elections and the European Parliament elections. Each ward up for election returned a councillor for a four-year term of office.

2014 Waltham Forest London Borough Council election

The 2014 Waltham Forest Council election took place on 22 May 2014 to elect members of Waltham Forest Council in England. This was on the same day as other local elections.

2017 Derbyshire County Council election

An election to Derbyshire County Council took place on 4 May 2017 as part of the United Kingdom local elections, 2017. 64 councillors were elected from 61 electoral divisions which returned either one or two county councillors each by first-past-the-post voting for a four-year term of office. No elections were held in the City of Derby, which is a unitary authority outside the area covered by the County Council. The Conservative Party won back control of the council, taking thirty-seven of the authority's sixty-four seats.

2017 Gloucestershire County Council election

The 2017 Gloucestershire County Council election took place on 4 May 2017 as part of the 2017 local elections in the United Kingdom. All 53 councillors were elected from electoral divisions which returned one county councillor each by first-past-the-post voting for a four-year term of office. Control of the council went from a Conservative Party minority to a majority administration.

2017 Cornwall Council election

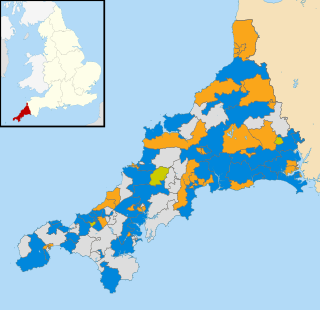
The 2017 Cornwall Council election was held on 4 May 2017 as part of the 2017 local elections in the United Kingdom. 122 councillors were elected from the 121 electoral divisions of Cornwall Council, which returned either one or two councillors each by first-past-the-post voting for a four-year term of office. Although originally scheduled to take place on the same day, the election in the Bodmin St Petroc ward was countermanded following the death of Liberal Democrat candidate Steve Rogerson and was held on 8 June.

References

  1. "The Representation of the People (Form of Canvass) (England and Wales) Regulations 2006, Schedule Part 1". Legislation.gov.uk. 13 October 2011. Retrieved 18 April 2012.
  2. "I have two homes. Can I register at both addresses?". The Electoral Commission. Retrieved 5 January 2011.
  3. "Ashley Ward". Bristol City Council. Retrieved 22 March 2016.
  4. "Bedminster Ward". Bristol City Council. Retrieved 22 March 2016.
  5. "Bishopsworth Ward". Bristol City Council. Retrieved 22 March 2016.
  6. "Brislington East Ward". Bristol City Council. Retrieved 22 March 2016.
  7. "Brislington West Ward". Bristol City Council. Retrieved 22 March 2016.
  8. "Cabot Ward". Bristol City Council. Retrieved 22 March 2016.
  9. "Clifton Ward". Bristol City Council. Retrieved 22 March 2016.
  10. "Clifton East Ward". Bristol City Council. Retrieved 22 March 2016.
  11. "Cotham Ward". Bristol City Council. Retrieved 22 March 2016.
  12. "Easton Ward". Bristol City Council. Retrieved 22 March 2016.
  13. "Eastville Ward". Bristol City Council. Retrieved 22 March 2016.
  14. "Filwood Ward". Bristol City Council. Retrieved 22 March 2016.
  15. "Frome Vale Ward". Bristol City Council. Retrieved 22 March 2016.
  16. "Hartcliffe Ward". Bristol City Council. Retrieved 22 March 2016.
  17. "Hengrove Ward". Bristol City Council. Retrieved 22 March 2016.
  18. "Hillfields Ward". Bristol City Council. Retrieved 22 March 2016.
  19. "Knowle Ward". Bristol City Council. Retrieved 22 March 2016.
  20. "Lawrence Hill Ward". Bristol City Council. Retrieved 22 March 2016.
  21. "Southville Ward". Bristol City Council. Retrieved 22 March 2016.
  22. "St George East Ward". Bristol City Council. Retrieved 22 March 2016.
  23. "St George West Ward". Bristol City Council. Retrieved 22 March 2016.
  24. "Stockwood Ward". Bristol City Council. Retrieved 22 March 2016.
  25. "Whitchurch Park Ward". Bristol City Council. Retrieved 22 March 2016.
  26. "Windmill Hill Ward". Bristol City Council. Retrieved 22 March 2016.