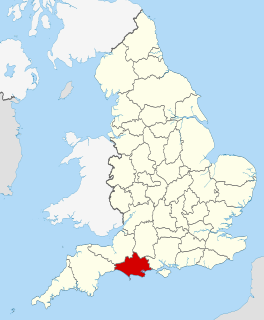
The 2011 Christchurch Borough Council election took place on 5 May 2011 to elect members of Christchurch Borough Council in Dorset, England. The whole council was up for election and the Conservative party stayed in overall control of the council. [1]
Christchurch is a town and borough on the south coast of England. The town adjoins Bournemouth in the west and the New Forest lies to the east. Historically in the county of Hampshire, it became part of the administrative county of Dorset in the 1974 reorganisation of local government. Covering an area of 19.5 square miles (51 km2), Christchurch had a 2013 population of 48,368, making it the fourth-most populous town in Dorset, close behind Weymouth which has a population of 54,539.
Borough status in the United Kingdom is granted by royal charter to local government districts in England, Wales and Northern Ireland. The status is purely honorary, and does not give any additional powers to the council or inhabitants of the district. In Scotland, similarly chartered communities were known as royal burghs, although the status is no longer granted.
Dorset is a county in South West England on the English Channel coast. The ceremonial county comprises the non-metropolitan county, which is governed by Dorset County Council, and the unitary authority areas of Poole and Bournemouth. Covering an area of 2,653 square kilometres (1,024 sq mi), Dorset borders Devon to the west, Somerset to the north-west, Wiltshire to the north-east, and Hampshire to the east. The county town is Dorchester which is in the south. After the reorganisation of local government in 1974 the county's border was extended eastward to incorporate the Hampshire towns of Bournemouth and Christchurch. Around half of the population lives in the South East Dorset conurbation, while the rest of the county is largely rural with a low population density.
The Conservatives increased their majority on the council after winning 21 of the 24 seats. [2] They gained both of the seats in Portfield ward from the Liberal Democrats, with Conservatives Margaret Phipps and Lisle Smith being elected. [2] A further gain came in Town Centre where Conservative Gillian Geary took one of the two seats for the ward, while Paul Hilliard was elected for the first time in Grange ward. [2]
The wards and electoral divisions in the United Kingdom are electoral districts at sub-national level represented by one or more councillors. The ward is the primary unit of English electoral geography for civil parishes and borough and district councils, electoral ward is the unit used by Welsh principal councils, while the electoral division is the unit used by English county councils and some unitary authorities. Each ward/division has an average electorate of about 5,500 people, but ward-population counts can vary substantially. As at the end of 2014 there were 9,456 electoral wards/divisions in the UK.
The Liberal Democrat defeats in Portfield and Town Centre wards reduced them to just one seat on the council, with Peter Hall in Town Centre ward being the party's only councillor. [2] The only other non-Conservatives elected were independents Colin Bungey and Fred Neale who were re-elected in Jumpers ward. [2] Overall turnout at the election was 48.7%. [3]
A Councillor is a member of a local government council.
Voter turnout is the percentage of eligible voters who cast a ballot in an election. Eligibility varies by country, and the voting-eligible population should not be confused with the total adult population. Age and citizenship status are often among the criteria used to determine eligibility, but some countries further restrict eligibility based on sex, race, or religion.
Following the election Ray Nottage was chosen by the Conservative group as the new leader of the council. [4]
Party | Seats | Gains | Losses | Net gain/loss | Seats % | Votes % | Votes | +/− | |
---|---|---|---|---|---|---|---|---|---|
Conservative | 21 | 4 | 0 | +4 | 87.5 | 63.3 | 19,708 | +2.3% | |
Independent | 2 | 0 | 1 | -1 | 8.3 | 7.1 | 2,219 | +1.0% | |
Liberal Democrat | 1 | 0 | 3 | -3 | 4.2 | 13.8 | 4,310 | -11.9% | |
Labour | 0 | 0 | 0 | 0 | 0 | 9.2 | 2,860 | +4.9% | |
UKIP | 0 | 0 | 0 | 0 | 0 | 6.5 | 2,034 | +3.6% |
Party | Candidate | Votes | % | ± | |
---|---|---|---|---|---|
Conservative | David Flagg | 903 | |||
Conservative | Colin Jamieson | 869 | |||
Liberal Democrat | Nicholas Woodford | 649 | |||
Labour | John Merritt | 301 | |||
UKIP | John Dendy | 243 | |||
Turnout | 2,965 | 50.5 | +5.8 | ||
Conservative hold | Swing | ||||
Conservative hold | Swing |
Party | Candidate | Votes | % | ± | |
---|---|---|---|---|---|
Conservative | Denise Jones | 606 | |||
Conservative | Paul Hilliard | 513 | |||
Labour | Vera Hill | 312 | |||
Independent | Ellen Stammas | 251 | |||
Liberal Democrat | John Campbell | 214 | |||
Liberal Democrat | Renetta Vick | 153 | |||
Turnout | 2,049 | 34.4 | +1.0 | ||
Conservative hold | Swing | ||||
Conservative gain from Independent | Swing | ||||
Party | Candidate | Votes | % | ± | |
---|---|---|---|---|---|
Conservative | John Lofts | 1,423 | |||
Conservative | Myra Mawbey | 1,413 | |||
Labour | Andrew Satherley | 254 | |||
Labour | Carol Wilcox | 245 | |||
Turnout | 3,335 | 57.4 | +3.4 | ||
Conservative hold | Swing | ||||
Conservative hold | Swing |
Party | Candidate | Votes | % | ± | |
---|---|---|---|---|---|
Independent | Colin Bungey | 798 | |||
Independent | Frederick Neale | 673 | |||
Conservative | Paul Kinzett | 490 | |||
Conservative | Malcolm Mawbey | 411 | |||
Liberal Democrat | Martyn Hurll | 233 | |||
Labour | Abdulhaye Qureshi | 135 | |||
Turnout | 2,740 | 46.3 | +3.3 | ||
Independent hold | Swing | ||||
Independent hold | Swing |
Party | Candidate | Votes | % | ± | |
---|---|---|---|---|---|
Conservative | Claire Bath | unopposed | |||
Conservative | Mike Duckworth | unopposed | |||
Conservative | Trevor Watts | unopposed | |||
Conservative hold | Swing | ||||
Conservative hold | Swing |
Party | Candidate | Votes | % | ± | |
---|---|---|---|---|---|
Conservative | Sally Derham Wilkes | 1,136 | |||
Conservative | Nicholas Geary | 1,001 | |||
Labour | Donald Barr | 381 | |||
Turnout | 2,518 | 53.1 | +1.8 | ||
Conservative hold | Swing | ||||
Conservative hold | Swing |
Party | Candidate | Votes | % | ± | |
---|---|---|---|---|---|
Conservative | Lisle Smith | 542 | |||
Conservative | Margaret Phipps | 515 | |||
Liberal Democrat | David Davies | 352 | |||
Liberal Democrat | Brett Bader | 295 | |||
Independent | Thomas Lane | 273 | |||
Labour | Christopher Sleightholme | 200 | |||
Turnout | 2,177 | 39.4 | +3.4 | ||
Conservative gain from Liberal Democrat | Swing | ||||
Party | Candidate | Votes | % | ± | |
---|---|---|---|---|---|
Conservative | Raymond Nottage | 920 | |||
Conservative | Bernard Davis | 849 | |||
Liberal Democrat | Zoe Larrad | 424 | |||
Liberal Democrat | Derek Chaffey | 416 | |||
Independent | Barry Sherwin | 224 | |||
Labour | Philippa Lloyd | 181 | |||
Turnout | 3,014 | 48.2 | +1.0 | ||
Conservative hold | Swing | ||||
Conservative hold | Swing |
Party | Candidate | Votes | % | ± | |
---|---|---|---|---|---|
Conservative | Susan Spittle | 1,175 | |||
Conservative | Tavis Fox | 1,083 | |||
Liberal Democrat | Jennifer Lodge | 282 | |||
UKIP | Simon Boyd | 270 | |||
Labour | James Kennedy | 228 | |||
Turnout | 3,038 | 56.0 | +0.5 | ||
Conservative hold | Swing | ||||
Conservative hold | Swing |
Party | Candidate | Votes | % | ± | |
---|---|---|---|---|---|
Liberal Democrat | Peter Hall | 751 | |||
Conservative | Gillian Geary | 675 | |||
Conservative | Lucy Filer | 594 | |||
Liberal Democrat | Andrew Slaney | 541 | |||
UKIP | John Reid | 240 | |||
Labour | Michael Woods | 194 | |||
Turnout | 2,995 | 49.2 | +2.6 | ||
Liberal Democrat hold | Swing | ||||
Conservative gain from Liberal Democrat | Swing | ||||
Party | Candidate | Votes | % | ± | |
---|---|---|---|---|---|
Conservative | Lesley Dedman | 1,583 | |||
Conservative | Patricia Jamieson | 1,572 | |||
Conservative | David Jones | 1,435 | |||
UKIP | Philip Glover | 557 | |||
Labour | Christopher Thompson | 429 | |||
UKIP | Carl Williams | 399 | |||
UKIP | David Williams | 325 | |||
Turnout | 6,300 | 53.0 | +6.9 | ||
Conservative hold | Swing | ||||
Conservative hold | Swing |
The 2002 St Helens Metropolitan Borough Council election took place on 2 May 2002 to elect members of St Helens Metropolitan Borough Council in Merseyside, England. One third of the council was up for election and the Labour party stayed in overall control of the council.
The 2003 St Helens Metropolitan Borough Council election took place on 1 May 2003 to elect members of St Helens Metropolitan Borough Council in Merseyside, England. One third of the council was up for election and the Labour party stayed in overall control of the council.
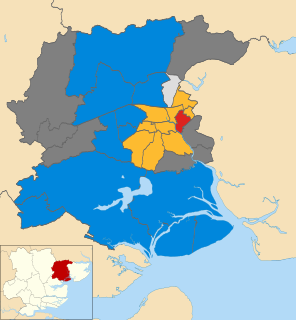
The 2006 Colchester Borough Council election took place on 4 May 2006 to elect members of Colchester Borough Council in Essex, England. One third of the council was up for election and the council stayed under no overall control.
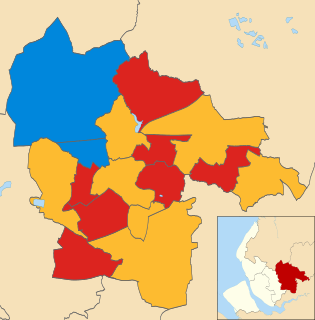
The 2007 St Helens Metropolitan Borough Council election took place on 3 May 2007 to elect members of St Helens Metropolitan Borough Council in Merseyside, England. One third of the council was up for election and the council stayed under no overall control.
The 2000 Fareham Council election took place on 4 May 2000 to elect members of Fareham Borough Council in Hampshire, England. One third of the council was up for election and the Conservative party stayed in overall control of the council.
The 2008 Fareham Council election took place on 1 May 2008 to elect members of Fareham Borough Council in Hampshire, England. Half of the council was up for election and the Conservative party stayed in overall control of the council.
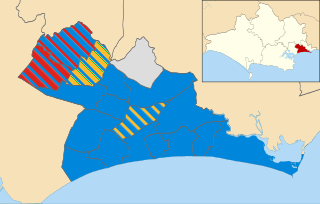
Elections to Bournemouth Borough Council were held on 5 May 2011, in line with other local elections in the United Kingdom. All 54 seats, across 18 wards of this unitary authority, were up for election.
The 2006 Basingstoke and Deane Council election took place on 4 May 2006 to elect members of Basingstoke and Deane Borough Council in Hampshire, England. One third of the council was up for election and the council stayed under no overall control.
The 2008 Basingstoke and Deane Council election took place on 1 May 2008 to elect members of Basingstoke and Deane Borough Council in Hampshire, England. The whole council was up for election with boundary changes since the 2007 election. The Conservative party gained overall control of the council from no overall control.
The 2003 Eastbourne Borough Council election took place on 1 May 2003 to elect members of Eastbourne Borough Council in East Sussex, England. One third of the council was up for election and the Liberal Democrats stayed in overall control of the council.
The 2008 Colchester Borough Council election took place on 1 May 2008 to elect members of Colchester Borough Council in Essex, England. One third of the council was up for election and the Conservative party lost overall control of the council to no overall control.
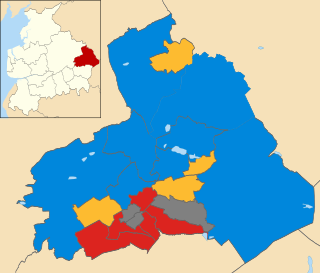
The 2011 Pendle Borough Council election took place on 5 May 2011 to elect members of Pendle Borough Council in Lancashire, England. One third of the council was up for election and the council stayed under no overall control.
The 2012 Pendle Borough Council election took place on 3 May 2012 to elect members of Pendle Borough Council in Lancashire, England. One third of the council was up for election and the council stayed under no overall control.
The 2011 East Dorset District Council election took place on 5 May 2011 to elect members of East Dorset District Council in Dorset, England. The whole council was up for election and the Conservative party stayed in overall control of the council.
The 2006 Havant Borough Council election took place on 4 May 2006 to elect members of Havant Borough Council in Hampshire, England. One third of the council was up for election and the Conservative party stayed in overall control of the council.
The 2008 Havant Borough Council election took place on 1 May 2008 to elect members of Havant Borough Council in Hampshire, England. One third of the council was up for election and the Conservative party stayed in overall control of the council.
The 2014 St Helens Metropolitan Borough Council election took place on 22 May 2014 to elect members of St Helens Metropolitan Borough Council in Merseyside, England. One third of the council was up for election and the Labour party stayed in overall control of the council.
The 2003 Christchurch Borough Council election took place on 1 May 2003 to elect members of Christchurch Borough Council in Dorset, England. The whole council was up for election after boundary changes reduced the number of seats by one. The Conservative party stayed in overall control of the council.
The 2007 Christchurch Borough Council election took place on 3 May 2007 to elect members of Christchurch Borough Council in Dorset, England. The whole council was up for election and the Conservative party stayed in overall control of the council.
The 2015 Christchurch Borough Council election took place on 7 May 2015 to elect members of Christchurch Borough Council in Dorset, England. The whole council was up for election and the Conservative party stayed in overall control of the council.