This article does not cite any sources . (August 2012) (Learn how and when to remove this template message) |
The 2011 Dudley Metropolitan Borough Council election was held on 5 May 2011 to elect members of Dudley Metropolitan Borough Council in the West Midlands, England, as part of the United Kingdom local elections, 2011. 24 seats were up for election, and the results saw the Conservatives hold on to a slightly reduced majority of 15.
Dudley Metropolitan Borough Council (DMBC) is the local authority of the Metropolitan Borough of Dudley in the West Midlands, England. It is a metropolitan district council, one of seven in the West Midlands and one of 36 in the metropolitan counties of England, and provides the majority of local government services in Dudley.
The West Midlands is a metropolitan county and city region in western-central England with a 2014 estimated population of 2,808,356, making it the second most populous county in England after Greater London. It came into existence as a metropolitan county in 1974 after the passage of the Local Government Act 1972, formed from parts of Staffordshire, Worcestershire and Warwickshire. The county itself is a NUTS 2 region within the wider NUTS 1 region of the same name. The county consists of seven metropolitan boroughs: the City of Birmingham, the City of Coventry and the City of Wolverhampton, as well as the boroughs of Dudley, Sandwell, Solihull and Walsall.
England is a country that is part of the United Kingdom. It shares land borders with Wales to the west and Scotland to the north-northwest. The Irish Sea lies west of England and the Celtic Sea lies to the southwest. England is separated from continental Europe by the North Sea to the east and the English Channel to the south. The country covers five-eighths of the island of Great Britain, which lies in the North Atlantic, and includes over 100 smaller islands, such as the Isles of Scilly and the Isle of Wight.
Party | Candidate | Votes | % | ± | |
---|---|---|---|---|---|
Conservative | Pat Martin | 1,681 | 45.0 | ||
Labour | John Martin | 1,364 | 36.5 | ||
UKIP | Pete Lee | 446 | 11.9 | ||
Liberal Democrat | Vera Johnson | 227 | 6.1 | ||
Majority | 338 | 12.8 | |||
Turnout | 3,734 | 35.9 | |||
Conservative hold | Swing | ||||
Party | Candidate | Votes | % | ± | |
---|---|---|---|---|---|
Conservative | Bob James | 1,931 | 47.7 | ||
Labour | Donella Russell | 1,688 | 41.7 | ||
Green | Dennis Neville | 403 | 9.96 | ||
Majority | 243 | ||||
Turnout | 4,048 | 39.7 | |||
Conservative hold | Swing | ||||
Party | Candidate | Votes | % | ± | |
---|---|---|---|---|---|
Labour | Rachel Harris | 1,503 | 50.0 | ||
Conservative | Dan Horrocks | 742 | 24.7 | ||
UKIP | Annmarie May | 273 | 9.1 | ||
BNP | Simon Foxall | 185 | 6.2 | ||
Liberal Democrat | Linda Beasley | 160 | 5.3 | ||
Green | Gordon Elcock | 131 | 4.4 | ||
Majority | 338 | 12.8 | |||
Turnout | 3,734 | 35.9 | |||
Labour hold | Swing | ||||
Party | Candidate | Votes | % | ± | |
---|---|---|---|---|---|
Labour | Karen Jordan | 1,474 | 54.8 | ||
Conservative | Sue Ridley | 708 | 26.3 | ||
UKIP | Andy May | 312 | 11.6 | ||
Liberal Democrat | David Lavender | 108 | 4.0 | ||
Green | Vicky Duckworth | 80 | 3.0 | ||
Majority | 766 | ||||
Turnout | 2,690 | 27.7 | |||
Labour hold | Swing | ||||
Party | Candidate | Votes | % | ± | |
---|---|---|---|---|---|
Labour | Ken Finch | 2,099 | 59.7 | ||
Conservative | Hasan Afzal | 731 | 20.8 | ||
UKIP | Sue Rowe | 661 | 18.8 | ||
Majority | 1,368 | ||||
Turnout | 3,514 | 32.9 | |||
Labour hold | Swing | ||||
Party | Candidate | Votes | % | ± | |
---|---|---|---|---|---|
Labour | Melvyn Mottram | 1,705 | 52.0 | ||
Conservative | Martin Duffield | 742 | 29.1 | ||
UKIP | Peter Hillman | 592 | 18.1 | ||
Majority | 751 | ||||
Turnout | 3,277 | 34.1 | |||
Labour hold | Swing | ||||
Party | Candidate | Votes | % | ± | |
---|---|---|---|---|---|
Labour | Richard Body | 2,106 | 57.5 | ||
Conservative | Louis Redding | 865 | 23.6 | ||
UKIP | Glen Wilson | 289 | 7.9 | ||
BNP | Robert Weale | 179 | 4.9 | ||
Green | John Payne | 109 | 3.0 | ||
Liberal Democrat | Margaret Hanson | 106 | 2.9 | ||
Majority | 1,241 | ||||
Turnout | 3,663 | 37.0 | |||
Labour hold | Swing | ||||
Party | Candidate | Votes | % | ± | |
---|---|---|---|---|---|
Labour | Stuart Turner | 1,620 | 37.9 | ||
Conservative | Anne Millward | 1,618 | 37.8 | ||
UKIP | Phil Rowe | 701 | 16.4 | ||
National Front | Ken Griffiths | 171 | 4 | ||
Liberal Democrat | Michael Jones | 100 | 2.34 | ||
Green | Daniel Archer | 53 | 1.24 | ||
Majority | 2 | ||||
Turnout | 4,280 | 40.8 | |||
Labour gain from Conservative | Swing | ||||
Party | Candidate | Votes | % | ± | |
---|---|---|---|---|---|
Conservative | Karen Shakespeare | 2,078 | 51.6 | ||
Labour | Hilary Bills | 1,906 | 47.3 | ||
Majority | 172 | ||||
Turnout | 3,216 | 42.1 | |||
Conservative hold | Swing | ||||
Party | Candidate | Votes | % | ± | |
---|---|---|---|---|---|
Conservative | Alan Taylor | 2,538 | 55.3 | ||
Labour | Ian Copper | 1,372 | 29.9 | ||
UKIP | Ray Franklin | 394 | 8.6 | ||
Green | Tim Weller | 264 | 5.8 | ||
Majority | 1,166 | ||||
Turnout | 4,590 | 46.1 | |||
Conservative hold | Swing | ||||
Party | Candidate | Votes | % | ± | |
---|---|---|---|---|---|
Conservative | Ken Turner | 2,128 | 53.0 | ||
Labour | Mike Kelly | 1,258 | 31.3 | ||
UKIP | Bob Heeley | 414 | 10.3 | ||
Green | Christopher Lees | 204 | 5.1 | ||
Majority | 870 | ||||
Turnout | 4,014 | 43.0 | |||
Conservative hold | Swing | ||||
Party | Candidate | Votes | % | ± | |
---|---|---|---|---|---|
Conservative | Cheryl Billingham | 1,895 | 40.5 | ||
Liberal Democrat | David Tyler | 1,599 | 34.1 | ||
Labour | Christine Perks | 814 | 17.4 | ||
UKIP | Dave Timmins | 272 | 5.8 | ||
Green | Liz Jednorog | 93 | 2.0 | ||
Majority | 296 | ||||
Turnout | 4,685 | 46.0 | |||
Conservative gain from Liberal Democrat | Swing | ||||
Party | Candidate | Votes | % | ± | |
---|---|---|---|---|---|
Conservative | Peter Miller | 2,303 | 53.4 | ||
Labour | Stephen Haycock | 1,238 | 28.7 | ||
UKIP | Janet Wimlett | 446 | 10.3 | ||
Liberal Democrat | Lois Bramall | 304 | 7.0 | ||
Majority | 1,065 | ||||
Turnout | 4,317 | 41.7 | |||
Conservative hold | Swing | ||||
Party | Candidate | Votes | % | ± | |
---|---|---|---|---|---|
Labour | Hanif Mohammed | 1,747 | 49.0 | ||
Conservative | Sharon Tinsley | 1,250 | 35.0 | ||
Liberal Democrat | Susan Lucas | 317 | 8.9 | ||
Independent | Abdul Qadus | 205 | 5.8 | ||
Majority | 497 | ||||
Turnout | 3,567 | 37.1 | |||
Labour hold | Swing | ||||
Party | Candidate | Votes | % | ± | |
---|---|---|---|---|---|
Labour | Qadar Zada | 1,551 | 40.6 | ||
Green | Will Duckworth | 1,068 | 28.0 | ||
Conservative | Steve Ridley | 716 | 18.8 | ||
UKIP | Phil Wimlett | 387 | 10.1 | ||
Liberal Democrat | John White | 76 | 2.0 | ||
Majority | 483 | ||||
Turnout | 3,816 | 35.9 | |||
Labour hold | Swing | ||||
Party | Candidate | Votes | % | ± | |
---|---|---|---|---|---|
Conservative | Heather Rogers | 2,550 | 55.0 | ||
Labour | Su Lowe | 1,048 | 22.6 | ||
Liberal Democrat | Christopher Bramall | 688 | 14.8 | ||
Green | Benjamin Sweeney | 336 | 7.2 | ||
Majority | 1,502 | ||||
Turnout | 4,640 | 48.0 | |||
Conservative hold | Swing | ||||
Party | Candidate | Votes | % | ± | |
---|---|---|---|---|---|
Conservative | Ian Kettle | 2,833 | 58.2 | ||
Labour | Ada Tomkinson | 1,330 | 27.3 | ||
Liberal Democrat | Simon Hanson | 367 | 7.6 | ||
Green | Lawrence Rowlett | 316 | 6.5 | ||
Majority | 1,503 | ||||
Turnout | 4,864 | 48.8 | |||
Labour hold | Swing | ||||
Party | Candidate | Votes | % | ± | |
---|---|---|---|---|---|
Labour | Jackie Cowell | 1,621 | 48.7 | ||
Conservative | Mike Wood | 1,059 | 31.8 | ||
UKIP | Helen Wimlett | 412 | 12.4 | ||
Green | Pam Archer | 121 | 3.6 | ||
Liberal Democrat | David Sheppard | 101 | 3.04 | ||
Majority | 562 | ||||
Turnout | 3,327 | 32.4 | |||
Labour hold | Swing | ||||
Party | Candidate | Votes | % | ± | |
---|---|---|---|---|---|
Conservative | David Caunt | 1,998 | 49.2 | ||
Labour Co-op | Barbara Sykes | 1,029 | 25.3 | ||
UKIP | Bill Etheridge | 711 | 17.5 | ||
Liberal Democrat | Serena Craigie | 171 | 4.2 | ||
National Front | Keven Inman | 1317 | 3.4 | ||
Majority | 969 | ||||
Turnout | 4,062 | 41.6 | |||
Conservative hold | Swing | ||||
Party | Candidate | Votes | % | ± | |
---|---|---|---|---|---|
Labour | Mary Roberts | 1,755 | 52.8 | ||
Conservative | Ian Jones | 794 | 23.9 | ||
UKIP | Tim Byrne | 554 | 16.7 | ||
Liberal Democrat | Mandy Adams | 204 | 6.1 | ||
Majority | 961 | ||||
Turnout | 3,326 | 33.0 | |||
Labour hold | Swing | ||||
Party | Candidate | Votes | % | ± | |
---|---|---|---|---|---|
Labour | Arshad Safeena | 2,360 | 63.3 | ||
UKIP | Mick Forsyth | 621 | 16.7 | ||
Conservative | Daryl Millward | 599 | 16.1 | ||
Green | Christian Green | 125 | 3.4 | ||
Majority | 1,739 | ||||
Turnout | 3,727 | 36.3 | |||
Labour hold | Swing | ||||
Party | Candidate | Votes | % | ± | |
---|---|---|---|---|---|
Labour | Adam Aston | 1,811 | 51.1 | ||
Conservative | David Simms | 1,681 | 47.4 | ||
Majority | 130 | ||||
Turnout | 3,545 | 34.3 | |||
Labour gain from Conservative | Swing | ||||
Party | Candidate | Votes | % | ± | |
---|---|---|---|---|---|
Conservative | Margaret Cowell | 1,772 | 38.5 | ||
Labour | Chris Hale | 1,500 | 32.6 | ||
Liberal Democrat | June Collins | 656 | 14.3 | ||
UKIP | Barbara Deeley | 394 | 8.6 | ||
Green | Catherine Maguire | 264 | 5.7 | ||
Majority | 272 | ||||
Turnout | 4,601 | 45.3 | |||
Conservative hold | Swing | ||||
Party | Candidate | Votes | % | ± | |
---|---|---|---|---|---|
Conservative | Glenis Simms | 1,749 | 45.7 | ||
Labour | Lynda Coulter | 1,496 | 39.1 | ||
Liberal Democrat | Lynn Boleyn | 297 | 7.76 | ||
Green | Maurice Archer | 270 | 7.1 | ||
Majority | 253 | ||||
Turnout | 3,827 | 37.9 | |||
Conservative hold | Swing | ||||
Sandwell is a metropolitan borough of the West Midlands county in England. The borough is named after the Sandwell Priory, and spans a densely populated part of the West Midlands conurbation. According to Sandwell Metropolitan Borough Council, the borough comprises the six amalgamated towns of Oldbury, Rowley Regis, Smethwick, Tipton, Wednesbury, and West Bromwich, which form West Birmingham although remain a separate body. although these places consist of numerous smaller settlements and localities. Though West Bromwich is the largest town in the borough and its designated Strategic Town Centre, Sandwell Council House is situated in Oldbury.
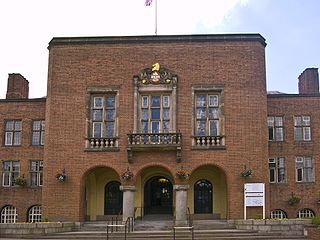
The Metropolitan Borough of Dudley is a metropolitan borough of West Midlands in England. It was created in 1974 following the Local Government Act 1972, through a merger of the existing Dudley County Borough with the municipal boroughs of Stourbridge and Halesowen. The borough borders Sandwell to the east, the city of Birmingham to the south east, Bromsgrove to the south in Worcestershire, South Staffordshire District to the west, and the city of Wolverhampton to the north.
Dudley North is a constituency represented in the House of Commons of the UK Parliament since 2005 by Ian Austin of the Labour Party. Following his resignation from Labour on February 22 2019, Austin now sits as an Independent.
Dudley South is a constituency represented in the House of Commons of the UK Parliament since 2015 by Mike Wood of the Conservative Party.
Halesowen and Rowley Regis is a constituency in the West Midlands represented in the House of Commons of the UK Parliament since 2010 by James Morris, a Conservative.
One third of Bury Metropolitan Borough Council in Greater Manchester, England is elected each year, followed by one year without election. Since the last boundary changes in 2004, 51 councillors have been elected from 17 wards.
One third of Calderdale Metropolitan Borough Council in West Yorkshire, England is elected each year, followed by one year without election.
One third of Dudley Metropolitan Borough Council is elected each year, followed by one year without election.
Elections to Dudley Metropolitan Borough Council were held on 7 May 1998. One third of the council was up for election and the Labour party kept overall control of the council.
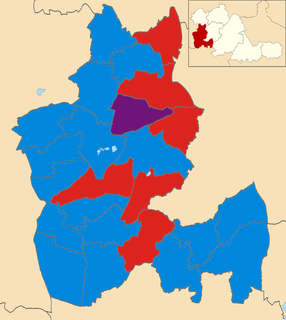
Elections to Dudley Metropolitan Borough Council were held on 1 May 2008. One third of the council was up for election, with an additional seat in Sedgley ward following the resignation of a councillor.
Local elections were held in the United Kingdom in 1980. These were the first annual local elections for the new Conservative Prime Minister Margaret Thatcher. Though the Conservatives in government lost seats, the projected share of the vote was close: Labour Party 42%, Conservative Party 40%, Liberal Party 13%. Labour were still being led by the former prime minister James Callaghan, who resigned later in the year to be succeeded by Michael Foot.
The 2011 Sandwell Metropolitan Borough Council election took place on 5 May 2011 to elect members of Sandwell Metropolitan Borough Council in the West Midlands, England. One third of the council was up for election and the Labour party stayed in overall control of the council.
The 2011 Walsall Metropolitan Borough Council election took place on 5 May 2011 to elect members of Walsall Metropolitan Borough Council in the West Midlands, England. One third of the council was up for election and the Conservative party lost overall control of the council to no overall control.
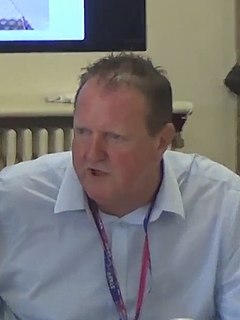
The 2011 Wirral Metropolitan Borough Council election took place on 5 May 2011 to elect members of Wirral Metropolitan Borough Council in England. This election was held on the same day as other local elections.
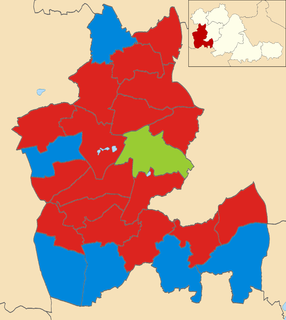
The 2012 Dudley Metropolitan Borough Council election was held on 3 May 2012 to elect members of Dudley Metropolitan Borough Council in the West Midlands, England, as part of the United Kingdom local elections, 2012. 26 seats were up for election, and the results saw the Conservatives losing to a majority of 11 seats to Labour.
The 2014 Dudley Metropolitan Borough Council election took place on 22 May 2014 to elect members of Dudley Metropolitan Borough Council in England. This was on the same day as other local elections.
The 2015 Dudley Metropolitan Borough Council election took place on 7 May 2015 to elect members of the Dudley Metropolitan Borough Council in England. It was held on the same day as other local elections.
The 2016 Dudley Metropolitan Borough Council election took place on 5 May 2016 to elect members of Dudley Metropolitan Borough Council in England. This was on the same day as other local elections.
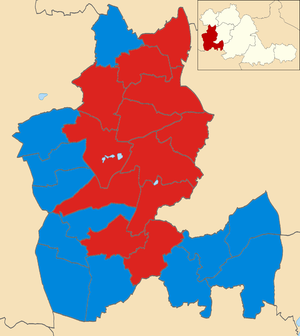
The 2018 Dudley Metropolitan Borough Council election took place on 3 May 2018 to elect members of Dudley Metropolitan Borough Council in England. This was on the same day as other local elections.