This article needs more links to other articles to help integrate it into the encyclopedia . (July 2016) (Learn how and when to remove this template message) |
In 2000 local authority elections in the United Kingdom were held on 4 May.
The United Kingdom (UK), officially the United Kingdom of Great Britain and Northern Ireland, and sometimes referred to as Britain, is a sovereign country located off the north-western coast of the European mainland. The United Kingdom includes the island of Great Britain, the north-eastern part of the island of Ireland, and many smaller islands. Northern Ireland is the only part of the United Kingdom that shares a land border with another sovereign state, the Republic of Ireland. Apart from this land border, the United Kingdom is surrounded by the Atlantic Ocean, with the North Sea to the east, the English Channel to the south and the Celtic Sea to the south-west, giving it the 12th-longest coastline in the world. The Irish Sea lies between Great Britain and Ireland. With an area of 242,500 square kilometres (93,600 sq mi), the United Kingdom is the 78th-largest sovereign state in the world. It is also the 22nd-most populous country, with an estimated 66.0 million inhabitants in 2017.
The Labour Party retained control of Wolverhampton Metropolitan Borough Council, although Labour polled a lower percentage of votes (40.21%) than the Conservative Party (44.61%) in this election.
Wolverhampton is a city and metropolitan borough in the West Midlands, England. At the 2011 census, it had a population of 249,470. The demonym for people from the city is 'Wulfrunian'.
The composition of the council prior to the election was:
The composition of the council following the election was:
Party | Candidate | Votes | % | ± | |
---|---|---|---|---|---|
Labour | Louise Miles | 845 | 51.62 | ||
Conservative | Brenda Wilson | 557 | 34.03 | ||
Liberal Democrat | Michael Birch | 231 | 14.11 | ||
Majority | 288 | 17.59 | |||
Turnout | 1,637 | 20.29 | |||
Party | Candidate | Votes | % | ± | |
---|---|---|---|---|---|
Conservative | Gillian Fellows | 1133 | 46.92 | ||
Labour | Mark Stringer | 1089 | 45.09 | ||
Liberal Democrat | Frances Heap | 189 | 7.83 | ||
Majority | 44 | 1.82 | |||
Turnout | 2,415 | 22.77 | |||
Party | Candidate | Votes | % | ± | |
---|---|---|---|---|---|
Labour | Robert Jones | 2072 | 70.86 | ||
Conservative | John Corns | 668 | 22.85 | ||
Liberal Democrat | June Hemsley | 172 | 5.88 | ||
Majority | 1404 | 48.02 | |||
Turnout | 2,924 | 33.11 | |||
Party | Candidate | Votes | % | ± | |
---|---|---|---|---|---|
Conservative | Susan Bem | 1161 | 43.21 | ||
Independent | Philip Turley | 794 | 29.55 | ||
Labour | Sher Dulai | 583 | 21.70 | ||
Liberal Democrat | Joan Stocking | 148 | 5.51 | ||
Majority | 367 | 13.66 | |||
Turnout | 2,687 | 30.73 | |||
Party | Candidate | Votes | % | ± | |
---|---|---|---|---|---|
Labour | Patricia Byrne | 1162 | 60.52 | ||
Conservative | Alwyn Murray | 561 | 29.22 | ||
Liberal Democrat | Ann Whitehouse | 192 | 10.00 | ||
Majority | 601 | 31.30 | |||
Turnout | 1,920 | 24.30 | |||
Party | Candidate | Votes | % | ± | |
---|---|---|---|---|---|
Labour | Andrew Johnson | 1033 | 59.64 | ||
Conservative | Robert Green | 464 | 26.79 | ||
Liberal Democrat | Eileen Birch | 228 | 13.16 | ||
Majority | 569 | 32.86 | |||
Turnout | 1,732 | 20.77 | |||
Party | Candidate | Votes | % | ± | |
---|---|---|---|---|---|
Conservative | Sandra Terry | 1115 | 46.34 | ||
Labour | Michael Ewing | 1064 | 44.22 | ||
Liberal Democrat | Susan Butler | 139 | 5.77 | ||
Liberal | David Hallmark | 86 | 3.57 | ||
Majority | 51 | 2.12 | |||
Turnout | 2,406 | 29.43 | |||
Party | Candidate | Votes | % | ± | |
---|---|---|---|---|---|
Labour | Elias Mattu | 1816 | 50.81 | ||
Conservative | David Jack | 1460 | 40.86 | ||
Liberal Democrat | Mary Millar | 288 | 8.06 | ||
Majority | 356 | 9.97 | |||
Turnout | 3,574 | 39.23 | |||
Party | Candidate | Votes | % | ± | |
---|---|---|---|---|---|
Labour | Leslie Turner | 767 | 43.02 | ||
Liberal | Colin Hallmark | 529 | 29.67 | ||
Conservative | Rina Nayer | 382 | 21.42 | ||
Liberal Democrat | Ian Jenkins | 102 | 5.72 | ||
Majority | 238 | 13.35 | |||
Turnout | 1,783 | 22.52 | |||
Party | Candidate | Votes | % | ± | |
---|---|---|---|---|---|
Labour | Paul Sweet | 1064 | 68.07 | ||
Conservative | Leon Tanski | 493 | 31.54 | ||
Majority | 571 | 36.53 | |||
Turnout | 1,563 | 18.01 | |||
Party | Candidate | Votes | % | ± | |
---|---|---|---|---|---|
Conservative | Christine Mills | 2033 | 64.66 | ||
Labour | Kevin Stelfox | 762 | 24.24 | ||
Liberal Democrat | William Beard | 346 | 11.00 | ||
Majority | 1271 | 40.43 | |||
Turnout | 3,144 | 32.63 | |||
Party | Candidate | Votes | % | ± | |
---|---|---|---|---|---|
Conservative | Ian Lucas | 1211 | 45.98 | ||
Labour | Paul Allen | 1127 | 42.79 | ||
Liberal Democrat | John Steatham | 285 | 5.51 | ||
Majority | 84 | 3.19 | |||
Turnout | 2,634 | 27.65 | |||
Party | Candidate | Votes | % | ± | |
---|---|---|---|---|---|
Conservative | Lucinda Turner | 1885 | 50.60 | ||
Labour | Philip Page | 1338 | 35.92 | ||
Liberal Democrat | Brian Lewis | 274 | 7.36 | ||
Green | David Hawkins | 220 | 5.91 | ||
Majority | 547 | 14.69 | |||
Turnout | 3,725 | 36.04 | |||
Party | Candidate | Votes | % | ± | |
---|---|---|---|---|---|
Conservative | Alan Hart | 2345 | 60.47 | ||
Labour | Barry Thomas | 1168 | 30.12 | ||
Liberal Democrat | Jessica Pringle | 261 | 6.73 | ||
Green | Rachel Shanks | 101 | 2.60 | ||
Majority | 1177 | 30.35 | |||
Turnout | 3,878 | 38.67 | |||
Party | Candidate | Votes | % | ± | |
---|---|---|---|---|---|
Labour | Surjan Duhra | 1506 | 57.88 | ||
Liberal Democrat | Paul Hodson | 596 | 22.91 | ||
Conservative | Christopher Kelly | 492 | 18.91 | ||
Majority | 910 | 34.97 | |||
Turnout | 2,602 | 26.53 | |||
Party | Candidate | Votes | % | ± | |
---|---|---|---|---|---|
Liberal Democrat | Richard Whitehouse | 2038 | 63.14 | ||
Labour | Graham Childs | 841 | 26.05 | ||
Conservative | Christopher Haynes | 348 | 10.78 | ||
Majority | 1197 | 37.08 | |||
Turnout | 3,228 | 32.27 | |||
Party | Candidate | Votes | % | ± | |
---|---|---|---|---|---|
Conservative | Barry Findlay | 2029 | 69.53 | ||
Labour | David Allcock | 534 | 18.30 | ||
Liberal Democrat | Roger Gray | 351 | 12.03 | ||
Majority | 1495 | 51.23 | |||
Turnout | 2,918 | 31.64 | |||
Party | Candidate | Votes | % | ± | |
---|---|---|---|---|---|
Conservative | Andrew Wynne | 2544 | 75.47 | ||
Labour | Caroline Siarkiewicz | 563 | 16.70 | ||
Liberal Democrat | Philip Bennett | 263 | 7.80 | ||
Majority | 1981 | 58.77 | |||
Turnout | 3,371 | 37.02 | |||
Party | Candidate | Votes | % | ± | |
---|---|---|---|---|---|
Conservative | Matthew Holdcroft | 1272 | 49.92 | ||
Labour | Michael Stafford Good | 1031 | 40.46 | ||
Liberal Democrat | Carole Jenkins | 242 | 9.50 | ||
Majority | 241 | 9.46 | |||
Turnout | 2,548 | 28.39 | |||
Party | Candidate | Votes | % | ± | |
---|---|---|---|---|---|
Conservative | Simon Jevon | 1587 | 60.41 | ||
Labour | Susan Hall | 1032 | 39.28 | ||
Majority | 555 | 21.13 | |||
Turnout | 2,267 | 30.00 | |||
The 1998 Bolton Metropolitan Borough Council election took place on 7 May 1998 to elect members of Bolton Metropolitan Borough Council in Greater Manchester, England. One third of the council was up for election and the Labour party kept overall control of the council.
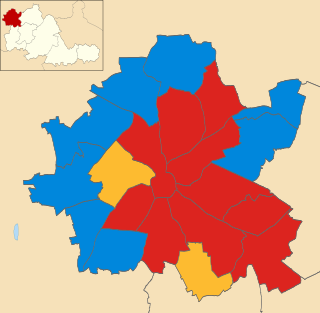
The 1998 Wolverhampton Metropolitan Borough Council election took place on 7 May 1998 to elect members of Wolverhampton Metropolitan Borough Council in the West Midlands, England. One third of the council was up for election and the Labour party kept overall control of the council.
Elections to Wolverhampton City Council were held on 3 May 2007 in Wolverhampton, England. One third of the council was up for election and the Labour Party kept overall control of the council.
Elections to Wolverhampton City Council were held on 3 May 2006 in Wolverhampton, England. One third of the council was up for election and the Labour Party kept overall control of the council.
The 1999 Harlow District Council election took place on 6 May 1999 to elect members of Harlow District Council in Essex, England. One third of the council was up for election and the Labour party stayed in overall control of the council.
Elections to Wolverhampton Metropolitan Borough Council were held on 7 May 1992. One third of the council was up for election and the Conservative Party led the Council in coalition with the Liberal Democrats until the next round of elections in 1994.
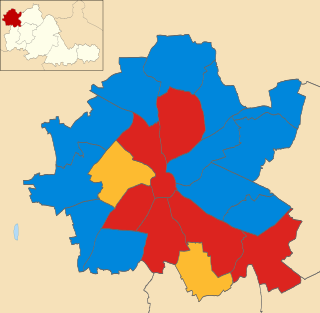
Elections to Wolverhampton City Council were held on 1 May 2008 in Wolverhampton, England. One third of the council was up for election and the Labour group lost overall control after losing eight seats across the City.
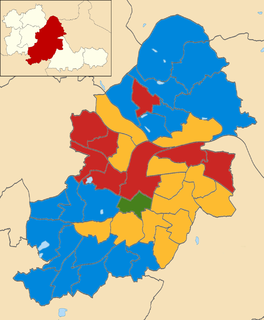
Elections to Birmingham City Council in England were held on 1 May 2008. One third of the council was up for election and the council stayed under no overall control as it had been since 2003.
Elections to Wolverhampton Metropolitan Borough Council were held on 2 May 1996. One third of the council was up for election and the Labour Party retained overall control of the Council, gaining seven seats at the expense of the Conservative group.
The 1999 Wolverhampton Metropolitan Borough Council election took place on 6 May 1999 to elect members of Wolverhampton Metropolitan Borough Council in the West Midlands, England. One third of the council was up for election and the Labour party kept overall control of the council. Overall turnout in the election was 30.63%.
The 2002 Worcester City Council election took place on 2 May 2002 to elect members of Worcester District Council in Worcestershire, England. One third of the council was up for election and the council stayed under no overall control.
Elections to Wolverhampton City Council were held on 6 May 2010 in Wolverhampton, England. One third of the council was up for election, with the Wednesfield North ward electing two Councillors due to the resignation of a Councillor in January 2010 - the winning candidate will serve a 4-year term of office and the second placed candidate will serve a 1-year term.
Local elections were held in the United Kingdom in 1980. These were the first annual local elections for the new Conservative Prime Minister Margaret Thatcher. Though the Conservatives in government lost seats, the projected share of the vote was close: Labour Party 42%, Conservative Party 40%, Liberal Party 13%. Labour were still being led by the former prime minister James Callaghan, who resigned later in the year to be succeeded by Michael Foot.
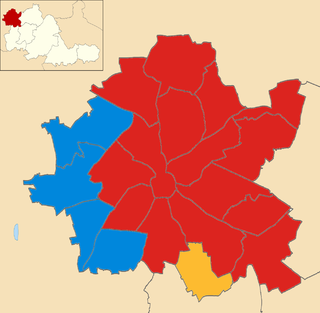
Elections to Wolverhampton City Council was held on 5 May 2011, the same day as the national referendum on the Alternative Vote, in Wolverhampton, England. One third of the council was up for election.
The 2000 Harrogate Council election took place on 4 May 2000 to elect members of Harrogate Borough Council in North Yorkshire, England. One third of the council was up for election and the Liberal Democrats stayed in overall control of the council.
The 1998 Pendle Borough Council election took place on 7 May 1998 to elect members of Pendle Borough Council in Lancashire, England. One third of the council was up for election and the Liberal Democrats stayed in overall control of the council.
The 2000 Sandwell Metropolitan Borough Council election took place on 4 May 2000 to elect members of Sandwell Metropolitan Borough Council in the West Midlands, England. One third of the council was up for election and the Labour party stayed in overall control of the council.
Elections to Norwich City Council took place on 3 May 2012, the same day as other United Kingdom local elections, 2012. Fifteen out of thirty-nine council seats were up for election and the Labour party gained control of the council from No Overall Control.
The 2000 Colchester Borough Council election took place on 4 May 2000 to elect members of Colchester Borough Council in Essex, England. One third of the council was up for election and the council stayed under no overall control.
The 2014 Pendle Borough Council election took place on 22 May 2014 to elect members of Pendle Borough Council in Lancashire, England. One third of the council was up for election and the council stayed under no overall control.