Birmingham City Council election, 2015

Last updated

Birmingham City Council election, 2015
Birmingham City Flag.svg
  2014 7 May 2015 2016  

One third (40) seats to Birmingham City Council + 1 byelection
61 seats needed for a majority

  First party Second party Third party
 
Party Labour Conservative Liberal Democrat
Seats won 79 30 11
Seat changeIncrease2.svg 2Decrease2.svg 1Decrease2.svg 1

Birmingham wards 2015.png

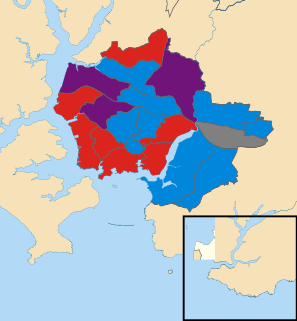
2015 local election results in Birmingham.

Council control before election

Labour

Council control after election

Labour

The 2015 Birmingham City Council election took place on 7 May 2015 to elect members of Birmingham City Council in England. This was on the same day as other local elections, and also the 2015 UK General Election.

Birmingham City Council Local government body for the English city

Birmingham City Council is the local government body responsible for the governance of the City of Birmingham in England, which has been a metropolitan district since 1974. It is the most populated local council in the United Kingdom with, following a reorganisation of boundaries in June 2004, 120 Birmingham City councillors representing over one million people, in 40 wards. This means that Birmingham is technically the largest city in the United Kingdom. The council headquarters are at the Council House in the city centre. The council is responsible for running nearly all local services, with the exception of those run by joint boards. The provision of certain services has in recent years been devolved to several council constituencies, which each have a constituency committee made up of councillors from that district.

Contents

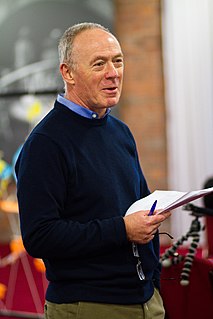
In Birmingham the Labour Party went against the trend across the United Kingdom, as they lost the General Election the Labour Party managed to strengthen its hold on Birmingham City Council as well as performing well in the Westminster seats. This is despite the problems facing the Council in the form of the recent Operation Trojan Horse scandal and the Kerslake review, which was highly critical of Birmingham City Council. Albert Bore (Labour Group leader) said the Labour Party did well in Birmingham because it was honest and open with the people of Birmingham and that the people of Birmingham felt they had been unfairly targeted by the Conservative led government.[ citation needed ]

The Labour Party is a centre-left political party in the United Kingdom which has been described as an alliance of social democrats, democratic socialists and trade unionists. The party's platform emphasises greater state intervention, social justice and strengthening workers' rights.

Operation Trojan Horse, also known as the Trojan Horse scandal, refers to a scandal involving an alleged conspiracy that there was an organised attempt by some individuals to introduce an Islamist or Salafist ethos into several schools in Birmingham, England. The name, based on the Greek legend, comes from an anonymous letter discovered in March 2014, alleged to be from Birmingham Islamists detailing how to wrest control of a school, and speculating about expanding the scheme to other cities. Around a month later, Birmingham City Council claimed that it had received "hundreds" of allegations of plots similar to those illustrated in the letter, some dating back over 20 years. Tahir Alam, former chairman of the Park View Educational Trust which ran three schools in Birmingham, was alleged to have written a 72-page document for the Muslim Council of Britain in 2007 detailing a blueprint for the "Islamisation" of secular state schools. The government's Department for Education initially responded to the scandal with lifetime bans against Alam, along with 14 other teachers, from the teaching profession in 2015. However, the bans against Alam and 13 other teachers were eventually overturned, dropped and/or dismissed in courts between 2016 and 2017.

Albert Bore British politician

Sir Albert Bore is a British nuclear physicist, academic and Labour Party politician.

All results compared to 2012, which is the term that expired in 2015. In 2011 Respect, who did not contest this election, were the main opposition to Labour in a small number of safe seats.

Result

Birmingham City Council Election Result 2015
PartySeatsGainsLossesNet gain/lossSeats %Votes %Votes+/−
  Labour 29Increase2.svg 2Steady2.svgIncrease2.svg 2 70.7 46.0 199,871
  Conservative 10Steady2.svgDecrease2.svg 1Decrease2.svg 1 24.4 26.9 116,680
  Liberal Democrat 2Steady2.svgDecrease2.svg 1Decrease2.svg 1 4.9 10.1 43,898
  UKIP 0Steady2.svgSteady2.svgSteady2.svg 0 11.4 49,673
  Green 0Steady2.svgSteady2.svgSteady2.svg 0 4.7 20,444
  TUSC 0Steady2.svgSteady2.svgSteady2.svg 0 0.4 1,619
  Independent 0Steady2.svgSteady2.svgSteady2.svg 0 0.4 1,549
  Socialist Labour 0Steady2.svgSteady2.svgSteady2.svg 0 0.0 179
  National Health Action 0Steady2.svgSteady2.svgSteady2.svg 0 0.0 96
  Patriotic Socialist Party 0Steady2.svgSteady2.svgSteady2.svg 0 0.0 88
  SDP 0Steady2.svgSteady2.svgSteady2.svg 0 0.0 46

Council Composition

Prior to the election the composition of the council was:

773112
LabourConservativeLib Dem

After the election, the composition of the council was:

793011
LabourConservativeLib Dem
Lib Dem - Liberal Democrats

Result by Ward

The electoral division results listed below [1] are based on the changes from the last time this third was up for election, in the 2011 elections, [2] not taking into account any mid-term by-elections or party defections.

The wards and electoral divisions in the United Kingdom are electoral districts at sub-national level represented by one or more councillors. The ward is the primary unit of English electoral geography for civil parishes and borough and district councils, electoral ward is the unit used by Welsh principal councils, while the electoral division is the unit used by English county councils and some unitary authorities. Each ward/division has an average electorate of about 5,500 people, but ward-population counts can vary substantially. As at the end of 2014 there were 9,456 electoral wards/divisions in the UK.

Acocks Green

Acocks Green 2015
PartyCandidateVotes%±
Labour Stewart Stacey 4,741 44.3 Decrease2.svg 3.7
Liberal Democrat Penny Wagg 2,846 26.6Decrease2.svg 6.9
UKIP Gerry Moynihan 1,390 13.0Increase2.svg 8.7
Conservative Richard Sparkes 1,174 11.0Increase2.svg 1.6
Green Amanda Baker 397 3.7Decrease2.svg 0.6
TUSC Eamonn Flynn 108 1.0N/A
SDP Peter Johnson 46 0.4N/A
Majority 1,895 17.7
Turnout 10,702
Labour hold Swing Increase2.svg 1.6

Aston

Aston 2015
PartyCandidateVotes%±
Labour Muhammad Afzal 8,388 83.6 Increase2.svg 21.2
Conservative Joel Buckett 693 6.9Increase2.svg 2.7
Liberal Democrat Rezaul Billah 479 4.8Decrease2.svg 25.1
Green Hazel Clawley 474 4.7Increase2.svg 1.8
Majority 7,695 76.7
Turnout 10,034
Labour hold Swing Increase2.svg 9.3

Bartley Green

Bartley Green 2015
PartyCandidateVotes%±
Conservative John Lines 4,553 46.7 Decrease2.svg 8.4
Labour Aaron Mansfield 3,046 31.2Decrease2.svg 1.5
UKIP Graham Short 1,565 16.1N/A
Green Michelle Adams 373 3.8Increase2.svg 0.5
Liberal Democrat Julia Garrett 217 2.2Decrease2.svg 0.7
Majority 1,507 15.5
Turnout 9,754
Conservative hold Swing Decrease2.svg 3.5

Billesley

Billesley 2015
PartyCandidateVotes%±
Labour Susan Barnett 4,876 44.7 Decrease2.svg 3.3
Conservative Steve Mee 2,893 26.5Decrease2.svg 10.1
UKIP James Dalton 2,215 20.3N/A
Green Cheryl Buxton-Sait 492 4.5Decrease2.svg 0.1
Liberal Democrat Emily Cox 441 4.0Decrease2.svg 0.4
Majority 1,983 18.2
Turnout 10,917
Labour hold Swing Increase2.svg 3.4

Bordesley Green

Bordesley Green 2015
PartyCandidateVotes%±
Labour Shafique Shah 8,357 75.2 Increase2.svg 4.5
Liberal Democrat Adnan Azam 1,569 14.1Decrease2.svg 3.5
Conservative Parveen Hassan 558 5.0Increase2.svg 2.3
Green Alan Clawley 522 5.0Increase2.svg 3.4
TUSC Theo Sharieff 81 0.7N/A
Majority 6,788 61.1
Turnout 11,117
Labour hold Swing Increase2.svg 4.0

Bournville

Bournville 2015
PartyCandidateVotes%±
Conservative Tim Huxtable 5,422 40.8 Decrease2.svg 1.9
Labour Co-op Mary Locke 4,840 36.5Decrease2.svg 3.1
Green Ian Jamieson 1,297 9.8Increase2.svg 2.1
UKIP Steven Brookes 1,186 8.9N/A
Liberal Democrat Trevor Sword 536 4.0Decrease2.svg 2.8
Majority 582 4.3
Turnout 13,281
Conservative hold Swing Increase2.svg 0.6

Brandwood

Brandwood 2015
PartyCandidateVotes%±
Labour Barry Henley 5,381 46.3 Decrease2.svg 4.4
Conservative Neville Summerfield 3,385 29.1Decrease2.svg 3.1
UKIP Alan Blumenthal 1,699 14.6N/A
Green Lizzy Sharman 679 5.8Increase2.svg 0.1
Liberal Democrat Christopher Burgess 487 4.2Decrease2.svg 2.0
Majority 1,996 17.2
Turnout 11,631
Labour hold Swing Decrease2.svg 0.6

Edgbaston

Edgbaston 2015
PartyCandidateVotes%±
Conservative Matt Bennett 4,112 42.5 Increase2.svg 0.8
Labour Tom Keeley 3,932 40.6Decrease2.svg 0.8
Green Tom Dalton 777 8.0Increase2.svg 1.3
Liberal Democrat Lee Dargue 433 4.5Decrease2.svg 3.1
UKIP Laura Howard 426 4.4Increase2.svg 2.1
Majority 180 1.9
Turnout 9,680
Conservative hold Swing Increase2.svg 0.6

Erdington

Erdington 2015
PartyCandidateVotes%±
Conservative Gareth Moore 4,109 43.3 Decrease2.svg 7.0
Labour Keith Heron 3,420 36.0Decrease2.svg 0.1
UKIP Justin Gayle 1,215 12.8N/A
Green Ulla Grant 325 3.4Decrease2.svg 0.6
Liberal Democrat Philip Mills 247 2.6Decrease2.svg 2.2
National Health Action Krystyna Mikula-Deegan 96 1.0N/A
TUSC Joe Foster 83 0.9N/A
Majority 689 7.3
Turnout 9,495
Conservative hold Swing Decrease2.svg 3.6

Hall Green

Hall Green 2015
PartyCandidateVotes%±
Labour Sam Burden 4,994 40.4 Decrease2.svg 2.3
Conservative David Agar 2,923 23.6Decrease2.svg 9.3
Liberal Democrat Paula Smith 2,029 16.4Decrease2.svg 3.5
Independent Bob Harvey 1,003 8.1N/A
UKIP Malcolm Mummery 980 7.9N/A
Green Rachel Xerri-Brooks 390 3.2Decrease2.svg 0.8
TUSC David Geoffrey Wright 48 0.4N/A
Majority 2,071 16.8
Turnout 12,367
Labour hold Swing Increase2.svg 3.5

Handsworth Wood

Handsworth Wood 2015
PartyCandidateVotes%±
Labour Paulette Hamilton 7,110 63.9 Increase2.svg 13.4
Conservative Sukhwinder Sungu 2,393 21.5Decrease2.svg 19.4
UKIP Harjinder Singh 597 5.4N/A
Green Eric Fairclough 457 4.1Increase2.svg 0.4
Liberal Democrat Arjun Singh 393 3.5Decrease2.svg 0.9
Socialist Labour Shangara Bhatoe 179 1.6N/A
Majority 4,717 42.4
Turnout 11,129
Labour hold Swing Increase2.svg 16.4

Harborne

Harborne 2015
PartyCandidateVotes%±
Labour James McKay 4,922 43.0 Decrease2.svg 3.6
Conservative Jane James 4,384 38.3Decrease2.svg 0.9
Green Phil Simpson 964 8.4Increase2.svg 0.3
UKIP Charles Brecknell 654 5.7N/A
Liberal Democrat Philip Banting 528 4.6Decrease2.svg 0.8
Majority 538 4.7
Turnout 11,452
Labour hold Swing Decrease2.svg 1.4

Hodge Hill

Hodge Hill 2015
PartyCandidateVotes%±
Labour Majid Mahmood 6,065 61.0 Increase2.svg 1.8
Conservative Robert Coleman 1,635 16.5Increase2.svg 7.6
UKIP Adrian Duffen 1,527 15.3Increase2.svg10.0
Liberal Democrat Waheed Rafiq 373 3.8Decrease2.svg 19.3
Green Rhys Morgan 266 2.7Increase2.svg 0.7
TUSC Marie O'Connor 68 0.7N/A
Majority 4,430 44.5
Turnout 9,934
Labour hold Swing Decrease2.svg 2.9

Kingstanding

Kingstanding 2015
PartyCandidateVotes%±
Labour Des Hughes 3,547 42.5 Decrease2.svg2.9
Conservative Andy Rudge 2,640 31.7Decrease2.svg 10.1
UKIP Eric Westacott 1,761 21.1N/A
Green Joe Belcher 196 2.4Decrease2.svg 0.1
Liberal Democrat Graham Lippiatt 136 1.6Decrease2.svg 1.0
TUSC Ben Perry 57 0.7N/A
Majority 907 10.8
Turnout 8,337
Labour hold Swing Increase2.svg 3.6

Kings Norton

Kings Norton 2015
PartyCandidateVotes%±
Labour Peter Griffiths 3,847 39.2 Decrease2.svg 6.0
Conservative Barbara Wood 3,727 38.0Decrease2.svg 1.7
UKIP Tim Plumbe 1,539 15.7N/A
Green Claire Hammond 413 4.2Increase2.svg 0.1
Liberal Democrat Peter Lloyd 277 2.9Decrease2.svg 1.8
Majority 120 1.2
Turnout 9,803
Labour hold Swing Decrease2.svg 2.2

Ladywood

Ladywood 2015
PartyCandidateVotes%±
Labour Albert Bore 4,764 52.0 Decrease2.svg 7.7
Conservative Tom Skidmore 2,290 25.0Increase2.svg 3.7
Green Chloe Juliette 999 10.9Increase2.svg 0.1
UKIP Matthew Ludford 576 6.3N/A
Liberal Democrat Mohammed Saeed 527 5.8Decrease2.svg 1.6
Majority 2,474 27.0
Turnout 9,156
Labour hold Swing Decrease2.svg 5.7

Longbridge

Longbridge 2015
PartyCandidateVotes%±
Labour Andy Cartwright 4,148 38.7 Decrease2.svg 7.8
Conservative Daniel Caldicott 3,576 33.4Decrease2.svg 5.2
UKIP Kevin Morris 2,147 20.1N/A
Green Aysha Turner 475 4.4Increase2.svg 0.5
Liberal Democrat Kevin Hannon 365 3.4Decrease2.svg 1.4
Majority 572 5.3
Turnout 10,711
Labour hold Swing Decrease2.svg 1.3

Lozells and East Handsworth

Lozells and East Handsworth 2015
PartyCandidateVotes%±
Labour Waseem Zaffar 8,535 80.7 Increase2.svg 10.3
Conservative Ravi Chumber 977 9.2Increase2.svg 4.5
Liberal Democrat Baljinder Kaur 379 3.6Decrease2.svg 15.7
Green Ankaret Harmer 367 3.5Decrease2.svg 1.3
TUSC Alistair Wingate 312 3.0N/A
Majority 7,558 71.5
Turnout 10,570
Labour hold Swing Increase2.svg 2.9

Moseley and Kings Heath

Moseley and Kings Heath 2015
PartyCandidateVotes%±
Labour Martin Straker-Welds 5,603 45.2 Decrease2.svg 3.7
Liberal Democrat Martin Mullaney 2,134 17.2Decrease2.svg 9.8
Conservative Owen Williams 1,813 14.6Increase2.svg 3.1
Green Elly Stanton 1,666 13.5Increase2.svg 3.9
Independent Luke Holland 546 4.4N/A
UKIP Rashpal Mondair 465 3.8Increase2.svg 1.5
TUSC Mike Friel 165 1.3N/A
Majority 3,469 28.0
Turnout 12,392
Labour hold Swing Increase2.svg 3.1

Nechells

Nechells 2015
PartyCandidateVotes%±
Labour Yvonne Mosquito 6,403 74.1 Increase2.svg 14.5
Conservative John Turner 964 11.2Increase2.svg 2.0
Green Janet Assheton 611 7.1Increase2.svg 1.1
Liberal Democrat Shazad Iqbal 574 6.6Decrease2.svg 17.7
Patriotic Socialist Party John McAuliffe 88 1.0N/A
Majority 4,439 62.9
Turnout 8,640
Labour hold Swing Increase2.svg 6.3

Northfield

Northfield 2015
PartyCandidateVotes%±
Conservative Debbie Clancy 4,705 39.7 Decrease2.svg 2.3
Labour Robbie Lea-Trengrouse 4,033 34.0Decrease2.svg 7.2
UKIP Clair Braund 2,068 17.5N/A
Green Susan Pearce 517 4.4Decrease2.svg 0.9
Liberal Democrat Andy Moles 436 3.7Decrease2.svg 1.3
TUSC Clive Walder 78 0.7N/A
Majority 672 5.7
Turnout 11,837
Conservative hold Swing Increase2.svg 2.5

Oscott

Oscott 2015
PartyCandidateVotes%±
Labour Keith Linnecor 4,268 42.3 Decrease2.svg 15.7
Conservative Graham Green 2,822 27.9Decrease2.svg 0.9
UKIP Roger Tempest 2,382 23.6N/A
Liberal Democrat Nick Jolliffe 285 2.8Decrease2.svg 0.8
Green Harry Eyles 253 2.5Decrease2.svg 0.4
TUSC Brian Beddowes 91 0.9N/A
Majority 1,446 14.4
Turnout 10,101
Labour hold Swing Decrease2.svg 7.4

Perry Barr

Perry Barr 2015
PartyCandidateVotes%±
Liberal Democrat Jon Hunt 4,161 41.7 Decrease2.svg 4.7
Labour Sarfraiz Hussain 3,484 34.9Decrease2.svg 5.9
Conservative Alain Hurst 1,055 10.6Decrease2.svg 1.4
UKIP Charles Douglas 1,033 10.3N/A
Green Seth Atkin 246 2.5N/A
Majority 677 6.8
Turnout 9,979
Liberal Democrat hold Swing Increase2.svg 0.6

Quinton

Quinton 2015
PartyCandidateVotes%±
Labour John Clancy 4,828 44.6 Decrease2.svg 5.7
Conservative Georgina Chandler 3,684 34.1Decrease2.svg 4.6
UKIP Martin Barrett 1,423 13.1N/A
Green Peter Beck 491 4.5Increase2.svg 0.8
Liberal Democrat Ian Garrett 341 3.2Decrease2.svg 1.0
TUSC Nick Hart 55 0.5N/A
Majority 1,144 10.5
Turnout 10,822
Labour hold Swing Decrease2.svg 0.6

Selly Oak

Selly Oak 2015
PartyCandidateVotes%±
Labour Co-op Brigid Jones 4,160 45.5 Increase2.svg 1.9
Conservative Monica Hardie 2,225 22.7Increase2.svg 4.8
Liberal Democrat Colin Green 1,484 15.2Decrease2.svg 9.9
Green Joe Rooney 1,189 12.2Increase2.svg 3.1
UKIP Sylvia Tempest-Jones 602 6.2Increase2.svg 2.8
TUSC Keturah Prendergast 122 1.2N/A
Majority 1,935 19.8
Turnout 9,782
Labour Co-op hold Swing Decrease2.svg 1.5

Shard End

Shard End 2015
PartyCandidateVotes%±
Labour Ian Ward 3,931 45.0 Decrease2.svg 10.9
UKIP Iain Roden 2,594 29.7Increase2.svg 20.7
Conservative Suzanne Webb 1,654 18.9Decrease2.svg 1.2
Liberal Democrat Christopher Barber 327 3.7Decrease2.svg 0.1
Green Christopher Nash 241 2.7Decrease2.svg 0.9
Majority 1,337 15.3
Turnout 8,747
Labour hold Swing Decrease2.svg 15.8

Sheldon

Sheldon 2015
PartyCandidateVotes%±
Liberal Democrat Paul Tilsley 3,952 41.2 Decrease2.svg 11.5
Labour Bob Collins 2,247 23.4Decrease2.svg 2.3
UKIP David Bridges 1,852 19.3Increase2.svg 13.5
Conservative Barry Theocharides 1,250 13.1Increase2.svg 4.8
Green Lewis Mughal 189 2.0Increase2.svg 0.5
TUSC Mark Andrews 97 1.0N/A
Majority 1,705 17.8
Turnout 9,587
Liberal Democrat hold Swing Decrease2.svg 4.6

Soho

Soho 2015
PartyCandidateVotes%±
Labour Sybil Spence 7,321 77.9 Increase2.svg 6.2
Conservative Robert Higginson 1,091 11.6Increase2.svg 4.6
Green Margaret Okole 505 5.4Increase2.svg 2.1
Liberal Democrat Majid Hussain 483 5.1Decrease2.svg 12.3
Majority 6,230 66.3
Turnout 9,400
Labour hold Swing Increase2.svg 0.8

South Yardley

South Yardley 2015
PartyCandidateVotes%±
Labour Nawaz Ali 4,682 41.6 Decrease2.svg 2.7
Liberal Democrat Daphne Gaved 3,790 33.6Decrease2.svg 7.8
UKIP Graham Duffen 1,488 13.2Increase2.svg 7.1
Conservative Pervez Akhtar 887 7.9Increase2.svg 3.1
Green Paul Holloway 322 2.8Decrease2.svg 0.1
TUSC Siobhan Friel 98 0.9N/A
Majority 892 8.0
Turnout 11,267
Labour hold Swing Increase2.svg 2.6

Sparkbrook

Sparkbrook 2015
PartyCandidateVotes%±
Labour Tony Kennedy 8,599 77.5 Increase2.svg 28.0
Liberal Democrat Seleen Hussein 1,285 11.6Increase2.svg 5.2
Conservative Andrew May 654 5.9Increase2.svg 3.1
Green James Mckears 553 5.0 +Increase2.svg 2.8
Majority 7,314 65.9Increase2.svg 55.0
Turnout 11,091
Labour hold Swing Increase2.svg 11.4

Springfield

Springfield 2015
PartyCandidateVotes%±
Labour Habib Rehman 7,060 61.2 Increase2.svg 7.2
Liberal Democrat Tanveer Chouxhry 2,836 24.6Increase2.svg 1.7
Conservative Tom Huxley 1,129 9.8Increase2.svg 4.0
Green Seeyam Brijmohun 515 4.5Increase2.svg 1.7
Majority 4,224 36.6Increase2.svg 5.5
Turnout 11,540
Labour hold Swing Increase2.svg 2.8

Stechford and Yardley North

Stechford and Yardley North 2015
PartyCandidateVotes%±
Labour Basharat Dad 3,567 35.6 Steady2.svg
Liberal Democrat Colin Jones 3,354 33.5Decrease2.svg 8.8
UKIP Paul Clayton 1,766 17.6Increase2.svg 8.3
Conservative Robert Clark 982 9.8Increase2.svg 0.1
Green Grant Bishop 269 2.7Increase2.svg 0.4
TUSC Laura Cross 87 0.9N/A
Majority 213 2.1Decrease2.svg 4.5
Turnout 10,025
Labour gain from Liberal Democrat Swing Increase2.svg 4.4

Stockland Green

Stockland Green 2015
PartyCandidateVotes%±
Labour Mick Finnegan 4,649 54.3 Decrease2.svg 0.9
Conservative Rachel Toussaint 2,053 24.0Decrease2.svg 5.7
UKIP Mike Kemble 1,061 12.4N/A
Liberal Democrat Franklyn Aaron 414 4.8Decrease2.svg 1.8
Green Sara Myers 389 4.5Increase2.svg 0.7
Majority 2,596 30.3Increase2.svg 4.9
Turnout 8,566
Labour hold Swing Increase2.svg 2.4

Sutton Four Oaks

Sutton Four Oaks 2015
PartyCandidateVotes%±
Conservative Maureen Cornish 8,393 62.0 Decrease2.svg 7.9
Labour Nick Preston 1,926 14.2Increase2.svg 0.5
UKIP Brendan Padmore 1,827 13.5N/A
Liberal Democrat Hubert Duffy 803 5.9Decrease2.svg 2.2
Green David Ratcliff 596 4.4Decrease2.svg 3.2
Majority 6,467 47.7Decrease2.svg 8.5
Turnout 13,545
Conservative hold Swing Decrease2.svg 4.2

Sutton New Hall

Due to a by-election the top two candidates were elected.

Sutton New Hall 2015 (2)
PartyCandidateVotes%±
Conservative David Barrie 6,889
Conservative Alex Yip 4,832
UKIP Stuart Connolly 2,750
Labour Ian Brindley 2,373
Labour Frank Ray 1,819
Green Colin Marriott 891
Liberal Democrat Gareth Hardy 636
Liberal Democrat Trevor Holtom 585
Majority
Turnout
Conservative hold Swing

Sutton Trinity

Sutton Trinity 2015
PartyCandidateVotes%±
Conservative David Pears 5,990 47.3 Decrease2.svg 10.6
Labour Roger Barley 2,699 21.3Decrease2.svg 4.7
UKIP Marcus Brown 2,577 20.4N/A
Liberal Democrat Sally Lippiatt 830 6.6Decrease2.svg 2.5
Green Richard Winter 565 4.5Decrease2.svg 1.8
Majority 3,291 26.0Decrease2.svg 8.0
Turnout 12,661
Conservative hold Swing Decrease2.svg 3.0

Sutton Vesey

Sutton Vesey 2015
PartyCandidateVotes%±
Conservative Lyn Collin 5,942 46.2 Decrease2.svg 2.8
Labour Manish Puri 4,268 33.2Decrease2.svg 6.3
UKIP Albert Meehan 1,627 12.6N/A
Liberal Democrat Lynn Williams 569 4.4Decrease2.svg 1.1
Green Max Ramsay 464 3.6N/A
Majority 1,674 13.0Increase2.svg 3.5
Turnout 12,870
Conservative hold Swing Increase2.svg 1.8

Tyburn

Tyburn 2015
PartyCandidateVotes%±
Labour Mike Sharpe 3,720 43.6 Decrease2.svg 9.2
Conservative Cilfton Welch 2,088 24.5Increase2.svg 2.7
UKIP Andrew Garcarz 1,894 22.2N/A
Liberal Democrat Ann Holtom 550 6.5Decrease2.svg 13.8
Green Alex Wright 206 2.4Decrease2.svg 1.8
TUSC James Redfren 69 0.8N/A
Majority 1,632 19.1Decrease2.svg 11.9
Turnout 8,527
Labour hold Swing Decrease2.svg 6.0

Washwood Heath

Washwood Heath 2015
PartyCandidateVotes%±
Labour Ansar Khan 9,200 78.4 Decrease2.svg 10.0
Liberal Democrat Shamsur Rehman 1,395 11.9Increase2.svg 7.4
Conservative Cameron Hughes 615 5.2Increase2.svg 2.4
Green John Bentley 525 4.5Increase2.svg 2.3
Majority 7,805 66.5Decrease2.svg 17.9
Turnout 11,735
Labour hold Swing Decrease2.svg 8.7

Weoley

Weoley 2015
PartyCandidateVotes%±
Labour Steve Booton 4,118 40.4 Decrease2.svg 1.1
Conservative Jayne Freeman 3,519 34.6Decrease2.svg 7.1
UKIP Tony Hayes 1,641 16.1N/A
Green Anna Masters 494 4.7Decrease2.svg 0.3
Liberal Democrat Steven Haynes 412 4.0Decrease2.svg 2.4
Majority 599 5.9N/A
Turnout 10,184
Labour gain from Conservative Swing Increase2.svg 3.0

Related Research Articles

Liverpool City Council Local government body in England

Liverpool City Council is the governing body for the city of Liverpool in Merseyside, England. It consists of 90 councillors, three for each of the city's 30 wards.

Birmingham Hodge Hill (UK Parliament constituency) Parliamentary constituency in the United Kingdom

Birmingham, Hodge Hill is a constituency of part of the city of Birmingham represented in the House of Commons of the UK Parliament since 2004 by Liam Byrne of the Labour Party.

The 1999 Wyre Forest District Council election took place on 6 May 1999 to elect members of Wyre Forest District Council in Worcestershire, England. One third of the council was up for election and the Labour party lost overall control of the council to no overall control.

The 1998 Worcester City Council election took place on 7 May 1998 to elect members of Worcester District Council in Worcestershire, England. One third of the council was up for election and the Labour party stayed in overall control of the council.

The 2003 Worcester City Council election took place on 1 May 2003 to elect members of Worcester District Council in Worcestershire, England. One third of the council was up for election and the Conservative party gained overall control of the council from no overall control.

2010 Birmingham City Council election

The 2010 Birmingham City Council Election took place on 6 May 2010 to elect members of Birmingham City Council in the West Midlands, England. One third of the council was up for election, one seat in each of the city's 40 council wards, with the election taking place at the same time as the general election.

The 2000 Sandwell Metropolitan Borough Council election took place on 4 May 2000 to elect members of Sandwell Metropolitan Borough Council in the West Midlands, England. One third of the council was up for election and the Labour party stayed in overall control of the council.

The 2002 Sandwell Metropolitan Borough Council election took place on 2 May 2002 to elect members of Sandwell Metropolitan Borough Council in the West Midlands, England. One third of the council was up for election and the Labour party stayed in overall control of the council.

2008 Sandwell Metropolitan Borough Council election

The 2008 Sandwell Metropolitan Borough Council election took place on 1 May 2008 to elect members of Sandwell Metropolitan Borough Council in the West Midlands, England. One third of the council was up for election and the Labour party stayed in overall control of the council.

2011 Sandwell Metropolitan Borough Council election

The 2011 Sandwell Metropolitan Borough Council election took place on 5 May 2011 to elect members of Sandwell Metropolitan Borough Council in the West Midlands, England. One third of the council was up for election and the Labour party stayed in overall control of the council.

2014 Birmingham City Council election

The 2014 Birmingham City Council election took place on 22 May 2014 to elect members of Birmingham City Council in England. This was on the same day as other local elections.

2014 Plymouth City Council election

The 2014 Plymouth City Council election took place on 22 May 2014 to elect members of Plymouth City Council in England. This was on the same day as other local elections. The election was won by the Labour Party, who maintained their overall majority. The UK Independence Party gained representation on the council for the first time, and this was the only election in which the party won seats in Plymouth.

The by-thirds 2015 Rotherham Metropolitan Borough Council election took place on Thursday 7 May 2015, to elect approximately one third of the members of the Rotherham Metropolitan Borough Council in England as part of the United Kingdom local elections, 2015 held on the same day as the general election. All seats contested at this election were last contested in 2011, and of these, 20 were held by Labour Party councillors.

2015 City of Bradford Metropolitan District Council election

The 2015 City of Bradford Metropolitan District Council election took place on 7 May 2015. This was on the same day as other local elections and a general election. One councillor was elected in each ward for a four-year term so the councillors elected in 2015 last stood for election in 2011. Each ward is represented by three councillors, the election of which is staggered, so only one third of the councillors were elected in this election. Labour retained overall control of the council.

2015 Calderdale Metropolitan Borough Council election

The 2015 Calderdale Metropolitan Borough Council election took place on 7 May 2015 to elect members of Calderdale in England. This was on the same day as other local elections and a general election. One councillor was elected in each ward for a four-year term so the councillors elected in 2015 last stood for election in 2011. Each ward is represented by three councillors, the election of which is staggered, so only one third of the councillors were elected in this election. Before the election there was no overall control with a minority Labour administration which was over-ruled at a Budget vote by a coalition of Conservatives & Liberal Democrats leading to a Conservative minority administration. After the election there was still no overall control & a Labour minority administration was formed again.

2015 Manchester City Council election

Elections to Manchester City Council were held on 7 May 2015, along with the United Kingdom general election, 2015. One third of the council was up for election, with each successful candidate serving a four-year term of office, expiring in 2019. The Labour Party retained overall control of the council, managing to hold every seat contested.

2015 Blackpool Borough Council election

The 2015 Blackpool Borough Council election took place on 7 May 2015 to elect members of Blackpool Borough Council in England. All 21 wards of 2 seats each on the council were contested with newly elected members next due to serve a four-year term and next contest their seats in 2019. The council is made up oThis election took place on the same day as other local elections as well as the 2015 UK General Election.

2016 Manchester City Council election

Elections to Manchester City Council were held on 5 May 2016. One third of the council was up for election, with each successful candidate serving a four-year term of office, expiring in 2020. The Labour Party retained overall control of the council, managing to hold all but one seat contested and won by former Withington MP, John Leech. Leech's win signified the first gain for any party in Manchester other than Labour for the first time in six years.

References

  1. "2015 Local Election Results". Birmingham City Council . Retrieved 16 February 2016.
  2. "Elections Results 2011" (PDF). Birmingham City Council . Retrieved 16 February 2016.