Blackpool Borough Council election, 2015

Last updated

The 2015 Blackpool Borough Council election took place on 7 May 2015 to elect members of Blackpool Borough Council in England. [1] All 21 wards of 2 seats each on the council were contested with newly elected members next due to serve a four-year term and next contest their seats in 2019. The council is made up oThis election took place on the same day as other local elections as well as the 2015 UK General Election.

Blackpool Council

Blackpool Council is the local authority of Blackpool, Lancashire, England. It is a unitary authority, having the powers of a non-metropolitan county and district council combined.

Contents

The Labour Party retained an overall control on the council, winning 29 of the 42 seats on the council. The Conservative Party won the remaining 13 seats, wiping out the Liberal Democrats.

Map of Blackpool showing the results of the 2015 local election Blackpool local election map 2015.png
Map of Blackpool showing the results of the 2015 local election

Result

Blackpool Borough Council Election Result 2015
PartySeatsGainsLossesNet gain/lossSeats %Votes %Votes+/−
  Labour 29 2 0 +2 69.05 43.58 46,672 -6.62%
  Conservative 13 0 1 -1 30.95 39.13 41,904 -2.27%
  UKIP 0 0 0 0 0 13.73 14,703 +11.73%
  Liberal Democrat 0 0 1 -1 0 1.63 1,750 -3.57%
  Green 0 0 0 0 0 1.50 1,606 +1.40%
  Independent 0 0 0 0 0 0.25 269 -0.85%
  TUSC 0 0 0 0 0 0.18 193N/A

A total of 107,097 votes were cast, with 345 ballots being spoilt. The turnout was 58.14%.

Council Composition

Prior to the election the composition of the council was:

27141
LabourConservativeLib Dem

After the election, the composition of the council was:

2913
LabourConservative

Lib Dem - Liberal Democrats

Ward Results

Asterisks denote incumbent Councillors seeking re-election. All results are listed below: [2]

Anchorsholme

Anchorsholme (2 Seats)
PartyCandidateVotes%±
Conservative Paul David Stuart Galley* 1,879 30.12 +6.65
Conservative Tony Williams* 1,620 25.97 +0.48
Labour John Bamborough 1,054 16.90 -3.67
Labour Jane Hugo 1,048 16.80 -1.92
UKIP Jaqueline Georgina Margaret Sidwell 637 10.21N/A
Majority 566 9.07
Turnout 6,238 67.23 +19.53
Conservative hold Swing

Bispham

Bispham (2 Seats)
PartyCandidateVotes%±
Conservative Don Clapham* 1,559 27.00 -3.53
Conservative Colin Alan Maycock 1,144 19.81 -7.59
Labour John Hawkins-Arkwright 1,121 19.41 +0.30
Labour Nita Doreen 839 14.53 -2.99
UKIP Sandra Patricia Braithwaite 787 13.63N/A
Green Gordon Stuart Anthony Sinclair 325 5.62N/A
Majority 23 0.40
Turnout 5,775 66.01 24.31
Conservative hold Swing

Bloomfield

Bloomfield (2 Seats)
PartyCandidateVotes%±
Labour Graham Cain* 1,045 29.62 -3.17
Labour John Jones 902 25.57 -4.44
UKIP Liam James Jan Bleeker 585 16.58 +10.44
Conservative Mandy Louise Cunliffe 463 13.12 +0.68
Conservative Annemarie Slack 294 8.33 -2.56
Green Phil Armstrong 202 5.73N/A
Independent Olga Helena Krzyzaniak 37 1.05N/A
Majority 317 8.99
Turnout 3,528 45.44 +18.94
Labour hold Swing
Labour hold Swing

Brunswick

Brunswick (2 Seats)
PartyCandidateVotes%±
Labour Gary Ian Coleman* 1,187 26.57 -5.16
Labour Simon Howard Blackburn* 1,181 26.43 -5.00
Conservative Joey Blower 642 14.37 +0.23
Conservative Shirley Margaret Tracy Anne Cantrell 626 14.01 +0.98
UKIP Colin Porter 432 9.67 +4.27
UKIP Joanna Jones Trafford 358 8.01 +2.74
Independent Marek Marian Radomski 42 0.94N/A
Majority 539 12.06
Turnout 4,468 51.88 +18.08
Labour hold Swing
Labour hold Swing

Claremont

Claremont (2 Seats)
PartyCandidateVotes%±
Labour Ivan John Taylor* 1,276 28.96 -5.22
Labour Lynne Suzanne Williams 1,035 23.49 +8.51
Conservative Geraldine Anne Brown 584 13.26 -1.66
Conservative Fred Winston Barnes 563 12.78 -1.11
UKIP Alex Ewan 519 11.78N/A
Green Gary Michael Richardson 215 4.88N/A
Liberal Democrat Sue Close 168 3.81 -1.20
Independent Jaguar Man 46 1.04N/A
Majority 451 10.23
Turnout 4,406 48.84 +20.54
Labour hold Swing
Labour hold Swing

Clifton

Clifton (2 Seats)
PartyCandidateVotes%±
Labour Adrian Leonard Hutton 1,315 28.62 +0.71
Labour Luke Taylor 1,074 23.37 -10.02
UKIP John Edward Braithwaite 823 17.91N/A
Conservative Bev Ramsden 732 15.93 -1.44
Conservative Phil Ramsden 651 14.17 -0.38
Majority 251 5.46
Turnout 4,595 54.12 +19.22
Labour hold Swing
Labour hold Swing

Greenlands

Greenlands (2 Seats)
PartyCandidateVotes%±
Labour Chris Ryan* 1,280 23.91 +2.51
Labour Christine Elizabeth Wright* 1,191 22.25 +0.65
Conservative Angela Immacolata Brown 1,129 21.09 +2.09
Conservative Vince McNulty 1,061 19.82 -0.68
UKIP Danny Fox 692 12.93 +6.43
Majority 62 1.16
Turnout 5,353 60.89 +20.49
Labour hold Swing
Labour hold Swing

Hawes Side

Hawes Side (2 Seats)
PartyCandidateVotes%±
Labour Debbie Coleman 1,287 25.62 -8.98
Labour Kim Elizabeth Critchley 1,204 23.97 -8.73
Conservative Vicky Cunningham 713 14.19 -2.91
Conservative Andy Miller 686 13.66 -0.74
UKIP Debbie Jane Brailsford 610 12.14N/A
UKIP Barry Anthony Wells 523 10.41N/A
Majority 491 9.78
Turnout 5,023 52.43 +17.03
Labour hold Swing
Labour hold Swing

Highfield

Highfield (2 Seats)
PartyCandidateVotes%±
Labour Peter Hunter 1,374 24.53 +1.23
Conservative Lily Henderson 1,233 22.01 -1.89
Conservative Graham James Baker 1,150 20.53 -0.87
Labour James John Sorah 1,110 19.81 +0.51
UKIP Lee David White 735 13.12N/A
Majority 83 1.48
Turnout 5,353 61.54 22.94
Labour hold Swing
Conservative hold Swing

Ingthorpe

Ingthorpe (2 Seats)
PartyCandidateVotes%±
Labour Kath Rowson* 1,438 25.11 -1.83
Labour Amy Louise Cross* 1,363 24.42 -0.28
Conservative Michael Dillon 1,236 22.15 +6.75
Conservative Matthew John Morris 869 15.57 +0.17
UKIP Susan Howlett 675 12.09N/A
Majority 127 2.27
Turnout 5,581 62.83 +20.43
Labour hold Swing
Labour hold Swing

Layton

Layton (2 Seats)
PartyCandidateVotes%±
Labour Kathryn Mary Benson 1,218 25.57 -3.13
Labour Martin Mitchell* 998 20.95 -3.25
Conservative John Ridyard 966 20.28 +1.72
Conservative Sue Ridyard 931 19.54 -1.96
UKIP Steve Werry 561 11.78N/A
TUSC Philip Watt 90 1.89N/A
Majority 32 0.67
Turnout 4,764 57.50 +18.50
Labour hold Swing
Labour hold Swing

Marton

Marton (2 Seats)
PartyCandidateVotes%±
Labour Jim Elmes 1,422 25.22 +1.22
Labour Vikki Irene Singleton 1,166 20.68 -4.72
Conservative Roger Stansfield 1,136 20.15 -5.55
Conservative Duncan James Stirling Whitehead 1,101 19.53 -1.47
UKIP Paul Michael Nield 813 14.42N/A
Majority 30 0.53
Turnout 5,638 61.52 +22.82
Labour gain from Conservative Swing
Labour hold Swing

Cllr Elmes previously stood as a candidate in 2011 but was not elected.

Norbeck

Norbeck (2 Seats)
PartyCandidateVotes%±
Conservative Maxine Callow* 1,866 28.81 -2.69
Conservative Peter Callow* 1,839 28.39 -3.11
Labour Neil Timothy Brookes 1,089 16.81 -2.19
Labour Rex George Langford 985 15.21 -2.79
UKIP Catherine Grimbilakos 699 10.79N/A
Majority 750 11.58
Turnout 6,478 68.97 +20.97
Conservative hold Swing

Park

Park (2 Seats)
PartyCandidateVotes%±
Labour Gillian Campbell* 1,485 29.58 -0.72
Labour Maria Lilian Kirkland 1,258 25.05 -5.25
Conservative Brian Lawrence Coope 932 18.56 -3.34
Conservative Karen Coope 794 15.81 -1.79
UKIP John Hilston Bebbington 552 10.99N/A
Majority 326 6.49
Turnout 5,021 55.11 +17.81
Labour hold Swing
Labour hold Swing

Squires Gate

Squires Gate (2 Seats)
PartyCandidateVotes%±
Conservative Christian John Cox* 1,279 24.15 +3.05
Labour Alistair James Duncan Humphreys 804 15.18 -1.22
Conservative Gerard John Sean Walsh 802 15.15 -1.65
Labour Ben Singleton 775 14.64 -1.36
UKIP Paul Martin White 668 12.62N/A
Liberal Democrat Douglas Henry Green* 608 11.48 -6.42
Liberal Democrat Bill Greene 359 6.78 -5.02
Majority 2 0.03
Turnout 5,295 63.32 +23.02
Conservative hold Swing
Labour gain from Liberal Democrat Swing

Stanley

Stanley (2 Seats)
PartyCandidateVotes%±
Conservative Jason Roberts 1,468 26.11 +1.51
Conservative Andrew Charles Stansfield* 1,355 24.10 +1.90
Labour Pamela Ann Jackson 1,026 18.25 -3.25
Labour Robert Wood 806 14.34 -5.46
UKIP Martin Bleeker 756 13.45 +8.25
Liberal Democrat Irene Greene 211 3.75 +1.75
Majority 329 5.85
Turnout 5,622 63.40 +20.00
Conservative hold Swing

Talbot

Talbot (2 Seats)
PartyCandidateVotes%±
Labour Ian Coleman 1,145 26.67 -2.33
Labour Mark Peter Smith* 981 22.85 -4.95
Conservative Charlie Docherty 796 18.54 -4.16
Conservative Billy Cloughin 756 17.61 -2.11
UKIP Jordan Braithwaite 512 11.93N/A
TUSC Stephen Troy 103 2.40N/A
Majority 185 4.31
Turnout 4,293 50.88 +20.98
Labour hold Swing
Labour hold Swing

Tyldesley

Tyldesley (2 Seats)
PartyCandidateVotes%±
Labour Edward George Collett* 1,145 23.50 +8.10
Labour Allan Mathews* 1,145 23.50 +7.20
Conservative Moira Stephanie Graham 872 17.90 -1.20
Conservative Adam Philip McCance 741 15.21 -3.29
UKIP Kim Sherrie Knight 658 13.51N/A
Liberal Democrat Paul Richard Hindley 167 3.43N/A
Independent Mark Earnest Tugwood 144 2.96N/A
Majority 273 5.60
Turnout 4,872 55.40 +19.80
Labour hold Swing
Labour hold Swing

Victoria

Victoria (2 Seats)
PartyCandidateVotes%±
Labour Fred Jackson* 1,209 27.74 -9.36
Labour David Owen* 966 22.16 -10.94
UKIP Terry Knight 735 16.86 +1.06
Conservative Mark Courtney Massey 636 14.59 +0.59
Conservative Tony Jones 539 12.37N/A
Green Gina Eastwood 274 6.29N/A
Majority 231 5.30
Turnout 4,359 51.65 +17.95
Labour hold Swing
Labour hold Swing

Warbeck

Warbeck (2 Seats)
PartyCandidateVotes%±
Conservative Tony Brown* 1,237 22.94 -2.66
Conservative Danny Scott 1,197 22.20 -2.70
Labour David Collett 962 17.84 +0.84
Labour Matthew Haynes 876 16.25 +0.35
UKIP Warwick Charles Stockman Howlett 633 11.74 +6.64
Green Kathryn Sinclair 250 4.64 +1.54
Liberal Democrat Kevin Michael Benfold 237 4.40 -0.7
Majority 235 4.36
Turnout 5,392 62.98 +25.58
Conservative hold Swing

Waterloo

Waterloo (2 Seats)
PartyCandidateVotes%±
Conservative Derek Robertson 1,043 21.76 -1.74
Labour David O'Hara* 966 20.15 -7.55
Labour Heather O'Hara 921 19.21 -0.29
Conservative Barry Leslie Vernon 784 16.35 -5.15
UKIP Spencer David Shackleton 740 15.44N/A
Green June Irene Daniels 340 7.09N/A
Majority 45 0.94
Turnout 4,794 58.90 +24.30
Conservative hold Swing
Labour hold Swing

Related Research Articles

1998 Bolton Metropolitan Borough Council election

The 1998 Bolton Metropolitan Borough Council election took place on 7 May 1998 to elect members of Bolton Metropolitan Borough Council in Greater Manchester, England. One third of the council was up for election and the Labour party kept overall control of the council.

The 2003 Worthing Borough Council election took place on 1 May 2003 to elect members of Worthing Borough Council in West Sussex, England. One third of the council was up for election and the Liberal Democrats lost overall control of the council to no overall control. Overall turnout was 28.61%.

2007 Woking Borough Council election

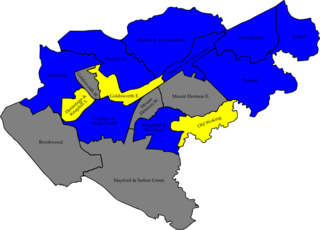
The 2007 Woking Council election took place on 3 May 2007 to elect members of Woking Borough Council in Surrey, England. One third of the council was up for election and the Conservative party gained overall control of the council from no overall control.

2010 Cheltenham Borough Council election

The 2010 Cheltenham Council election took place on 6 May 2010 to elect members of Cheltenham Borough Council in Gloucestershire, England. Half of the council was up for election and the Liberal Democrats stayed in overall control of the council.

2010 Sunderland City Council election

The 2010 Sunderland Council election took place on 6 May 2010 to elect members of Sunderland Metropolitan Borough Council in Tyne and Wear, England. One third of the council was up for election and the Labour party stayed in overall control of the council. The election took place on the same day as the 2010 General Election.

The 1999 Pendle Borough Council election took place on 6 May 1999 to elect members of Pendle Borough Council in Lancashire, England. One third of the council was up for election and the Liberal Democrats lost overall control of the council to no overall control.

2004 Pendle Borough Council election

The 2004 Pendle Borough Council election took place on 10 June 2004 to elect members of Pendle Borough Council in Lancashire, England. One third of the council was up for election and the Liberal Democrats gained overall control of the council from no overall control.

2007 Pendle Borough Council election

The 2007 Pendle Borough Council election took place on 3 May 2007 to elect members of Pendle Borough Council in Lancashire, England. One third of the council was up for election and the Liberal Democrats stayed in overall control of the council.

The 2011 council elections in Guildford saw the Conservatives retain control over Guildford Borough Council with an increased majority of 20 seats. Full results for each ward can be found at Guildford Council election, full results, 2011.

2003 Hertsmere Borough Council election

The 2003 Hertsmere Borough Council election took place on 1 May 2003 to elect members of Hertsmere Borough Council in Hertfordshire, England. One third of the council was up for election and the Conservative party stayed in overall control of the council.

2004 Colchester Borough Council election

The 2004 Colchester Borough Council election took place on 10 June 2004 to elect members of Colchester Borough Council in Essex, England. This was the same day as the other 2004 United Kingdom local elections and as the 2004 European Parliament Elections. One third of the seats were up for election and the council stayed under no overall control.

2012 Pendle Borough Council election

The 2012 Pendle Borough Council election took place on 3 May 2012 to elect members of Pendle Borough Council in Lancashire, England. One third of the council was up for election and the council stayed under no overall control.

2008 Havant Borough Council election

The 2008 Havant Borough Council election took place on 1 May 2008 to elect members of Havant Borough Council in Hampshire, England. One third of the council was up for election and the Conservative party stayed in overall control of the council.

2014 St Helens Metropolitan Borough Council election

The 2014 St Helens Metropolitan Borough Council election took place on 22 May 2014 to elect members of St Helens Metropolitan Borough Council in Merseyside, England. One third of the council was up for election and the Labour party stayed in overall control of the council.

2015 Bolton Metropolitan Borough Council election

The 2015 Bolton Metropolitan Borough Council election were held on 7 May 2015 to elect members of Bolton Metropolitan Borough Council in Greater Manchester, England. This took place on the same day as other local elections

The 2015 Bury Metropolitan Borough Council took place on 7 May 2015 to elect members of the Metropolitan Borough of Bury in England. This was on the same day as other local elections.

2006 Swale Borough Council election

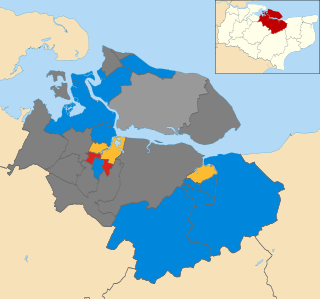
The 2006 Swale Borough Council election took place on 4 May 2006 to elect members of Swale Borough Council in Kent, England. One third of the council was up for election and the Conservative party stayed in overall control of the council.

2008 Swale Borough Council election

The 2008 Swale Borough Council election took place on 1 May 2008 to elect members of Swale Borough Council in Kent, England. One third of the council was up for election and the Conservative party stayed in overall control of the council.

2010 Swale Borough Council election

The 2010 Swale Borough Council election took place on 6 May 2010 to elect members of Swale Borough Council in Kent, England. One third of the council was up for election and the Conservative party stayed in overall control of the council.

2018 Wokingham Borough Council election

The 2018 Wokingham Borough Council election took place on Thursday 3 May 2018. That was the same day as other United Kingdom local elections in order to elect members of Wokingham Unitary Council in Berkshire, England. One third of the council was up for election and the Conservative party stayed comfortably in overall control of the council.

References