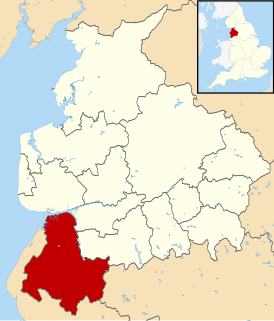
The 2004 West Lancashire District Council election took place on 10 June 2004 to elect members of West Lancashire District Council in Lancashire, England. One third of the council was up for election and the Conservative party stayed in overall control of the council. [1]
West Lancashire is a non-metropolitan district with the status of a borough in Lancashire, England. Its council is based in Ormskirk. The other town in the borough is Skelmersdale. The population of the District taken at the 2011 census was 110,685. The district was formed in 1974 under the Local Government Act 1972, as a merger of Ormskirk and Skelmersdale and Holland urban districts along with part of West Lancashire Rural District and part of the former Wigan Rural District.
Lancashire is a ceremonial county in North West England. The administrative centre is Preston. The county has a population of 1,449,300 and an area of 1,189 square miles (3,080 km2). People from Lancashire are known as Lancastrians.
England is a country that is part of the United Kingdom. It shares land borders with Wales to the west and Scotland to the north-northwest. The Irish Sea lies west of England and the Celtic Sea lies to the southwest. England is separated from continental Europe by the North Sea to the east and the English Channel to the south. The country covers five-eighths of the island of Great Britain, which lies in the North Atlantic, and includes over 100 smaller islands, such as the Isles of Scilly and the Isle of Wight.
After the election, the composition of the council was:
Party | Seats | ± | |
---|---|---|---|
Conservative | 29 | +1 | |
Labour | 25 | -1 |
Before the election the Conservatives held 28 seats compared to 26 for Labour. [3] 18 seats were contested in the election, with 9 seats being defended by each of the 2 parties. [3] As well as candidates from the Conservative and Labour parties, there were also 7 independents, 4 Greens, 1 Liberal Democrat and 1 from the new Ormskirk party. [4] Both the Liberal Democrat and Ormskirk party candidates were standing in Derby ward, which was seen as being one of the critical contests in the election. [4]
The Labour Party is a centre-left political party in the United Kingdom that has been described as an alliance of social democrats, democratic socialists and trade unionists. The party's platform emphasises greater state intervention, social justice and strengthening workers' rights.
The Green Party of England and Wales is a green, left-wing political party in England and Wales. Headquartered in London, since September 2018, its co-leaders are Siân Berry and Jonathan Bartley. The Green Party has one representative in the House of Commons, one in the House of Lords, and three in the European Parliament. In addition, it has various councillors in UK local government and two members of the London Assembly.
The Liberal Democrats are a liberal political party in the United Kingdom. It is currently led by Vince Cable. They have 11 Members of Parliament in the House of Commons, 96 members of the House of Lords, one member of the European Parliament, five Members of the Scottish Parliament and one member in the Welsh Assembly and London Assembly. At the height of its influence, the party formed a coalition government with the Conservative Party from 2010 to 2015 with its leader Nick Clegg serving as Deputy Prime Minister.
A major issue in the election was privatisation, which the Conservatives supported saying it would improve efficiency, however Labour criticised the Conservatives plans saying investment should be kept in the area. [3] The Conservatives called on voters to back their moves to establish litter free zones, create secure leisure facilities for young people and refurbish parks. [4] However Labour attacked plans to sell council housing and the handing of a local park to a private developer. [4] Other issues included crime, anti-social behaviour, CCTV and plans to move the accident and emergency department of Ormskirk hospital to Southport hospital. [5]
Anti-social behaviours are actions that harm or lack consideration for the well-being of others. It has also been defined as any type of conduct that violates the basic rights of another person and any behaviour that is considered to be disruptive to others in society. This can be carried out in various ways, which includes but is not limited to intentional aggression, as well as covert and overt hostility. Anti-social behaviour also develops through social interaction within the family and community. It continuously affects a child's temperament, cognitive ability and their involvement with negative peers, dramatically affecting children's problem solving skills. Many people also label behaviour which is deemed contrary to prevailing norms for social conduct as anti-social behaviour. However, researchers have stated that it is a difficult term to define, particularly in the United Kingdom where there are an infinite number of acts that fall into its category. The term is especially used in British English.
Closed-circuit television (CCTV), also known as video surveillance, is the use of video cameras to transmit a signal to a specific place, on a limited set of monitors. It differs from broadcast television in that the signal is not openly transmitted, though it may employ point to point (P2P), point to multipoint (P2MP), or mesh wired or wireless links. Though almost all video cameras fit this definition, the term is most often applied to those used for surveillance in areas that may need monitoring such as banks, stores, and other areas where security is needed. Though Videotelephony is seldom called 'CCTV' one exception is the use of video in distance education, where it is an important tool.
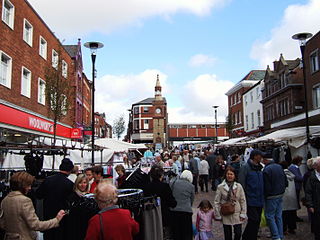
Ormskirk is a market town in West Lancashire, England, 13 miles (21 km) north of Liverpool, 11 miles (18 km) northwest of St Helens, 9 miles (14 km) southeast of Southport and 18 miles (29 km) southwest of Preston. Ormskirk is known for its gingerbread.
The results saw the Conservatives hold on to control of the council after making 1 gain from Labour. [6] This meant the Conservatives held 29 seats compared to 25 for Labour and the election was described as a "vindication of Conservative policies running West Lancs" by the Conservative leader of the council, Geoff Roberts. [6] Meanwhile, Labour's group leader on the council, Alan Bullen, only narrowly held his own seat on the council in Skelmersdale North. [6] Overall turnout in the election was up by 14% at 42.47%. [6]
Skelmersdale is a town in West Lancashire, England, on the River Tawd, 6 miles (10 km) west of Wigan, 13 miles (21 km) northeast of Liverpool and 15 miles (24 km)southwest of Preston. In 2006, it had a population of 38,813. The town is known locally as Skem.
Voter turnout is the percentage of eligible voters who cast a ballot in an election. Eligibility varies by country, and the voting-eligible population should not be confused with the total adult population. Age and citizenship status are often among the criteria used to determine eligibility, but some countries further restrict eligibility based on sex, race, or religion.
Party | Seats | Gains | Losses | Net gain/loss | Seats % | Votes % | Votes | +/− | |
---|---|---|---|---|---|---|---|---|---|
Conservative | 10 | 1 | 0 | +1 | 55.6 | 47.4 | 13,309 | +1.3% | |
Labour | 8 | 0 | 1 | -1 | 44.4 | 36.9 | 10,346 | -3.0% | |
Independent | 0 | 0 | 0 | 0 | 0 | 10.6 | 2,979 | -0.5% | |
Green | 0 | 0 | 0 | 0 | 0 | 3.3 | 937 | +0.4% | |
Ormskirk Party | 0 | 0 | 0 | 0 | 0 | 1.1 | 298 | +1.1% | |
Liberal Democrat | 0 | 0 | 0 | 0 | 0 | 0.7 | 190 | +0.7% |
Party | Candidate | Votes | % | ± | |
---|---|---|---|---|---|
Labour | Donna Duffy | 911 | 57.4 | +4.3 | |
Independent | Patrick McElhinney | 347 | 21.9 | -7.6 | |
Conservative | David Meadows | 330 | 20.8 | +3.4 | |
Majority | 564 | 35.5 | +11.9 | ||
Turnout | 1,588 | 33.4 | +14.7 | ||
Labour hold | Swing |
Party | Candidate | Votes | % | ± | |
---|---|---|---|---|---|
Conservative | Una Atherley | 1,725 | 77.4 | +16.7 | |
Labour | David McKay | 503 | 22.6 | -16.7 | |
Majority | 1,222 | 54.8 | +33.4 | ||
Turnout | 2,228 | 49.4 | +15.4 | ||
Conservative hold | Swing |
Party | Candidate | Votes | % | ± | |
---|---|---|---|---|---|
Labour | Mary Pendleton | 676 | 81.0' | -3.6 | |
Conservative | Susan Cropper | 159 | 19.0 | +3.6 | |
Majority | 517 | 62.0 | -7.2 | ||
Turnout | 835 | 27.8 | +14.9 | ||
Labour hold | Swing |
Party | Candidate | Votes | % | ± | |
---|---|---|---|---|---|
Conservative | Florence Westley | 900 | 60.6 | ||
Labour | Anne Carter | 584 | 39.4 | ||
Majority | 316 | 21.2 | |||
Turnout | 1,484 | 49.7 | |||
Conservative hold | Swing |
Party | Candidate | Votes | % | ± | |
---|---|---|---|---|---|
Labour | Cynthia Dereli | 832 | 52.2 | ||
Conservative | Graham Jones | 763 | 47.8 | ||
Majority | 69 | 4.4 | |||
Turnout | 1,595 | 41.6 | |||
Labour hold | Swing |
Party | Candidate | Votes | % | ± | |
---|---|---|---|---|---|
Conservative | Adrian Owens | 987 | 45.5 | -2.0 | |
Labour | Alan Williams | 550 | 25.3 | -16.3 | |
Ormskirk Party | Margaret Heslegrave | 298 | 13.7 | +13.7 | |
Liberal Democrat | Julian Reid | 190 | 8.8 | +8.8 | |
Green | Anne Doyle | 146 | 6.7 | -4.1 | |
Majority | 437 | 20.2 | +14.3 | ||
Turnout | 2,171 | 47.0 | +18.8 | ||
Conservative hold | Swing |
Party | Candidate | Votes | % | ± | |
---|---|---|---|---|---|
Labour | Terence Aldridge | 710 | 72.9 | -2.6 | |
Independent | Alan Spears | 147 | 15.1 | +0.9 | |
Conservative | Irene O'Donnell | 117 | 12.0 | +1.7 | |
Majority | 563 | 57.8 | -3.5 | ||
Turnout | 974 | 31.0 | +14.6 | ||
Labour hold | Swing |
Party | Candidate | Votes | % | ± | |
---|---|---|---|---|---|
Conservative | Doreen Stephenson | 459 | 55.4 | -18.4 | |
Independent | Raymond Brookfield | 370 | 44.6 | +44.6 | |
Majority | 89 | 10.8 | -36.8 | ||
Turnout | 829 | 47.0 | |||
Conservative hold | Swing |
Party | Candidate | Votes | % | ± | |
---|---|---|---|---|---|
Conservative | Martin Forshaw | 820 | 63.8 | ||
Independent | Nadine Ashcroft | 466 | 36.2 | ||
Majority | 354 | 27.6 | |||
Turnout | 1,286 | 42.8 | |||
Conservative hold | Swing |
Party | Candidate | Votes | % | ± | |
---|---|---|---|---|---|
Conservative | Peter Lea | 1,360 | 61.4 | +4.8 | |
Labour | Francis Williams | 652 | 29.4 | -2.8 | |
Green | John Watt | 204 | 9.2 | -2.0 | |
Majority | 708 | 32.0 | +7.6 | ||
Turnout | 2,216 | 49.2 | +20.8 | ||
Conservative hold | Swing |
Party | Candidate | Votes | % | ± | |
---|---|---|---|---|---|
Labour | Stephen Hanlon | 664 | 82.3 | ||
Conservative | Malcolm Barron | 143 | 17.7 | ||
Majority | 521 | 64.6 | |||
Turnout | 807 | 29.2 | |||
Labour hold | Swing |
Party | Candidate | Votes | % | ± | |
---|---|---|---|---|---|
Conservative | Joan Colling | 609 | 77.7 | +2.4 | |
Labour | Shan Annis | 175 | 22.3 | -2.4 | |
Majority | 434 | 55.4 | +4.8 | ||
Turnout | 784 | 47.3 | |||
Conservative hold | Swing |
Party | Candidate | Votes | % | ± | |
---|---|---|---|---|---|
Conservative | Cyril Ainscough | 1,044 | 48.1 | +10.4 | |
Labour | Noel Delaney | 820 | 37.8 | -0.5 | |
Green | Maurice George | 305 | 14.1 | +4.6 | |
Majority | 224 | 10.3 | |||
Turnout | 2,169 | 47.0 | +14.5 | ||
Conservative gain from Labour | Swing | ||||
Party | Candidate | Votes | % | ± | |
---|---|---|---|---|---|
Labour | Alan Bullen | 531 | 45.7 | -15.4 | |
Independent | Joan Morrison | 473 | 40.7 | +14.2 | |
Conservative | Joan Witter | 157 | 13.5 | +1.0 | |
Majority | 58 | 5.0 | -29.6 | ||
Turnout | 1,161 | 37.4 | +13.9 | ||
Labour hold | Swing |
Party | Candidate | Votes | % | ± | |
---|---|---|---|---|---|
Labour | Sydney Jones | 1,077 | 63.6 | -10.2 | |
Conservative | Richard Shepherd | 334 | 19.7 | +5.5 | |
Green | Martin Lowe | 282 | 16.7 | +4.7 | |
Majority | 743 | 43.9 | -15.7 | ||
Turnout | 1,693 | 33.9 | +15.3 | ||
Labour hold | Swing |
Party | Candidate | Votes | % | ± | |
---|---|---|---|---|---|
Conservative | John Mee | 1,431 | 63.9 | +4.6 | |
Independent | John Hodson | 810 | 36.1 | -4.6 | |
Majority | 621 | 27.8 | +9.2 | ||
Turnout | 2,241 | 50.5 | +13.5 | ||
Conservative hold | Swing |
Party | Candidate | Votes | % | ± | |
---|---|---|---|---|---|
Labour | Margaret Skilling | 1,066 | 48.0 | -7.2 | |
Conservative | Ruth Pollock | 787 | 35.5 | -9.3 | |
Independent | Karen Horrocks | 366 | 16.5 | +16.5 | |
Majority | 279 | 12.5 | +2.1 | ||
Turnout | 2,219 | 45.2 | +14.9 | ||
Labour hold | Swing |
Party | Candidate | Votes | % | ± | |
---|---|---|---|---|---|
Conservative | Peter Gartside | 1,184 | 66.6 | +17.4 | |
Labour | Pauline Bailey | 595 | 33.4 | -17.4 | |
Majority | 589 | 33.2 | |||
Turnout | 1,779 | 52.7 | +15.5 | ||
Conservative hold | Swing |
Liverpool City Council is the governing body for the city of Liverpool in Merseyside, England. It consists of 90 councillors, three for each of the city's 30 wards.
The 2002 West Lancashire District Council election took place on 2 May 2002 to elect members of West Lancashire District Council in Lancashire, England. The whole council was up for election with boundary changes since the last election in 2000 reducing the number of seats by 1. The Conservative party gained overall control of the council from Labour.
The 2003 West Lancashire District Council election took place on 1 May 2003 to elect members of West Lancashire District Council in Lancashire, England. One third of the council was up for election and the Conservative party stayed in overall control of the council.
The 2006 West Lancashire District Council election took place on 4 May 2006 to elect members of West Lancashire District Council in Lancashire, England. One third of the council was up for election and the Conservative party stayed in overall control of the council.
The 2008 West Lancashire District Council election took place on 1 May 2008 to elect members of West Lancashire District Council in Lancashire, England. One third of the council was up for election and the Conservative party stayed in overall control of the council.
The 2008 St Helens Metropolitan Borough Council election took place on 1 May 2008 to elect members of St Helens Metropolitan Borough Council in Merseyside, England. One third of the council was up for election and the council stayed under no overall control.
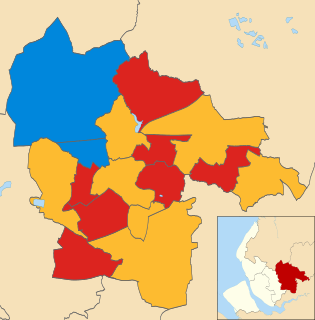
The 2007 St Helens Metropolitan Borough Council election took place on 3 May 2007 to elect members of St Helens Metropolitan Borough Council in Merseyside, England. One third of the council was up for election and the council stayed under no overall control.
The 2008 Halton Borough Council election took place on 1 May 2008 to elect members of Halton Unitary Council in Cheshire, England. One third of the council was up for election and the Labour party stayed in overall control of the council.
The 2004 Winchester Council election took place on 10 June 2004 to elect members of Winchester District Council in Hampshire, England. One third of the council was up for election and the Liberal Democrats lost overall control of the council to no overall control.
The 2002 Halton Borough Council election took place on 2 May 2002 to elect members of Halton Unitary Council in Cheshire, England. One third of the council was up for election and the Labour party stayed in overall control of the council.
The 2004 Halton Borough Council election took place on 10 June 2004 to elect members of Halton Unitary Council in Cheshire, England. The whole council was up for election with boundary changes since the last election in 2002. The Labour party stayed in overall control of the council.
The 2006 Halton Borough Council election took place on 4 May 2006 to elect members of Halton Unitary Council in Cheshire, England. One third of the council was up for election and the Labour party stayed in overall control of the council.
The 2007 West Lancashire District Council election took place on 3 May 2007 to elect members of West Lancashire District Council in Lancashire, England. One third of the council was up for election and the Conservative party stayed in overall control of the council.
The 2010 West Lancashire Borough Council election took place on 6 May 2010 to elect members of West Lancashire Borough Council in Lancashire, England. One third of the council was up for election and the Conservative party stayed in overall control of the council.
The 2004 Fareham Council election took place on 10 June 2004 to elect members of Fareham Borough Council in Hampshire, England. Half of the council was up for election and the Conservative party stayed in overall control of the council.
The 2004 Southampton Council election took place on 10 June 2004 to elect members of Southampton Unitary Council in Hampshire, England. One third of the council was up for election and the council stayed under no overall control.
The 2006 Pendle Borough Council election took place on 4 May 2006 to elect members of Pendle Borough Council in Lancashire, England. One third of the council was up for election and the Liberal Democrats stayed in overall control of the council.
The 2007 Pendle Borough Council election took place on 3 May 2007 to elect members of Pendle Borough Council in Lancashire, England. One third of the council was up for election and the Liberal Democrats stayed in overall control of the council.
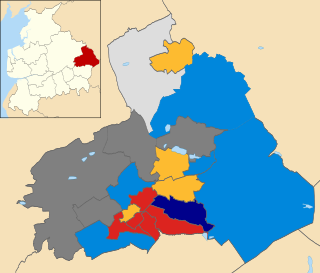
The 2008 Pendle Borough Council election took place on 1 May 2008 to elect members of Pendle Borough Council in Lancashire, England. One third of the council was up for election and the Liberal Democrats lost overall control of the council to no overall control.
The 2012 St Helens Metropolitan Borough Council election took place on 3 May 2012 to elect members of St Helens Metropolitan Borough Council in Merseyside, England. One third of the council was up for election and the Labour party stayed in overall control of the council.