Blackpool Borough Council election, 2003

Last updated

Map of the results of the 2003 Blackpool council election. Labour in red, Conservatives in blue and Liberal Democrats in yellow. Blackpool local election 2003 map.svg
Map of the results of the 2003 Blackpool council election. Labour in red, Conservatives in blue and Liberal Democrats in yellow.

The 2003 Blackpool Borough Council election took place on 1 May 2003 to elect members of the Unitary Blackpool Borough Council in England. The Labour Party kept its overall majority and continued to run the council. Boundary changes had taken place since the last election in 2000 which reduced the number of seats by two. [1] Overall turnout was 50.43%.

Unitary authorities of England top and only level of local government in some parts of England

Unitary authorities of England are local authorities that are responsible for the provision of all local government services within a district. They are constituted under the Local Government Act 1992, which amended the Local Government Act 1972 to allow the existence of counties that do not have multiple districts. They typically allow large towns to have separate local authorities from the less urbanised parts of their counties and provide a single authority for small counties where division into districts would be impractical. Unitary authorities do not cover all of England. Most were established during the 1990s and a further tranche were created in 2009. Unitary authorities have the powers and functions that are elsewhere separately administered by councils of non-metropolitan counties and the non-metropolitan districts within them.

England Country in north-west Europe, part of the United Kingdom

England is a country that is part of the United Kingdom. It shares land borders with Wales to the west and Scotland to the north-northwest. The Irish Sea lies west of England and the Celtic Sea lies to the southwest. England is separated from continental Europe by the North Sea to the east and the English Channel to the south. The country covers five-eighths of the island of Great Britain, which lies in the North Atlantic, and includes over 100 smaller islands, such as the Isles of Scilly and the Isle of Wight.

The Labour Party is a centre-left political party in the United Kingdom which has been described as an alliance of social democrats, democratic socialists and trade unionists. The party's platform emphasises greater state intervention, social justice and strengthening workers' rights.

Contents

Results

Blackpool Local Election Result 2003
PartySeatsGainsLossesNet gain/lossSeats %Votes %Votes+/−
  Labour 25 0 59.52 42.65 42,624
  Conservative 13 -2 30.95 38.56 38,535
  Liberal Democrat 4 0 9.52 16.85 16,834
  Independent 0 0 0 0 0 1.74 1,739
  UKIP 0 0 0 0 0 0.20 200

Ward results

Anchorsholme

Anchorsholme (2) [2]
PartyCandidateVotes%±
Liberal Democrat Jonathon Bamborough1,36023.64
Liberal Democrat Steven Bate1,19620.79
Conservative Donald MacNaughton 886 15.40
Conservative Bryan Anandappa 852 14.81
Labour Alan Haynes 759 13.19
Labour Alice Lilley 700 12.17
Turnout 54.1

Bispham

Bispham (2) [2]
PartyCandidateVotes%±
Conservative Donald Clapham1,55331.05
Conservative Henry Mitchell1,50230.03
Labour John Boughton 805 16.10
Labour Christopher Ryan 739 14.78
Liberal Democrat Morry Hart 399 7.98
Turnout 53.6

Bloomfield

Bloomfield (2) [2]
PartyCandidateVotes%±
Labour Frances Smith82218.73
Labour Simon Blackburn79318.07
Liberal Democrat Doreen Holt 779 17.75
Conservative Barrie Hall 675 15.38
Liberal Democrat Kenneth Coleman 662 15.09
Conservative Michael Chappell 657 14.97
Turnout 43.5

Brunswick

Brunswick (2) [2]
PartyCandidateVotes%±
Labour Maureen Cresswell1,23330.77
Labour Barry Cresswell1,21430.30
Conservative Philip Cartwright 538 13.43
Conservative Brian Hartley Turnbull 502 12.53
Liberal Democrat Nicholas Grainger 320 7.99
UKIP Robert McDowell 200 4.99
Turnout 41

Claremont

Claremont (2) [2]
PartyCandidateVotes%±
Labour Ivan Taylor1,24528.82
Labour Sylvia Taylor1,17727.25
Conservative Linda Cole 744 17.22
Conservative Stephen Houghton 703 16.27
Liberal Democrat Lesley Owens 290 6.71
Independent John Porter 161 3.73
Turnout 42

Clifton

Clifton (2) [2]
PartyCandidateVotes%±
Labour Joan Greenhalgh1,26830.05
Labour Michael Carr1,12026.54
Conservative Christopher Perry 796 18.86
Conservative John McIntosh 680 16.11
Liberal Democrat Stuart Mackie 356 8.44
Turnout 45.4

Greenlands

Greenlands (2) [2]
PartyCandidateVotes%±
Labour Kathryn Benson1,20925.08
Labour Robert Harrison1,14623.78
Conservative Ian Dodd 1,012 21.00
Conservative Molly Laye 1,008 20.91
Liberal Democrat Barbara Bamborough 445 9.23
Turnout 47.9

Hawes Side

Hawes Side (2) [2]
PartyCandidateVotes%±
Labour Norman Hardy1,35228.74
Labour Valerie Haynes1,27427.08
Conservative Linda Richman 831 17.67
Conservative Graham Baker 815 17.33
Liberal Democrat Wendy Smalley 432 9.18
Turnout 47.4

Highfield

Highfield (2) [2]
PartyCandidateVotes%±
Conservative Lily Henderson1,23024.46
Conservative Susan Fowler1,20023.87
Labour Pamela Jackson 989 19.67
Labour Gary Coleman 936 18.62
Liberal Democrat Alan Watkins 673 13.39
Turnout 52

Ingthorpe

Ingthorpe (2) [2]
PartyCandidateVotes%±
Labour Kathleen Rowson1,45930.68
Labour Michael Bradley-Wilcox1,25126.30
Conservative Steven James 825 17.35
Conservative Kenneth Dyke 767 16.13
Liberal Democrat Carole Bate 454 9.55
Turnout 49.1

Layton

Layton (2) [2]
PartyCandidateVotes%±
Labour Susan Wright1,42329.47
Labour Roy Fisher1,37528.47
Conservative Stephen Flanigan 628 13.00
Conservative Marlene McGuirk 598 12.38
Independent Terence Woodings 482 9.98
Liberal Democrat Alma Rollinson 323 6.69
Turnout 47.1

Marton

Marton (2) [2]
PartyCandidateVotes%±
Conservative William Burgess1,35728.18
Conservative James Houldsworth1,26326.23
Labour James Elmes 1,010 20.98
Labour James Sorah 854 17.74
Liberal Democrat Hazel Williams 331 6.87
Turnout 49.5

Norbreck

Norbreck (2) [2]
PartyCandidateVotes%±
Conservative Peter Callow1,83532.80
Conservative Maxine Callow1,80432.25
Labour Roger Cooke 851 15.21
Labour Barbara Wright 726 12.98
Liberal Democrat Donna Bamborough 378 6.76
Turnout 56.1

Park

Park (2) [2]
PartyCandidateVotes%±
Labour Brian Doherty1,07127.31
Labour Leslie Kersh1,05526.91
Conservative Margaret Gough 573 14.61
Conservative Roger Jones 536 13.67
Liberal Democrat Tania Dundavon 411 10.48
Independent Thomas Johnston 275 7.01
Turnout 43

Squires Gate

Squires Gate (2) [2]
PartyCandidateVotes%±
Liberal Democrat Robert Wynne1,41327.11
Liberal Democrat Douglas Green1,15822.21
Conservative Geoffrey Price 793 15.21
Conservative Frank Harris 676 12.97
Labour Gillian Campbell 647 12.41
Labour Nicholas Gradwell 526 10.09
Turnout 52.5

Stanley

Stanley (2) [2]
PartyCandidateVotes%±
Conservative Peter Evans1,21523.61
Conservative Granville Heap1,12821.92
Independent John Finlay 821 15.95
Labour Carol Gradwell 747 14.52
Liberal Democrat Gaynor Wynne 665 12.92
Labour Beverley Harvey 570 11.08
Turnout 53

Talbot

Talbot (2) [2]
PartyCandidateVotes%±
Labour Philip Dunne1,00423.82
Labour Raymond Hutchinson93622.21
Conservative Patricia Mancini 699 16.58
Conservative Peter Watson 670 15.90
Liberal Democrat Alan Duxbury-Campbell 482 11.44
Liberal Democrat Mark Sponder 424 10.06
Turnout 41.3

Tyldesley

Tyldesley (2) [2]
PartyCandidateVotes%±
Labour Allan Matthews1,38729.34
Labour Edward Collett1,29427.37
Conservative Aubery Horne 872 18.44
Conservative Mohamed Hameed 740 15.65
Liberal Democrat Rodney Holt 435 9.20
Turnout 48

Victoria

Victoria (2) [2]
PartyCandidateVotes%±
Labour Frederick Jackson1,10024.16
Labour David Owen99821.92
Liberal Democrat Jacqueline Jackson 732 16.08
Liberal Democrat Peter Wood 652 14.32
Conservative Joan Horne 549 12.06
Conservative Jean Kenrick 522 11.46
Turnout 46.7

Warbreck

Warbreck (2) [2]
PartyCandidateVotes%±
Conservative Joyce Delves1,21024.38
Conservative David Brown1,16623.49
Labour Desmond Harvey 848 17.08
Labour Paul Waugh 813 16.38
Liberal Democrat Anne Heyworth 477 9.61
Liberal Democrat Kevan Benfold 450 9.07
Turnout 47.9

Waterloo

Waterloo (2) [2]
PartyCandidateVotes%±
Conservative Ian Fowler1,02720.72
Labour Carol Radcliffe1,01120.40
Conservative Ronald Bell 895 18.06
Labour Susan Rigby 887 17.89
Liberal Democrat Michael Hodkinson 592 11.94
Liberal Democrat Justin Allitt 545 10.99
Turnout 47.9

Related Research Articles

The 2000 Blackpool Borough Council election took place on 4 May 2000 to elect members of Blackpool Borough Council in England. The whole council was up for election and the Labour party stayed in overall control of the council.

Blackpool is a unitary authority in Lancashire, England. Until 1 April 1998 it was a non-metropolitan district.

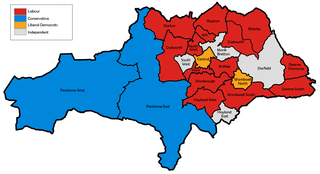
Elections to Hinckley and Bosworth Borough Council were held on 1 May 2003. The whole council was up for election, with boundary changes having taken place since the last election in 1999. The Conservative Party took overall control of the council.

Fylde Borough Council in Lancashire, England is elected every four years. 51 councillors are elected from 21 wards since the last boundary changes in 2003.

Elections to Wyre Borough Council in Lancashire, England are held every four years. Since the last boundary changes in 2003, 55 councillors have been elected from 26 wards.

Broxtowe Borough Council in Nottinghamshire, England is elected every four years. The Conservative party held overall control of the council from its foundation in 1973 until 1995 when the Labour party took control. Boundary changes took place for the 2003 election reducing the number of seats by five. The election saw Labour lose overall control of the council. Since 2003 the council has been under no overall control with Labour and the Liberal Democrats sharing power.

The 2003 Corby Borough Council election took place on 1 May 203 to elect members of Corby Borough Council in Northamptonshire, England. The Labour retained overall control of the council, which it had held continuously since 1979.

2003 Fylde Borough Council election

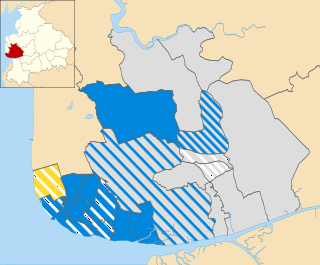
The 2003 Fylde Borough Council election took place on 1 May 2003 to elect members of Fylde Borough Council in Lancashire, England. The whole council was up for election with boundary changes since the last election in 1999 increasing the number of seats by two. The Conservative party gained overall control of the council from no overall control.

2007 Blackpool Borough Council election

The 2007 Blackpool Borough Council election took place on 3 May 2007 to elect members of the unitary Blackpool Borough Council in England. The whole council was up for election and the Conservative party gained overall control of the council from the Labour party.

Elections to Stevenage Council in Hertfordshire, England were held on 1 May 2003. One third of the council was up for election and the Labour party stayed in overall control of the council, as had been predicted before the election. Overall turnout was 52.2%.

The 2003 Redditch Borough Council election took place on 1 May 2003 to elect members of Redditch Borough Council in the West Midlands region, England. One third of the council was up for election and the council stayed under no overall control.

The 2003 Worthing Borough Council election took place on 1 May 2003 to elect members of Worthing Borough Council in West Sussex, England. One third of the council was up for election and the Liberal Democrats lost overall control of the council to no overall control. Overall turnout was 28.61%.

2011 Broxtowe Borough Council election

Elections to Broxtowe Borough Council were held on 5 May 2011 to elect all 44 members to the Council.

2003 Solihull Metropolitan Borough Council election

The 2003 Solihull Metropolitan Borough Council election took place on 1 May 2003 to elect members of Solihull Metropolitan Borough Council in the West Midlands, England. One third of the council was up for election and the Conservative party stayed in overall control of the council.

2011 Blackpool Borough Council election

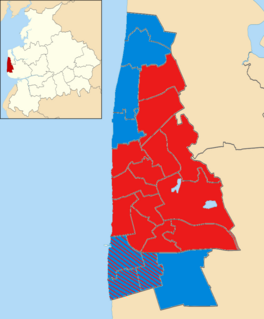
The 2011 Blackpool Borough Council election took place on 5 May 2011 to elect members of the unitary Blackpool Borough Council in England. The whole council was up for election and the Labour party gained overall control of the council from the Conservative party.

2011 Fylde Borough Council election

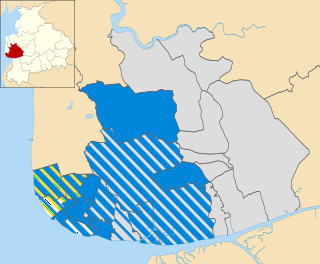
The 2011 Fylde Borough Council election took place on 5 May 2011 to elect members of Fylde Borough Council in Lancashire, England. The whole council was up for election and the Conservative party stayed in overall control of the council.

2000 Barnsley Metropolitan Borough Council election

The 2000 Barnsley Metropolitan Borough Council election took place on 4 May 2000 to elect members of Barnsley Metropolitan Borough Council in South Yorkshire, England. Prior to the election, Labour has suffered a by-election loss in South West and two defections to Independent. One third of the council was up for election and the Labour party stayed in overall control of the council.

The 2000 Eastbourne Borough Council election took place on 4 May 2000 to elect members of Eastbourne Borough Council in East Sussex, England. One third of the council was up for election and the Conservative party gained overall control of the council from no overall control.

2015 Blackpool Borough Council election

The 2015 Blackpool Borough Council election took place on 7 May 2015 to elect members of Blackpool Borough Council in England. All 21 wards of 2 seats each on the council were contested with newly elected members next due to serve a four-year term and next contest their seats in 2019. The council is made up oThis election took place on the same day as other local elections as well as the 2015 UK General Election.

1996 Wirral Metropolitan Borough Council election

The 1996 Wirral Metropolitan Borough Council election took place on 2 May 1996 to elect members of Wirral Metropolitan Borough Council in England. This election was held on the same day as other local elections.

References