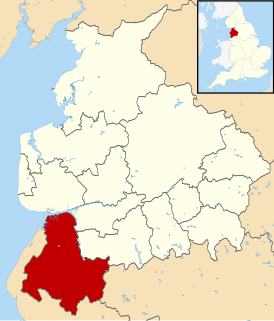
The 2010 West Lancashire Borough Council election took place on 6 May 2010 to elect members of West Lancashire Borough Council in Lancashire, England. One third of the council was up for election and the Conservative party stayed in overall control of the council. [1]
West Lancashire is a non-metropolitan district with the status of a borough in Lancashire, England. Its council is based in Ormskirk. The other town in the borough is Skelmersdale. The population of the District taken at the 2011 census was 110,685. The district was formed in 1974 under the Local Government Act 1972, as a merger of Ormskirk and Skelmersdale and Holland urban districts along with part of West Lancashire Rural District and part of the former Wigan Rural District.
Borough status in the United Kingdom is granted by royal charter to local government districts in England, Wales and Northern Ireland. The status is purely honorary, and does not give any additional powers to the council or inhabitants of the district. In Scotland, similarly chartered communities were known as royal burghs, although the status is no longer granted.
Lancashire is a ceremonial county in North West England. The administrative centre is Preston. The county has a population of 1,449,300 and an area of 1,189 square miles (3,080 km2). People from Lancashire are known as Lancastrians.
After the election, the composition of the council was
The Conservative Party, officially the Conservative and Unionist Party, is a centre-right political party in the United Kingdom. The governing party since 2010, it is the largest in the House of Commons, with 313 Members of Parliament, and also has 249 members of the House of Lords, 18 members of the European Parliament, 31 Members of the Scottish Parliament, 12 members of the Welsh Assembly, eight members of the London Assembly and 8,916 local councillors.
The Labour Party is a centre-left political party in the United Kingdom that has been described as an alliance of social democrats, democratic socialists and trade unionists. The party's platform emphasises greater state intervention, social justice and strengthening workers' rights.
Since the council was created in 1973 West Lancashire has alternated between the Conservative and Labour parties. [3] The Conservatives gained control of the council in the 2002 election and since then had increased their majority. [3] This meant that before the 2010 election the Conservatives held 33 of the 54 seats on the council as compared to 16 for Labour, 2 independents and a number of vacancies. [3] The third party nationally, the Liberal Democrats, had no councillors in West Lancashire and did not stand any candidates in the election. [3]
The Liberal Democrats are a liberal political party in the United Kingdom. It is currently led by Vince Cable. They have 11 Members of Parliament in the House of Commons, 96 members of the House of Lords, one member of the European Parliament, five Members of the Scottish Parliament and one member in the Welsh Assembly and London Assembly. At the height of its influence, the party formed a coalition government with the Conservative Party from 2010 to 2015 with its leader Nick Clegg serving as Deputy Prime Minister.
A Councillor is a member of a local government council.
19 seats were being contested in the 2010 election, including the normal 18 seats and one by-election. [3] The by-election in Scott ward came after the resignation of Conservative Geoff Hammond in March, [4] meaning that 2 councillors would be elected from the ward in 2010. [3] As well as the Conservative and Labour parties, there were also several Green party candidates and one English Democrat who was standing in Ashurst ward. [3]
By-elections, also spelled bye-elections, are used to fill elected offices that have become vacant between general elections.
The Green Party of England and Wales is a green, left-wing political party in England and Wales. Headquartered in London, since September 2018, its co-leaders are Siân Berry and Jonathan Bartley. The Green Party has one representative in the House of Commons, one in the House of Lords, and three in the European Parliament. In addition, it has various councillors in UK local government and two members of the London Assembly.
The Conservatives' strong majority before the election meant it was seen as being almost certain that they would remain in control of the council. [3] They were defending 14 of the 19 seats being contested, but were still hoping to make some gains. [3] The Conservatives pointed to their record in freezing Council Tax, while making improvements in services and local parks. [3]
Council Tax is a local taxation system used in England, Scotland and Wales. It is a tax on domestic property which was introduced in 1993 by the Local Government Finance Act 1992, replacing the short lived Community Charge, which in turn replaced the domestic rates. Each property is assigned one of eight bands in England and Scotland, or nine bands in Wales, based on property value, and the tax is set as a fixed amount for each band. The more valuable the property, the higher the tax, except for properties valued above £320,000. Some property is exempt from the tax, and some people are exempt from the tax, while some get a discount.
Meanwhile, Labour pointed to their candidates and the increased turnout due to the election taking place at the same time as the general election, as factors leading them to hope they would make gains. [3] They targeted the wards of Burscough East, Burscough West and Scott, while also hoping to make progress elsewhere in the north of the council. [3]
Voter turnout is the percentage of eligible voters who cast a ballot in an election. Eligibility varies by country, and the voting-eligible population should not be confused with the total adult population. Age and citizenship status are often among the criteria used to determine eligibility, but some countries further restrict eligibility based on sex, race, or religion.
Burscough is a small town and civil parish within West Lancashire in North West England, to the north of Ormskirk and Skelmersdale.The parish also includes the hamlet of Tarlscough and the Martin Mere Wetland Centre. The population taken at the 2011 Census was 9,182.
The results saw the Conservatives stay in control of the council despite losing 3 council seats to reduce their majority to 8 seats. [5] Labour gained the 3 seats from the Conservatives in Burscough West and both seats in Scott ward, with Labour's 41 vote majority in Burscough West being the most marginal of the election. [4] Labour also regained a seat in Up Holland, where the former councillor, David Phythian, had served as an independent after having been suspended from Labour in 2007 due to racist comments. [4] However the Conservative group leader, Ian Grant, was among those who held their seats with the Conservatives remaining safely in control of the council. [4]
Party | Seats | Gains | Losses | Net gain/loss | Seats % | Votes % | Votes | +/− | |
---|---|---|---|---|---|---|---|---|---|
Conservative | 11 | 0 | 3 | -3 | 57.9 | 47.5 | 22,328 | -6.7% | |
Labour | 8 | 4 | 0 | +4 | 42.1 | 48.8 | 22,930 | +12.0% | |
Green | 0 | 0 | 0 | 0 | 0 | 3.0 | 1,402 | -0.1% | |
English Democrat | 0 | 0 | 0 | 0 | 0 | 0.8 | 353 | +0.8% | |
Independent | 0 | 0 | 1 | -1 | 0 | 0 | 0 | - | |
Party | Candidate | Votes | % | ± | |
---|---|---|---|---|---|
Labour | Yvonne Gagen | 2,109 | 69.5 | +18.3 | |
Conservative | David Gallagher | 574 | 18.9 | -10.1 | |
English Democrat | Stephen Bennett | 353 | 11.6 | +11.6 | |
Majority | 1,535 | 50.6 | +28.4 | ||
Turnout | 3,036 | 63.1 | +41.6 | ||
Labour hold | Swing | ||||
Party | Candidate | Votes | % | ± | |
---|---|---|---|---|---|
Conservative | David O'Toole | 1,871 | 57.7 | -7.3 | |
Labour | Paul Hennessy | 1,372 | 42.3 | +24.0 | |
Majority | 499 | 15.4 | -31.3 | ||
Turnout | 3,243 | 72.5 | +35.8 | ||
Conservative hold | Swing | ||||
Party | Candidate | Votes | % | ± | |
---|---|---|---|---|---|
Conservative | Ian Grant | 1,511 | 68.7 | -12.1 | |
Labour | Kate Ainscough | 688 | 31.3 | +12.1 | |
Majority | 823 | 37.4 | -24.2 | ||
Turnout | 2,199 | 70.6 | +35.2 | ||
Conservative hold | Swing | ||||
Party | Candidate | Votes | % | ± | |
---|---|---|---|---|---|
Conservative | Ruth Melling | 1,192 | 53.1 | -12.5 | |
Labour | Roger Bell | 1,054 | 46.9 | +12.5 | |
Majority | 138 | 6.1 | -25.2 | ||
Turnout | 2,246 | 68.5 | +33.9 | ||
Conservative hold | Swing | ||||
Party | Candidate | Votes | % | ± | |
---|---|---|---|---|---|
Labour | John Davis | 1,307 | 50.8 | +9.4 | |
Conservative | David Griffiths | 1,266 | 49.2 | -9.4 | |
Majority | 41 | 1.6 | |||
Turnout | 2,573 | 66.3 | +29.3 | ||
Labour gain from Conservative | Swing | ||||
Party | Candidate | Votes | % | ± | |
---|---|---|---|---|---|
Conservative | Paul Greenall | 1,396 | 46.0 | -15.8 | |
Labour | John Fillis | 1,195 | 39.4 | +16.4 | |
Green | Anne Doyle | 445 | 14.7 | -0.5 | |
Majority | 201 | 6.6 | -32.2 | ||
Turnout | 3,036 | 58.2 | +29.1 | ||
Conservative hold | Swing | ||||
Party | Candidate | Votes | % | ± | |
---|---|---|---|---|---|
Conservative | Christopher Ashcroft | 1,339 | 68.6 | ||
Labour | Lucy Hodson | 612 | 31.4 | ||
Majority | 727 | 37.3 | |||
Turnout | 1,951 | 62.7 | |||
Conservative hold | Swing | ||||
Party | Candidate | Votes | % | ± | |
---|---|---|---|---|---|
Conservative | Val Hopley | 1,535 | 48.6 | -15.2 | |
Labour | Judith Hanlon | 1,331 | 42.1 | +19.4 | |
Green | John Watt | 292 | 9.2 | -4.2 | |
Majority | 204 | 6.5 | -34.6 | ||
Turnout | 3,158 | 72.1 | +36.7 | ||
Conservative hold | Swing | ||||
Party | Candidate | Votes | % | ± | |
---|---|---|---|---|---|
Labour | Julie Gibson | 1,298 | 83.4 | +8.9 | |
Conservative | Graham Jones | 259 | 16.6 | -8.9 | |
Majority | 1,039 | 66.7 | +17.8 | ||
Turnout | 1,557 | 56.9 | +34.2 | ||
Labour hold | Swing | ||||
Party | Candidate | Votes | % | ± | |
---|---|---|---|---|---|
Conservative | Edward Pope | 832 | 66.9 | -5.8 | |
Labour | Jacqueline Citarella | 411 | 33.1 | +16.1 | |
Majority | 421 | 33.9 | -21.7 | ||
Turnout | 1,243 | 78.0 | +33.5 | ||
Conservative hold | Swing | ||||
Party | Candidate | Votes | % | ± | |
---|---|---|---|---|---|
Conservative | John Baldock | 1,192 | 65.1 | +5.9 | |
Labour | John Hodson | 638 | 34.9 | +20.6 | |
Majority | 554 | 30.3 | -2.4 | ||
Turnout | 1,830 | 57.7 | +28.5 | ||
Conservative hold | Swing | ||||
Party | Candidate | Votes | % | ± | |
---|---|---|---|---|---|
Conservative | Barbara Kean | 1,477 | 63.1 | -15.1 | |
Labour | Clare Gillard | 864 | 36.9 | +15.1 | |
Majority | 613 | 26.2 | -30.1 | ||
Turnout | 2,341 | 76.9 | +36.1 | ||
Conservative hold | Swing | ||||
Party | Candidate | Votes | % | ± | |
---|---|---|---|---|---|
Conservative | William Cropper | 1,480 | 69.3 | +16.0 | |
Labour | Susan Jones | 657 | 30.7 | +17.0 | |
Majority | 823 | 38.5 | +10.6 | ||
Turnout | 2,137 | 70.9 | +34.4 | ||
Conservative hold | Swing | ||||
Party | Candidate | Votes | % | ± | |
---|---|---|---|---|---|
Labour | Noel Delaney | 1,500 | |||
Labour | Steve Hanlon | 1,379 | |||
Conservative | David Meadows | 1,127 | |||
Conservative | Sarah Ainscough | 898 | |||
Green | Maurice George | 408 | |||
Turnout | 5,312 | 67.3 | +32.5 | ||
Labour gain from Conservative | Swing | ||||
Party | Candidate | Votes | % | ± | |
---|---|---|---|---|---|
Labour | Ian McKay | 2,228 | 73.3 | +6.6 | |
Conservative | Amanda Shaw | 554 | 18.2 | -15.1 | |
Green | Martin Lowe | 257 | 8.5 | +8.5 | |
Majority | 1,674 | 55.1 | +21.8 | ||
Turnout | 3,039 | 61.8 | +38.5 | ||
Labour hold | Swing | ||||
Party | Candidate | Votes | % | ± | |
---|---|---|---|---|---|
Labour | Bob Pendleton | 1,416 | 76.6 | +24.4 | |
Conservative | Cindy Miller | 433 | 23.4 | -24.4 | |
Majority | 983 | 53.2 | +48.8 | ||
Turnout | 1,849 | 55.2 | +32.5 | ||
Labour hold | Swing | ||||
Party | Candidate | Votes | % | ± | |
---|---|---|---|---|---|
Conservative | James Kay | 2,000 | 67.9 | -19.8 | |
Labour | Gail Hodson | 944 | 32.1 | +19.8 | |
Majority | 1,056 | 35.9 | -39.4 | ||
Turnout | 2,944 | 66.0 | +27.1 | ||
Conservative hold | Swing | ||||
Party | Candidate | Votes | % | ± | |
---|---|---|---|---|---|
Labour | Ian Moran | 1,927 | 58.1 | +15.2 | |
Conservative | Jonathan Kirkby | 1,392 | 41.9 | -1.2 | |
Majority | 535 | 16.1 | |||
Turnout | 3,319 | 68.0 | +33.6 | ||
Labour gain from Independent | Swing | ||||
Liverpool City Council is the governing body for the city of Liverpool in Merseyside, England. It consists of 90 councillors, three for each of the city's 30 wards.
The 2003 West Lancashire District Council election took place on 1 May 2003 to elect members of West Lancashire District Council in Lancashire, England. One third of the council was up for election and the Conservative party stayed in overall control of the council.
The 2006 West Lancashire District Council election took place on 4 May 2006 to elect members of West Lancashire District Council in Lancashire, England. One third of the council was up for election and the Conservative party stayed in overall control of the council.
The 2008 West Lancashire District Council election took place on 1 May 2008 to elect members of West Lancashire District Council in Lancashire, England. One third of the council was up for election and the Conservative party stayed in overall control of the council.
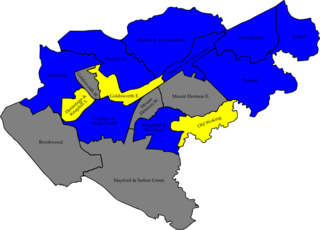
The 2007 Woking Council election took place on 3 May 2007 to elect members of Woking Borough Council in Surrey, England. One third of the council was up for election and the Conservative party gained overall control of the council from no overall control.
The 2007 West Lancashire District Council election took place on 3 May 2007 to elect members of West Lancashire District Council in Lancashire, England. One third of the council was up for election and the Conservative party stayed in overall control of the council.
The 2010 Enfield Council election took place on 6 May 2010 to elect members of Enfield London Borough Council in London, England. The whole council was up for election and the Labour party gained overall control of the council from the Conservative party.
The 2008 Rushmoor Council election took place on 1 May 2008 to elect members of Rushmoor Borough Council in Hampshire, England. One third of the council was up for election and the Conservative party stayed in overall control of the council.
The 2006 Pendle Borough Council election took place on 4 May 2006 to elect members of Pendle Borough Council in Lancashire, England. One third of the council was up for election and the Liberal Democrats stayed in overall control of the council.
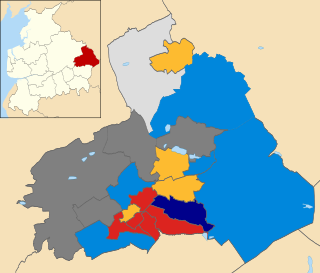
The 2008 Pendle Borough Council election took place on 1 May 2008 to elect members of Pendle Borough Council in Lancashire, England. One third of the council was up for election and the Liberal Democrats lost overall control of the council to no overall control.
The 2007 Sandwell Metropolitan Borough Council election took place on 3 May 2007 to elect members of Sandwell Metropolitan Borough Council in the West Midlands, England. One third of the council was up for election and the Labour party stayed in overall control of the council.
Elections to Preston City Council took place on 3 May 2012, the same day as other United Kingdom local elections, 2012.
The 2007 Hertsmere Borough Council election took place on 3 May 2007 to elect members of Hertsmere Borough Council in Hertfordshire, England. One third of the council was up for election and the Conservative party stayed in overall control of the council.
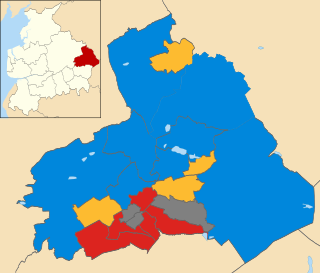
The 2011 Pendle Borough Council election took place on 5 May 2011 to elect members of Pendle Borough Council in Lancashire, England. One third of the council was up for election and the council stayed under no overall control.
The 2012 Pendle Borough Council election took place on 3 May 2012 to elect members of Pendle Borough Council in Lancashire, England. One third of the council was up for election and the council stayed under no overall control.
The 2014 Pendle Borough Council election took place on 22 May 2014 to elect members of Pendle Borough Council in Lancashire, England. One third of the council was up for election and the council stayed under no overall control.
The 2008 Havant Borough Council election took place on 1 May 2008 to elect members of Havant Borough Council in Hampshire, England. One third of the council was up for election and the Conservative party stayed in overall control of the council.
The 2015 Cheshire West and Chester Council election took place on 7 May 2015, electing members of Cheshire West and Chester Council in England. This was on the same day as other local elections across the country as well as the general election.
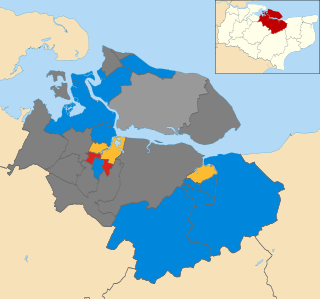
The 2008 Swale Borough Council election took place on 1 May 2008 to elect members of Swale Borough Council in Kent, England. One third of the council was up for election and the Conservative party stayed in overall control of the council.
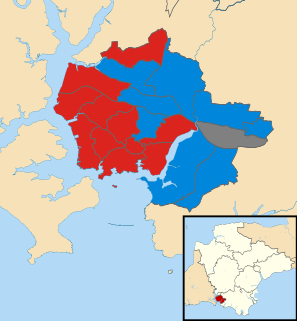
The 2018 Plymouth City Council election took place on 3 May 2018 to elect members of Plymouth City Council in England. The election was won by the Labour Party, who gained enough seats to achieve an overall majority and took control of the council.