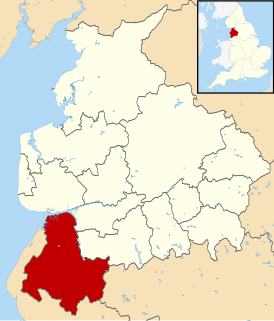
The 1986 West Lancashire District Council election took place on 1 May 1986 to elect members of West Lancashire District Council in Lancashire, England. One third of the council was up for election and the Conservative party stayed in overall control of the council. [1]
West Lancashire is a non-metropolitan district with the status of a borough in Lancashire, England. Its council is based in Ormskirk. The other town in the borough is Skelmersdale. The population of the District taken at the 2011 census was 110,685. The district was formed in 1974 under the Local Government Act 1972, as a merger of Ormskirk and Skelmersdale and Holland urban districts along with part of West Lancashire Rural District and part of the former Wigan Rural District.
Non-metropolitan districts, or colloquially "shire districts", are a type of local government district in England. As created, they are sub-divisions of non-metropolitan counties in a two-tier arrangement.
Lancashire is a ceremonial county in North West England. The administrative centre is Preston. The county has a population of 1,449,300 and an area of 1,189 square miles (3,080 km2). People from Lancashire are known as Lancastrians.
After the election, the composition of the council was:
Party | Seats | ± | |
---|---|---|---|
Conservative | 27 | -3 | |
Labour | 21 | +2 | |
Social Democrat | 3 | +1 | |
Liberal | 1 | +0 | |
Independent | 3 | +0 |
Party | Candidate | Votes | % | ± | |
---|---|---|---|---|---|
Conservative | Raymond Wardle | 1041 | |||
Social Democratic | Grace Wyatt | 345 | |||
Labour | Judith Pickthall | 290 | |||
Majority | |||||
Turnout | |||||
Conservative hold | Swing | ||||
Party | Candidate | Votes | % | ± | |
---|---|---|---|---|---|
Labour | Danny Bassey | 1637 | |||
Social Democratic | Robert Jones | 865 | |||
Conservative | Ronald Brown | 465 | |||
Conservative | Florence Smith | 420 | |||
Majority | |||||
Majority | |||||
Turnout | |||||
Labour hold | Swing | ||||
Social Democratic gain from Labour | Swing | ||||
Party | Candidate | Votes | % | ± | |
---|---|---|---|---|---|
Labour | Anne Maguire | 806 | |||
Conservative | Ronald Barker | 721 | |||
Social Democratic | Margaret McCain | 161 | |||
Majority | |||||
Turnout | |||||
Labour gain from Conservative | Swing | ||||
Party | Candidate | Votes | % | ± | |
---|---|---|---|---|---|
Social Democratic | Robert Jermyn | 1108 | |||
Conservative | William Rigby | 984 | |||
Labour | Maurice George | 647 | |||
Majority | |||||
Turnout | |||||
Social Democratic gain from Conservative | Swing | ||||
Party | Candidate | Votes | % | ± | |
---|---|---|---|---|---|
Conservative | Alexander Chadwick | 294 | |||
Social Democratic | Andrew Johnson | 91 | |||
Labour | Christopher Sawyer | 53 | |||
Majority | |||||
Turnout | |||||
Conservative hold | Swing | ||||
Party | Candidate | Votes | % | ± | |
---|---|---|---|---|---|
Conservative | Val Hopley | 902 | |||
Social Democratic | Matthew Cochrane | 753 | |||
Labour | Bernard Brown | 323 | |||
Majority | |||||
Turnout | |||||
Conservative hold | Swing | ||||
Party | Candidate | Votes | % | ± | |
---|---|---|---|---|---|
Conservative | Malcolm Gibbons | 877 | |||
Labour | John Draper | 450 | |||
Social Democratic | Carol Jermyn | 100 | |||
Majority | |||||
Turnout | |||||
Conservative hold | Swing | ||||
Party | Candidate | Votes | % | ± | |
---|---|---|---|---|---|
Labour | Francis Riley | 665 | |||
Social Democratic | Stephen Gaskill | 93 | |||
Conservative | James Hignett | 93 | |||
Communist | Terence Aldridge | 80 | |||
Majority | |||||
Turnout | |||||
Labour hold | Swing | ||||
Party | Candidate | Votes | % | ± | |
---|---|---|---|---|---|
Conservative | Kenneth Vincent | 559 | |||
Labour | Cynthia Dereli | 154 | |||
Social Democratic | Louise Randall | 146 | |||
Majority | |||||
Turnout | |||||
Conservative hold | Swing | ||||
Party | Candidate | Votes | % | ± | |
---|---|---|---|---|---|
Conservative | William Ryding | 515 | |||
Conservative | David Bintcliffe | 500 | |||
Labour | Peter Wynn | 281 | |||
Labour | Joan Draper | 280 | |||
Social Democratic | Andrew Cowley | 90 | |||
Majority | |||||
Turnout | |||||
Conservative hold | Swing | ||||
Party | Candidate | Votes | % | ± | |
---|---|---|---|---|---|
Conservative | Peter Turner | 968 | |||
Social Democratic | David Pryer | 423 | |||
Labour | Patricia Carson | 208 | |||
Majority | |||||
Turnout | |||||
Conservative hold | Swing | ||||
Party | Candidate | Votes | % | ± | |
---|---|---|---|---|---|
Conservative | Margaret Edwards | 561 | |||
Labour | Victor Coman | 125 | |||
Social Democratic | Mark Winstanley | 110 | |||
Majority | |||||
Turnout | |||||
Conservative hold | Swing | ||||
Party | Candidate | Votes | % | ± | |
---|---|---|---|---|---|
Labour | Ash Martin | 1045 | |||
Conservative | Anthony Toal | 885 | |||
Social Democratic | Jill Cochrane | 291 | |||
Majority | |||||
Turnout | |||||
Labour gain from Conservative | Swing | ||||
Party | Candidate | Votes | % | ± | |
---|---|---|---|---|---|
Labour | Jean White | 1111 | |||
Conservative | George Alty | 233 | |||
Social Democratic | Rosamond Bull | 177 | |||
Majority | |||||
Turnout | |||||
Labour hold | Swing | ||||
Party | Candidate | Votes | % | ± | |
---|---|---|---|---|---|
Labour | Peter Harrison | 1124 | |||
Social Democratic | Joan Critchley | 239 | |||
Conservative | Ronald Harrison | 145 | |||
Majority | |||||
Turnout | |||||
Labour hold | Swing | ||||
Party | Candidate | Votes | % | ± | |
---|---|---|---|---|---|
Labour | Stanley Sent | 999 | |||
Social Democratic | Thomas Sweeney | 228 | |||
Conservative | Sylvia Winters | 134 | |||
Majority | |||||
Turnout | |||||
Labour hold | Swing | ||||
Party | Candidate | Votes | % | ± | |
---|---|---|---|---|---|
Conservative | Barry Gannaway-Jones | 803 | |||
Social Democratic | Roy Hiscock | 314 | |||
Labour | Wayne Marland | 182 | |||
Majority | |||||
Turnout | |||||
Conservative hold | Swing | ||||
Party | Candidate | Votes | % | ± | |
---|---|---|---|---|---|
Labour | John Burke | 735 | |||
Conservative | Peter Edwards | 593 | |||
Majority | |||||
Turnout | |||||
Labour gain from Social Democratic | Swing | ||||
Blackburn with Darwen is a unitary authority area in Lancashire, North West England. It consists of Blackburn, the small town of Darwen to the south of it, and the surrounding countryside. The population of the Unitary Authority taken at the 2011 census was 147,489.
The Metropolitan Borough of Wigan is a metropolitan borough of Greater Manchester, in North West England. It is named after its largest component town and former county borough, Wigan and includes the towns and villages of Leigh, part of Ashton-in-Makerfield, Ince-in-Makerfield, Hindley, Orrell, Standish, Atherton, Tyldesley, Golborne, Lowton, Billinge, Astley, Haigh and Aspull. The borough was formed in 1974 and is an amalgamation of several former local government districts and parishes. The borough has three civil parishes and lies directly to the west of the City of Salford and southwest of the Metropolitan Borough of Bolton. The local authority is Wigan Metropolitan Borough Council.
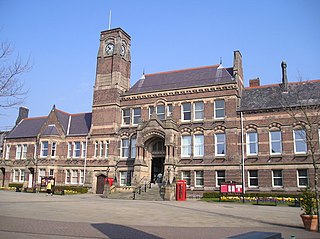
The Metropolitan Borough of St Helens is a metropolitan borough of Merseyside, in North West England. It is named after its largest town St Helens, and covers an area which includes the settlements of Sutton, St Helens, Earlestown, Rainhill, Eccleston, Clock Face, Haydock, Billinge, Rainford and Newton-le-Willows.
One third of Chorley Borough Council is elected each year, followed by one year without election.
One third of West Lancashire Borough Council in Lancashire, England is elected each year, followed by one year without election. Since the last boundary changes in 2002, 54 councillors have been elected from 25 wards.
The 1998 West Lancashire District Council election took place on 7 May 1998 to elect members of West Lancashire District Council in Lancashire, England. One third of the council was up for election and the Labour party stayed in overall control of the council.
The 1999 West Lancashire District Council election took place on 6 May 1999 to elect members of West Lancashire District Council in Lancashire, England. One third of the council was up for election and the Labour party stayed in overall control of the council.
The 2000 West Lancashire District Council election took place on 4 May 2000 to elect members of West Lancashire District Council in Lancashire, England. One third of the council was up for election and the Labour party stayed in overall control of the council.
The 2002 West Lancashire District Council election took place on 2 May 2002 to elect members of West Lancashire District Council in Lancashire, England. The whole council was up for election with boundary changes since the last election in 2000 reducing the number of seats by 1. The Conservative party gained overall control of the council from Labour.
The 2003 West Lancashire District Council election took place on 1 May 2003 to elect members of West Lancashire District Council in Lancashire, England. One third of the council was up for election and the Conservative party stayed in overall control of the council.
The 2004 West Lancashire District Council election took place on 10 June 2004 to elect members of West Lancashire District Council in Lancashire, England. One third of the council was up for election and the Conservative party stayed in overall control of the council.
The 2006 West Lancashire District Council election took place on 4 May 2006 to elect members of West Lancashire District Council in Lancashire, England. One third of the council was up for election and the Conservative party stayed in overall control of the council.
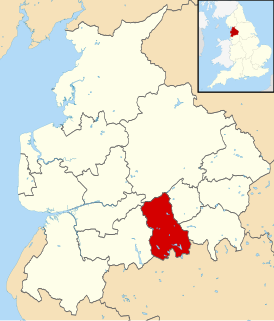
One third of Hyndburn Borough Council in Lancashire, England is elected each year, followed by one year when there is an election to Lancashire County Council instead. Since the last boundary changes in 2002, 35 councillors have been elected from 16 wards.
One third of Rossendale Borough Council in Lancashire, England is elected each year, followed by one year where there is an election to Lancashire County Council instead.
The 2008 West Lancashire District Council election took place on 1 May 2008 to elect members of West Lancashire District Council in Lancashire, England. One third of the council was up for election and the Conservative party stayed in overall control of the council.
The 2007 West Lancashire District Council election took place on 3 May 2007 to elect members of West Lancashire District Council in Lancashire, England. One third of the council was up for election and the Conservative party stayed in overall control of the council.
The 2012 West Lancashire Borough Council election took place on 3 May 2012 to elect members of West Lancashire Borough Council in Lancashire, England. One third of the council was up for election, with results compared to the corresponding vote in West Lancashire Council election, 2008.
The 2014 West Lancashire Borough Council election took place on 22 May 2014 to elect members of West Lancashire Borough Council in Lancashire, England, as part of the wider 2014 United Kingdom local elections and with the United Kingdom component of the 2014 European Parliament election on the same day. One third of the council is up for election.
The 2011 West Lancashire Borough Council election took place on 5 May 2011 to elect members of West Lancashire Borough Council in Lancashire, England. One third of the council was up for election, with results compared to the corresponding vote in West Lancashire Council election, 2007.
The 2016 West Lancashire Borough Council election take place on 5 May 2016 to elect members of West Lancashire Borough Council in Lancashire, England. Following the 2015 local elections Labour Party (UK) took control of the council. A third of the seats were being polled during this election. Summary post election-