Chorley Borough Council election, 2011

Last updated

Elections to Chorley Borough Council were held on 5 May 2011. One third of the council was up for election and the Conservative party lost overall control to NOC.

Election process by which a population chooses an individual to hold public office

An election is a formal group decision-making process by which a population chooses an individual to hold public office. Elections have been the usual mechanism by which modern representative democracy has operated since the 17th century. Elections may fill offices in the legislature, sometimes in the executive and judiciary, and for regional and local government. This process is also used in many other private and business organizations, from clubs to voluntary associations and corporations.

Conservative Party (UK) Political party in the United Kingdom

The Conservative Party, officially the Conservative and Unionist Party, is a centre-right political party in the United Kingdom. Presently led by Theresa May, it has been the governing party since 2010. It presently has 314 Members of Parliament in the House of Commons, 249 members of the House of Lords, and 18 members of the European Parliament. It also has 31 Members of the Scottish Parliament, 12 members of the Welsh Assembly, eight members of the London Assembly and 9,008 local councillors. One of the major parties of UK politics, it has formed the government on 45 occasions, more than any other party.

Contents

Council Make-up

After the election, the composition of the council was:

Party political make-up of Chorley Council
   Party Seats Council (2011-2012)
2008 2010 2011
  Conservative 272723                                               
  Labour 151520                                               
  Lib Dems 332                                               
  Independent 222                                               

Election result

Chorley Local Election Result 2011
PartySeatsGainsLossesNet gain/lossSeats %Votes %Votes+/−
  Labour 9 5 0 +5 60 49.0 14,467 +10
  Conservative 6 0 4 −4 40 38.3 11,308 −1
  Liberal Democrat 0 0 1 −1 0 6.2 1,818 −6
  UKIP 0 0 0 0 0 4.1 1,220 +3
  Independent 0 0 0 0 0 2.4 707 −6

Results Map

2011 results Chorley 2011.jpg
2011 results
Previous 2007 results Chorley 2007.jpg
Previous 2007 results

Ward results

Adlington and Anderton

Adlington and Anderton
PartyCandidateVotes%±
Labour Green check.svgYJune Molyneux 1,418 55.0 −2
Conservative Lawrence Catterall 898 34.8 +5
Liberal Democrat Glyn Hughes 264 10.2 −3
Majority 520 20.2 −7
Turnout 2,580 46.9 −26
Labour hold Swing −3.5

Astley and Buckshaw ward

Astley and Buckshaw
PartyCandidateVotes%±
Conservative Green check.svgYMark Perks 872 54.3 +0
Labour Ian Handley 599 37.3 −9
UKIP Jeffrey Flinders Mallinson 134 8.3N/A
Majority 273 17.0 +14
Turnout 1,605 49.0 −23
Conservative hold Swing +4.5

Chisnall ward

Chisnall
PartyCandidateVotes%±
Conservative Green check.svgYPaul Leadbetter 739 49.5 −2
Labour Danny Gee 607 40.7 +14
Liberal Democrat Patricia Cuerden 146 9.8 −5
Majority 132 8.8 −15
Turnout 1,492 46 −26
Conservative hold Swing −8

Chorley East ward

Chorley East
PartyCandidateVotes%±
Labour Green check.svgYTerry Brown 1,381 75.8 +18
Conservative Simon Parkinson 276 15.2 −7
UKIP Tommy Shorrock 164 9.0N/A
Majority 1,105 60.7 +24
Turnout 1,821 38 −25
Labour hold Swing +12.5

Chorley North East ward

Chorley North East
PartyCandidateVotes%±
Labour Green check.svgYMarion Lowe 1,280 66.2 +18
Conservative Elliot Matthews 653 33.8 +6
Majority 627 32.4 +12
Turnout 1,933 40 −27
Labour hold Swing +6

Chorley North West ward

Chorley North West
PartyCandidateVotes%±
Labour Green check.svgYPauline Phipps 1,538 56.0 +12
Conservative Peter Malpas 1,207 44.0 −12
Majority 331 12.1 +24
Turnout 2,745 58 −13
Labour gain from Conservative Swing +12

N.B. Percentage change in vote is from 2007

Chorley South East ward

Chorley South East
PartyCandidateVotes%±
Labour Green check.svgYPaul James Walmsley 1,056 50.7 +6
Conservative Samuel Andrew Chapman 701 33.7 −1.0
UKIP Nigel Cecil 137 6.6N/A
Independent Chris P. Curtis 103 4.9N/A
Liberal Democrat David Porter 86 4.1 −12.0
Majority 355 17.0 +6
Turnout 2,083 43.1 −23.0
Labour gain from Conservative Swing +3.5

Chorley South West ward

Chorley South West
PartyCandidateVotes%±
Labour Green check.svgYAnthony Stephen Holgate 1,115 57.1 +10
Conservative Dr. Bulvinder Michael 487 24.9 −8
Liberal Democrat Colin Grunstein 193 9.9 −10
UKIP Alan Wallbank 157 8.0N/A
Majority 628 32.2 +18
Turnout 1,952 34 −26
Labour hold Swing +9

Clayton le Woods and Whittle-le-Woods ward

Clayton le Woods and Whittle-le-Woods
PartyCandidateVotes%±
Conservative Green check.svgYGreg Morgan 1,162 48.6 −6
Labour Celine Frances Maguire 793 33.2 +9
Liberal Democrat Glenda Charlesworth 286 12.0 −9
UKIP Hilda Freeman 148 6.2N/A
Majority 369 15.4 −15
Turnout 2,389 41 −19
Conservative hold Swing −7.5

Clayton le Woods North ward

Clayton le Woods North
PartyCandidateVotes%±
Labour Green check.svgYSteve Murfitt 891 45.0 +11
Conservative Mike Devaney 716 36.1 −2
UKIP Mark Rhodes 213 10.8 +11
Liberal Democrat Stephen John Fenn 161 8.1 −20
Majority 175 8.8 +14
Turnout 1,981 39 −34
Labour gain from Conservative Swing +6.5

Clayton le Woods West and Cuerden

Clayton le Woods West and Cuerden
PartyCandidateVotes%±
Labour Green check.svgYDave Rogerson 801 50.3 +5
Conservative Judith Boothman 655 41.1 −14
UKIP Paul Freeman 137 8.6N/A
Majority 146 9.2 +18
Turnout 1,593 48.0 −22
Labour gain from Conservative Swing +9.5

Coppull ward

Coppull
PartyCandidateVotes%±
Labour Green check.svgYMatthew Crow 1,141 54.7 +22
Liberal Democrat Nora Ball 682 32.7 −17
Conservative Sandra Mercer 262 12.6 −5
Majority 459 22.0 +38
Turnout 2,085 44.0 −23
Labour gain from Liberal Democrat Swing +19.5

Eccleston and Mawdesley ward

Eccleston and Mawdesley
PartyCandidateVotes%±
Conservative Green check.svgYKevin Joyce 1,247 56.9 −1
Labour Stan Ely 945 43.1 +1
Majority 302 13.8 −1
Turnout 2,192 47.0 −26
Conservative hold Swing −1

Euxton South ward

Euxton South
PartyCandidateVotes%±
Conservative Green check.svgYPeter Goldsworthy 734 50.4 −10
Labour Mark Jarnell 593 40.7 +1
UKIP Mrs. Denise Hogan 130 8.9N/A
Majority 141 9.7 −10
Turnout 1,457 46.0 −25
Conservative hold Swing −5.5

Lostock ward

Lostock
PartyCandidateVotes%±
Conservative Green check.svgYDoreen Dickinson 699 43.4 −14
Independent John Forrest 604 37.5N/A
Labour Michael Gaskill 309 19.2 +20
Majority 95 5.98
Turnout 1,612 47.0 +3
Conservative hold Swing −25.5

Related Research Articles

In many countries, a mayor is the highest-ranking official in a municipal government such as that of a city or a town.

Oxfordshire County Council is elected every four years.

A municipal council is the legislative body of a municipality such as a city council or a town council.

The wards and electoral divisions in the United Kingdom are electoral districts at sub-national level represented by one or more councillors. The ward is the primary unit of English electoral geography for civil parishes and borough and district councils, electoral ward is the unit used by Welsh principal councils, while the electoral division is the unit used by English county councils and some unitary authorities. Each ward/division has an average electorate of about 5,500 people, but ward-population counts can vary substantially. As at the end of 2014 there were 9,456 electoral wards/divisions in the UK.

2007 Swiss federal election election to the federal parliament in Switzerland

Elections to the Swiss Federal Assembly, the federal parliament of Switzerland, were held on Sunday, 21 October 2007. In a few cantons, a second round of the elections to the Council of States was held on 11 November, 18 November, and 25 November 2007. For the 48th legislative term of the federal parliament (2007–2011), voters in 26 cantons elected all 200 members of the National Council as well as 43 out of 46 members of the Council of States. The other three members of the Council of States for that term of service were elected at an earlier date.

Southwark London Borough Council elections

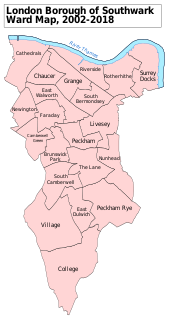
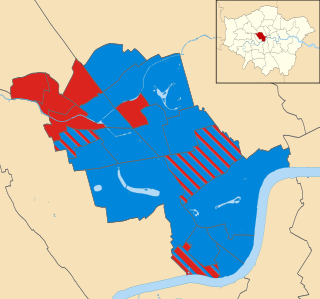
Southwark London Borough Council in London, England is elected every four years. Since the last boundary changes in 2002, 63 councillors have been elected from 21 wards.

Tamil Nadu Legislative Assembly

The Tamil Nadu Legislative Assembly alone has powers to legislate laws covering state subjects in the Indian state of Tamil Nadu. It has a strength of 235 members of whom 234 are democratically elected using the First-past-the-post system. The remaining member is nominated as a representative of the Anglo-Indian community. The presiding officer of the Assembly is called the Speaker. The term of the Assembly is five years unless it is dissolved earlier.

Westminster City Council elections

Westminster City Council, the local authority of the City of Westminster in London, England, is elected every four years. Since the last boundary changes in 2002, 60 councillors have been elected from 20 wards.

Middlesex County Council was the principal local government body in the administrative county of Middlesex, England from 1889 to 1965.

2010 Redbridge London Borough Council election

Elections for Redbridge London Borough Council were held on 6 May 2010. The 2010 General Election and other local elections took place on the same day.

2014 United Kingdom local elections

The 2014 United Kingdom local elections were held on 22 May 2014. Usually these elections are held on the first Thursday in May but were postponed to coincide with the 2014 European Parliament Elections. Direct elections were held for all 32 London boroughs, all 36 metropolitan boroughs, 74 district/borough councils, 20 unitary authorities and various mayoral posts in England and elections to the new councils in Northern Ireland.

2014 Westminster City Council election

The 2014 Westminster City Council election took place on 22 May 2014 to elect members of Westminster City Council in England. This was on the same day as other local elections.

2015 United Kingdom local elections

The 2015 United Kingdom local elections were held on Thursday 7 May 2015, the same day as the general election for the House of Commons of the United Kingdom.

2015 Liverpool City Council election

The 2015 Liverpool City Council election took take place on 7 May 2015 to elect members of Liverpool City Council in England. This was on the same day as other local elections.

2015 Wirral Metropolitan Borough Council election

The 2015 Wirral Metropolitan Borough Council election took place on 7 May 2015 to elect members of Wirral Metropolitan Borough Council in England. This election was held on the same day as other local elections.

2017 United Kingdom local elections

The 2017 United Kingdom local elections were held on Thursday 4 May 2017. Local elections were held across Great Britain, with elections to 35 English local authorities and all councils in Scotland and Wales.

2018 United Kingdom local elections

Council elections in England were held on Thursday 3 May 2018. Elections were held in all 32 London boroughs, 34 metropolitan boroughs, 67 district and borough councils and 17 unitary authorities. There were also direct elections for the mayoralties of Hackney, Lewisham, Newham, Tower Hamlets and Watford.

2018 Tower Hamlets London Borough Council election

Elections to Tower Hamlets London Borough Council were held on 3 May 2018, the same day as other borough council elections in London. The directly-elected mayor of Tower Hamlets was also up for election.

2019 United Kingdom local elections

Local elections in the United Kingdom are scheduled to be held on Thursday 2 May 2019, contesting about 270 English local councils, six directly elected mayors in England, and all 11 local councils in Northern Ireland. Additionally, there will be by-elections for a number of local authority seats.

2018 Westminster City Council election

The 2018 Westminster City Council elections were held on 3rd May 2018, the same day as other London Boroughs. All 60 seats were up for election along with the 3 seats of Queen's Park Community Council. Despite initial expectations of Labour gains across the borough, the Conservative party were able to hold the council and only lost 3 seats. The Conservatives won the popular vote across the borough by a small margin of 923 votes (1.7%), but nonetheless won a decisive victory in terms of seats, winning 41 councillors to Labour's 19.