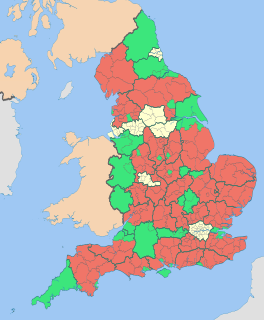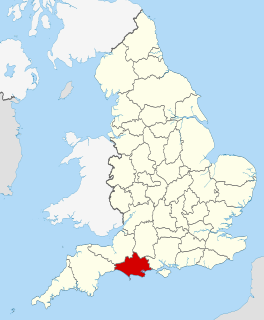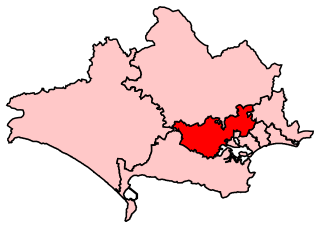
The 2011 East Dorset District Council election took place on 5 May 2011 to elect members of East Dorset District Council in Dorset, England. The whole council was up for election and the Conservative party stayed in overall control of the council. [1]
East Dorset is a local government district in Dorset, England. Its council is based in Wimborne Minster since 2016.
Non-metropolitan districts, or colloquially "shire districts", are a type of local government district in England. As created, they are sub-divisions of non-metropolitan counties in a two-tier arrangement.
Dorset is a county in South West England on the English Channel coast. The ceremonial county comprises the non-metropolitan county, which is governed by Dorset County Council, and the unitary authority areas of Poole and Bournemouth. Covering an area of 2,653 square kilometres (1,024 sq mi), Dorset borders Devon to the west, Somerset to the north-west, Wiltshire to the north-east, and Hampshire to the east. The county town is Dorchester which is in the south. After the reorganisation of local government in 1974 the county's border was extended eastward to incorporate the Hampshire towns of Bournemouth and Christchurch. Around half of the population lives in the South East Dorset conurbation, while the rest of the county is largely rural with a low population density.
Before the election the Conservatives had a majority on the council with 25 seats, compared to 11 Liberal Democrats. [2] Every seat was up for election, however 12 Conservative councillors, including the leader of the council Spencer Flower, faced no opposition at the election. [2] The candidates at the election were 36 Conservatives, 18 Liberal Democrats, 10 UK Independence Party and 3 from Labour. [2]
The Liberal Democrats are a liberal political party in the United Kingdom. They presently have 11 Members of Parliament in the House of Commons, 96 members of the House of Lords, and one member of the European Parliament. They also have five Members of the Scottish Parliament and a member each in the Welsh Assembly and London Assembly. The party reached the height of its influence in the early 2010s, forming a junior partner in a coalition government from 2010 to 2015. It is presently led by Vince Cable.
A Councillor is a member of a local government council.
The UK Independence Party is a hard Eurosceptic, right-wing political party in the United Kingdom. It currently has one representative in the House of Lords and seven Members of the European Parliament (MEPs). It has four Assembly Members (AMs) in the National Assembly for Wales and one member in the London Assembly. The party reached its greatest level of success in the mid-2010s, when it gained two Members of Parliament and was the largest UK party in the European Parliament.
The Conservatives gained 5 seats from the Liberal Democrats to have 30 councillors, compared to 6 for the Liberal Democrats. [3] Conservative gains including taking seats in West Moors and Corfe Mullen from the Liberal Democrats, with the margin in Corfe Mullen South ward being only 6 votes. [4] Overall turnout at the election was 49.1%. [5]
West Moors is a village in East Dorset, England, on the northern fringe of the Poole-Bournemouth conurbation, just outside the larger settlements of Ferndown and Verwood. The parish of West Moors had an estimated population of 7,400 in 2004, increasing to 7,561 for both the parish and electoral ward at the 2011 Census.
Corfe Mullen is a village in Dorset, England, on the north-western urban fringe of the South East Dorset conurbation and is part of the rural district of East Dorset. The village has a population of 10,133 (2011) and is served by six churches, five pubs, five schools, a library, various shops and local businesses, a village hall, and many community and sports organisations. There are three electoral wards within the village.
The wards and electoral divisions in the United Kingdom are electoral districts at sub-national level represented by one or more councillors. The ward is the primary unit of English electoral geography for civil parishes and borough and district councils, electoral ward is the unit used by Welsh principal councils, while the electoral division is the unit used by English county councils and some unitary authorities. Each ward/division has an average electorate of about 5,500 people, but ward-population counts can vary substantially. As at the end of 2014 there were 9,456 electoral wards/divisions in the UK.
Party | Seats | Gains | Losses | Net gain/loss | Seats % | Votes % | Votes | +/− | |
---|---|---|---|---|---|---|---|---|---|
Conservative | 30 | 5 | 0 | +5 | 83.3 | 60.8 | 23,205 | -1.2% | |
Liberal Democrat | 6 | 0 | 5 | -5 | 16.7 | 29.2 | 11,161 | -3.6% | |
UKIP | 0 | 0 | 0 | 0 | 0 | 7.3 | 2,803 | +3.2% | |
Labour | 0 | 0 | 0 | 0 | 0 | 2.7 | 1,027 | +2.0% |
Party | Candidate | Votes | % | ± | |
---|---|---|---|---|---|
Conservative | Ian Monks | unopposed | |||
Conservative hold | Swing |
Party | Candidate | Votes | % | ± | |
---|---|---|---|---|---|
Conservative | Pauline Reynolds | 703 | 74.4 | -5.0 | |
Liberal Democrat | Roger Hemsley | 242 | 25.6 | +5.0 | |
Majority | 461 | 48.8 | -10.0 | ||
Turnout | 945 | 48.0 | +8.4 | ||
Conservative hold | Swing |
Party | Candidate | Votes | % | ± | |
---|---|---|---|---|---|
Liberal Democrat | Janet Dover | 1,066 | |||
Liberal Democrat | Donald Wallace | 765 | |||
Conservative | David Mitchell | 668 | |||
Conservative | Kevin Johnson | 667 | |||
Labour | Oliver Bradbury | 200 | |||
UKIP | Kenneth Dacombe | 175 | |||
Turnout | 3,541 | 52.2 | +8.4 | ||
Liberal Democrat hold | Swing | ||||
Liberal Democrat hold | Swing |
Party | Candidate | Votes | % | ± | |
---|---|---|---|---|---|
Conservative | David Packer | 729 | 66.0 | +8.0 | |
Liberal Democrat | Linda Dickins | 375 | 34.0 | -0.7 | |
Majority | 354 | 32.1 | +7.8 | ||
Turnout | 1,104 | 58.9 | +11.2 | ||
Conservative hold | Swing |
Party | Candidate | Votes | % | ± | |
---|---|---|---|---|---|
Liberal Democrat | John Holland | 813 | |||
Conservative | Sarah Burns | 759 | |||
Liberal Democrat | Phillip Cuckston | 735 | |||
Conservative | Zoe White | 667 | |||
UKIP | Dave Evans | 299 | |||
Turnout | 3,273 | 45.8 | +5.0 | ||
Liberal Democrat hold | Swing | ||||
Conservative gain from Liberal Democrat | Swing | ||||
Party | Candidate | Votes | % | ± | |
---|---|---|---|---|---|
Liberal Democrat | Anne Holland | 540 | 59.3 | -2.3 | |
Conservative | Graeme Smith | 371 | 40.7 | +12.2 | |
Majority | 169 | 18.6 | -14.4 | ||
Turnout | 911 | 48.9 | +8.4 | ||
Liberal Democrat hold | Swing |
Party | Candidate | Votes | % | ± | |
---|---|---|---|---|---|
Conservative | Patrick Edwards | 418 | 43.5 | +0.0 | |
Liberal Democrat | Philip Harknett | 412 | 42.8 | -13.7 | |
UKIP | Josephine Evans | 132 | 13.7 | +13.7 | |
Majority | 6 | 0.6 | |||
Turnout | 962 | 46.7 | +5.2 | ||
Conservative gain from Liberal Democrat | Swing | ||||
Party | Candidate | Votes | % | ± | |
---|---|---|---|---|---|
Conservative | Stephen Butler | unopposed | |||
Conservative hold | Swing |
Party | Candidate | Votes | % | ± | |
---|---|---|---|---|---|
Conservative | Derek Burt | unopposed | |||
Conservative | Steven Lugg | unopposed | |||
Conservative hold | Swing | ||||
Conservative hold | Swing |
Party | Candidate | Votes | % | ± | |
---|---|---|---|---|---|
Conservative | Malcolm Birr | unopposed | |||
Conservative | John Little | unopposed | |||
Conservative hold | Swing | ||||
Conservative hold | Swing |
Party | Candidate | Votes | % | ± | |
---|---|---|---|---|---|
Conservative | Simon Tong | unopposed | |||
Conservative hold | Swing |
Party | Candidate | Votes | % | ± | |
---|---|---|---|---|---|
Conservative | Spencer Flower | unopposed | |||
Conservative hold | Swing |
Party | Candidate | Votes | % | ± | |
---|---|---|---|---|---|
Conservative | Gladys Elliot | 606 | 68.4 | +2.5 | |
UKIP | John Baxter | 280 | 31.6 | +14.8 | |
Majority | 326 | 36.8 | -11.8 | ||
Turnout | 886 | 46.5 | +6.7 | ||
Conservative hold | Swing |
Party | Candidate | Votes | % | ± | |
---|---|---|---|---|---|
Conservative | Barbara Manuel | 1,482 | |||
Conservative | John Wilson | 1,430 | |||
Liberal Democrat | Matthew Coussell | 487 | |||
Turnout | 3,399 | 52.9 | +12.3 | ||
Conservative hold | Swing | ||||
Conservative hold | Swing |
Party | Candidate | Votes | % | ± | |
---|---|---|---|---|---|
Conservative | Michael Dyer | 1,520 | |||
Conservative | Ann Warman | 1,501 | |||
UKIP | Oliver Kent | 371 | |||
UKIP | Allan Tallett | 321 | |||
Turnout | 3,713 | 51.6 | +7.6 | ||
Conservative hold | Swing | ||||
Conservative hold | Swing |
Party | Candidate | Votes | % | ± | |
---|---|---|---|---|---|
Conservative | Raymond Dudman | 1,022 | 81.4 | -4.3 | |
UKIP | Alfred Eckel | 233 | 18.6 | +4.3 | |
Majority | 789 | 62.9 | -8.5 | ||
Turnout | 1,255 | 61.7 | +9.7 | ||
Conservative hold | Swing |
Party | Candidate | Votes | % | ± | |
---|---|---|---|---|---|
Conservative | George Russell | 688 | 72.9 | -1.0 | |
Liberal Democrat | Timothy Chant | 132 | 14.0 | -0.9 | |
UKIP | John Myers | 124 | 13.1 | +1.9 | |
Majority | 556 | 58.9 | -0.1 | ||
Turnout | 944 | 48.6 | +3.1 | ||
Conservative hold | Swing |
Party | Candidate | Votes | % | ± | |
---|---|---|---|---|---|
Conservative | Paul Bennett | 678 | 73.3 | +5.2 | |
Liberal Democrat | William Honeyman | 247 | 26.7 | -5.2 | |
Majority | 431 | 46.6 | +10.4 | ||
Turnout | 925 | 47.0 | +7.3 | ||
Conservative hold | Swing |
Party | Candidate | Votes | % | ± | |
---|---|---|---|---|---|
Conservative | Peter Richardson | 451 | 67.4 | +21.4 | |
Liberal Democrat | Lindsey Dedden | 218 | 32.6 | +18.7 | |
Majority | 233 | 34.8 | +15.0 | ||
Turnout | 669 | 37.7 | +4.1 | ||
Conservative hold | Swing |
Party | Candidate | Votes | % | ± | |
---|---|---|---|---|---|
Conservative | Toni Coombs | unopposed | |||
Conservative | Jean Hazel | unopposed | |||
Conservative hold | Swing | ||||
Conservative hold | Swing |
Party | Candidate | Votes | % | ± | |
---|---|---|---|---|---|
Conservative | Boyden Mortimer | 531 | 69.2 | +6.3 | |
Liberal Democrat | Alan Dorey | 236 | 30.8 | -6.3 | |
Majority | 295 | 38.5 | +12.7 | ||
Turnout | 767 | 39.5 | +7.7 | ||
Conservative hold | Swing |
Party | Candidate | Votes | % | ± | |
---|---|---|---|---|---|
Conservative | Lucy Clark | unopposed | |||
Conservative | Simon Gibson | unopposed | |||
Conservative hold | Swing | ||||
Conservative hold | Swing |
Party | Candidate | Votes | % | ± | |
---|---|---|---|---|---|
Conservative | Alexander Clarke | 1,923 | |||
Conservative | David Shortell | 1,781 | |||
Conservative | Andrew Skeats | 1,607 | |||
Liberal Democrat | Peter Holden | 986 | |||
Liberal Democrat | Nicholas Smith | 751 | |||
UKIP | David Butt | 540 | |||
Labour | Michael Shine | 470 | |||
Turnout | 8,058 | 50.4 | +5.3 | ||
Conservative hold | Swing | ||||
Conservative gain from Liberal Democrat | Swing | ||||
Party | Candidate | Votes | % | ± | |
---|---|---|---|---|---|
Liberal Democrat | Patricia Hymers | 1,220 | |||
Conservative | Robin Cook | 1,169 | |||
Liberal Democrat | David Morgan | 993 | |||
Conservative | Michael Bartlett | 973 | |||
Liberal Democrat | Shane Bartlett | 943 | |||
Conservative | Alan Spencer | 861 | |||
Labour | Marion Lock | 357 | |||
UKIP | Nicholas Wellstead | 328 | |||
Turnout | 6,844 | 49.1 | +7.5 | ||
Liberal Democrat hold | Swing | ||||
Conservative gain from Liberal Democrat | Swing | ||||
Liberal Democrat hold | Swing |
A by-election was held in Colehill East ward on 17 July 2014 after the death of the Liberal Democrat councillor since 1973, Don Wallace. [7] [8] The seat was held for the Liberal Democrats by Barry Roberts with a majority of 416 votes over the Conservatives. [9]
By-elections, also spelled bye-elections, are used to fill elected offices that have become vacant between general elections.
Colehill is a parish, neighbouring Wimborne Minster, in Dorset, England, with a population of 7,000 (2001), reducing slightly to 6,927 at the 2011 census.
Party | Candidate | Votes | % | ± | |
---|---|---|---|---|---|
Liberal Democrat | Barry Roberts | 742 | 59.3 | +8.7 | |
Conservative | Graeme Smith | 326 | 26.0 | -5.6 | |
UKIP | David Mattocks | 184 | 14.7 | +6.4 | |
Majority | 416 | 33.2 | |||
Turnout | 1,252 | 33.7 | -18.5 | ||
Liberal Democrat hold | Swing |
Mid Dorset and North Poole is a constituency represented in the House of Commons of the UK Parliament since 2015 by Michael Tomlinson, a Conservative.
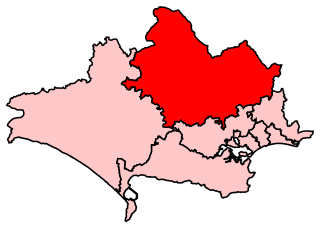
North Dorset is a constituency represented in the House of Commons of the UK Parliament by Simon Hoare, a Conservative.
Christchurch Borough Council in Dorset, England is elected every four years. Since the last boundary changes in 2003, 24 councillors have been elected from 11 wards.
One-third of Weymouth and Portland District Council in Dorset, England, is elected each year, followed by one year where there is an election to Dorset County Council instead.
Elections to Weymouth and Portland Borough Council in Dorset, England were held on 1 May 2008. One third of the council was up for election and the council stayed under no overall control as it has been since 1980.
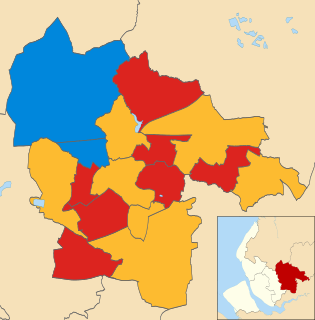
The 2007 St Helens Metropolitan Borough Council election took place on 3 May 2007 to elect members of St Helens Metropolitan Borough Council in Merseyside, England. One third of the council was up for election and the council stayed under no overall control.
East Dorset District Council in Dorset, England is elected every four years. Since the last boundary changes in 2015, 29 councillors have been elected from 16 wards.
The 2008 Colchester Borough Council election took place on 1 May 2008 to elect members of Colchester Borough Council in Essex, England. One third of the council was up for election and the Conservative party lost overall control of the council to no overall control.
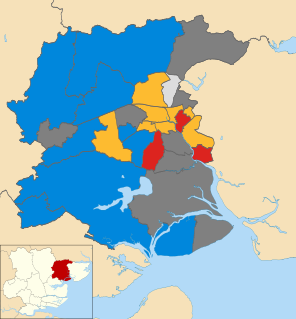
The 2011 Colchester Borough Council election took place on 5 May 2011 to elect members of Colchester Borough Council in Essex, England. One third of the council was up for election and the council stayed under no overall control.
The 2007 East Dorset District Council election took place on 3 May 2007 to elect members of East Dorset District Council in Dorset, England. The whole council was up for election and the Conservative party stayed in overall control of the council.
The 2007 Torridge District Council election took place on 3 May 2007 to elect members of Torridge District Council in Devon, England. The whole council was up for election and independents lost overall control of the council to no overall control.
The 2011 Torridge District Council election took place on 5 May 2011 to elect members of Torridge District Council in Devon, England. The whole council was up for election and the council stayed under no overall control.
The 2015 North Dorset District Council election took place on the 7th May 2015 to elect members of North Dorset District Council in England. This was on the same day as other local elections. All 33 seats were up for election, in 19 different wards. The Conservative party stayed in overall control of the council.
The 2011 Wychavon District Council election took place on 5 May 2011 to elect members of Wychavon District Council in Worcestershire, England. The whole council was up for election and the Conservative party stayed in overall control of the council.
The 2015 East Dorset District Council election took place on 7 May 2015 in order to elect members of the East Dorset District Council in Dorset, England. The whole council was up for election after boundary changes reduced the number of seats by seven. The Conservative party stayed in overall control of the council.
The 2003 Christchurch Borough Council election took place on 1 May 2003 to elect members of Christchurch Borough Council in Dorset, England. The whole council was up for election after boundary changes reduced the number of seats by one. The Conservative party stayed in overall control of the council.
The 2007 Christchurch Borough Council election took place on 3 May 2007 to elect members of Christchurch Borough Council in Dorset, England. The whole council was up for election and the Conservative party stayed in overall control of the council.
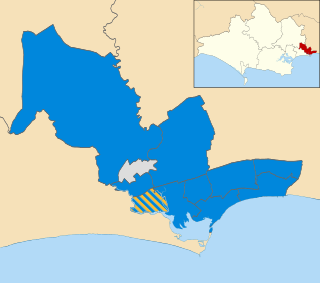
The 2011 Christchurch Borough Council election took place on 5 May 2011 to elect members of Christchurch Borough Council in Dorset, England. The whole council was up for election and the Conservative party stayed in overall control of the council.
The 2015 Christchurch Borough Council election took place on 7 May 2015 to elect members of Christchurch Borough Council in Dorset, England. The whole council was up for election and the Conservative party stayed in overall control of the council.