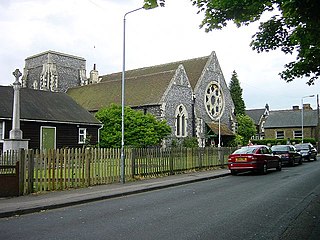
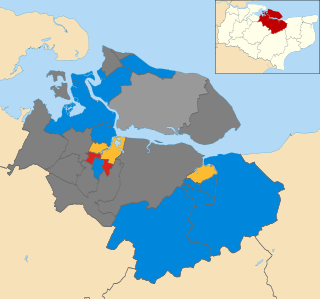
The 2011 Swale Borough Council election took place on 5 May 2011 to elect members of Swale Borough Council in Kent, England. The whole council was up for election and the Conservative party stayed in overall control of the council. [1]
Swale is a local government district with borough status in Kent, England and is bounded by Medway to the west, Canterbury to the east, Ashford to the south and Maidstone to the south west. Its council is based in Sittingbourne. The district is named after the narrow channel called The Swale, that separates the mainland of Kent from the Isle of Sheppey, and which occupies the central part of the district.
Borough status in the United Kingdom is granted by royal charter to local government districts in England, Wales and Northern Ireland. The status is purely honorary, and does not give any additional powers to the council or inhabitants of the district. In Scotland, similarly chartered communities were known as royal burghs, although the status is no longer granted.
Kent is a county in South East England and one of the home counties. It borders Greater London to the north west, Surrey to the west and East Sussex to the south west. The county also shares borders with Essex along the estuary of the River Thames, and with the French department of Pas-de-Calais through the Channel Tunnel. The county town is Maidstone.
For the 2011 election Swale switched to having the whole council elected every four years, from the previous system where a third of the seats were elected each year, followed by one year without an election. [2] The decision was taken by the council in March 2010, after a consultation produced 162 responses in favour of the change and 136 responses against changing. [2] As a result, all 47 seats on the council were contested with over 120 candidates standing at election. [3]
The Conservatives remained in control of the council with 32 of the 47 seats, after a net loss of 1 seat. [1] Labour increased to 13 councillors, the Liberal Democrats were reduced to 1 seat and the only independent councillor retained her seat. [1] [4]
The Labour Party is a centre-left political party in the United Kingdom which has been described as an alliance of social democrats, democratic socialists and trade unionists. The party's platform emphasises greater state intervention, social justice and strengthening workers' rights. Labour is a full member of the Party of European Socialists and Progressive Alliance, and holds observer status in the Socialist International. As of 2017, the party was considered the "largest party in Western Europe" in terms of party membership, with more than half a million members.
A Councillor is a member of a local government council.
The Liberal Democrats are a liberal, centrist political party in the United Kingdom. They presently have 11 Members of Parliament in the House of Commons, 96 members of the House of Lords, and one member of the European Parliament. They also have five Members of the Scottish Parliament and a member each in the Welsh Assembly and London Assembly. The party reached the height of its influence in the early 2010s, forming a junior partner in a coalition government from 2010 to 2015. It is presently led by Vince Cable.
Labour's Mark Ellen regained a seat in Sheerness East that he had lost at the 2010 election, [5] while in Milton Regis Labour defeated the leader of the Liberal Democrat group Elvie Lowe who had represented the ward for 24 years. [6] However the Conservatives took a seat from Labour in St Michaels ward, where the Conservative deupty mayoress Sylvia Bennett gained a seat on the council. [5]
Sheerness is a town beside the mouth of the River Medway on the north-west corner of the Isle of Sheppey in north Kent, England. With a population of 12,000 it is the largest town on the island.
Milton Regis is a village in the district of Swale in Kent, England. Former names include Milton-next-Sittingbourne, Milton Royal, Middleton, Midletun and Middletune. It has a population of about 5,000. Today it is a suburb of Sittingbourne although this has not always been the case, Milton Regis has the older and richer history. Until around 1800 Sittingbourne was a smaller hamlet and under the control of the Manor of Milton Regis.
In West Downs the only independent councillor, Monique Bonney, held her seat defeating Conservative county councillor Mike Whiting by 41 votes. [4] Meanwhile, the closest result came in Murston where both the Conservative and Liberal Democrat councillors, Ed Gent and Dave Banks, took 420 votes after six recounts. [5] Conservative Ed Gent took the seat after his name was pulled out of a hat and he was therefore given one extra vote. [6] This meant Mike Henderson was the only Liberal Democrat to be elected after he held his seat in Davington Priory. [7]
Murston is a suburb of Sittingbourne in Kent, England. It is about 1 mile north-east of central Sittingbourne, on the east bank of the Milton Creek.
Davington is a suburb of Faversham in Kent, England.
Following the election Roger Truelove became the new leader of the Labour group, replacing the leader for the previous 15 years Angela Harrison. [8] The only Liberal Democrat councillor, Mike Henderson, meanwhile joined with the independent councillor Monique Bonney in the independent group on the council to ensure they both got positions on council committees. [8]
Party | Seats | Gains | Losses | Net gain/loss | Seats % | Votes % | Votes | +/− | |
---|---|---|---|---|---|---|---|---|---|
Conservative | 32 | 1 | 2 | -1 | 68.1 | 50.4 | 33,548 | +0.2% | |
Labour | 13 | 4 | 1 | +3 | 27.7 | 34.8 | 23,188 | +5.3% | |
Liberal Democrat | 1 | 0 | 2 | -2 | 2.1 | 6.8 | 4,520 | -9.3% | |
Independent | 1 | 0 | 0 | 0 | 2.1 | 1.0 | 635 | +1.0% | |
UKIP | 0 | 0 | 0 | 0 | 0 | 5.5 | 3,683 | +1.8% | |
Green | 0 | 0 | 0 | 0 | 0 | 1.2 | 815 | +0.6% | |
Monster Raving Loony | 0 | 0 | 0 | 0 | 0 | 0.3 | 213 | +0.3% |
Party | Candidate | Votes | % | ± | |
---|---|---|---|---|---|
Conservative | Bryan Mulhern | 759 | |||
Conservative | Anita Walker | 682 | |||
Labour | Trevor Payne | 626 | |||
Labour | Fran Rehal | 536 | |||
Green | Gary Miller | 322 | |||
Liberal Democrat | David Evans | 191 | |||
Liberal Democrat | Richard Williams | 154 | |||
Turnout | 3,270 | 40.4 | -23.1 | ||
Conservative hold | Swing | ||||
Conservative hold | Swing |
Party | Candidate | Votes | % | ± | |
---|---|---|---|---|---|
Conservative | Nicholas Hampshire | 506 | 50.9 | -2.8 | |
UKIP | Michael Baldock | 361 | 36.3 | +36.3 | |
Labour | Matthew Partridge | 127 | 12.8 | -0.3 | |
Majority | 145 | 14.6 | -5.9 | ||
Turnout | 994 | 51.7 | +9.4 | ||
Conservative hold | Swing |
Party | Candidate | Votes | % | ± | |
---|---|---|---|---|---|
Conservative | Andrew Bowles | 1,291 | |||
Conservative | George Bobbin | 1,187 | |||
Labour | Ash Rehal | 586 | |||
Turnout | 3,064 | 49.1 | +11.7 | ||
Conservative hold | Swing | ||||
Conservative hold | Swing |
Party | Candidate | Votes | % | ± | |
---|---|---|---|---|---|
Labour | Roger Truelove | 900 | |||
Labour | Ghlin Whelan | 760 | |||
Conservative | Clive Duncan | 316 | |||
Conservative | Sandra Warham | 272 | |||
UKIP | Alison Donkin | 147 | |||
Liberal Democrat | Anthea Spurling | 141 | |||
Turnout | 2,536 | 39.8 | -23.8 | ||
Labour hold | Swing | ||||
Labour hold | Swing |
Party | Candidate | Votes | % | ± | |
---|---|---|---|---|---|
Liberal Democrat | Michael Henderson | 360 | 43.8 | -14.4 | |
Conservative | Andy Culham | 256 | 31.2 | +3.6 | |
Labour | Caroline MacDonald | 145 | 17.7 | +3.5 | |
Green | Tim Valentine | 60 | 7.3 | +7.3 | |
Majority | 104 | 12.7 | -17.9 | ||
Turnout | 821 | 44.1 | -0.2 | ||
Liberal Democrat hold | Swing |
Party | Candidate | Votes | % | ± | |
---|---|---|---|---|---|
Conservative | Colin Prescott | 731 | 65.4 | -12.2 | |
Labour | Barry Hefferon | 299 | 26.8 | +4.4 | |
UKIP | Nadine McDermott | 87 | 7.8 | +7.8 | |
Majority | 432 | 38.7 | -16.5 | ||
Turnout | 1,117 | 53.3 | +11.9 | ||
Conservative hold | Swing |
Party | Candidate | Votes | % | ± | |
---|---|---|---|---|---|
Conservative | Duncan Dewar-Whalley | 792 | |||
Conservative | Gareth Randall | 781 | |||
Labour | Richard Raycraft | 488 | |||
Labour | Peter Wilson | 422 | |||
UKIP | Ian Davison | 418 | |||
Liberal Democrat | Bernie Lowe | 226 | |||
Turnout | 3,127 | 38.5 | -25.2 | ||
Conservative hold | Swing | ||||
Conservative hold | Swing |
Party | Candidate | Votes | % | ± | |
---|---|---|---|---|---|
Conservative | Gerry Lewin | 1,031 | |||
Conservative | John Wright | 836 | |||
UKIP | Richard Palmer | 509 | |||
Labour | James Graham | 418 | |||
Labour | David Walker | 339 | |||
Turnout | 3,133 | 45.2 | -27.3 | ||
Conservative hold | Swing | ||||
Conservative hold | Swing |
Party | Candidate | Votes | % | ± | |
---|---|---|---|---|---|
Conservative | Ben Stokes | 712 | 52.6 | -5.9 | |
Labour | Janet Gregory | 509 | 37.6 | +21.6 | |
UKIP | Christopher Trafford | 77 | 5.7 | +5.7 | |
Liberal Democrat | Peter Springham | 56 | 4.1 | -21.3 | |
Majority | 203 | 15.0 | -18.1 | ||
Turnout | 1,354 | 44.9 | +10.1 | ||
Conservative hold | Swing |
Party | Candidate | Votes | % | ± | |
---|---|---|---|---|---|
Conservative | Brenda Simpson | 830 | |||
Conservative | Sue Gent | 797 | |||
Labour | Tony Phillips | 461 | |||
Labour | Bradley Wise | 397 | |||
UKIP | Peter Paige | 230 | |||
Liberal Democrat | Mary Zeng | 122 | |||
Turnout | 2,837 | 33.4 | -29.3 | ||
Conservative hold | Swing | ||||
Conservative hold | Swing |
Party | Candidate | Votes | % | ± | |
---|---|---|---|---|---|
Conservative | Pat Sandle | 438 | 62.8 | +33.9 | |
Labour | Matt Wheatcroft | 259 | 37.2 | +25.1 | |
Majority | 179 | 25.7 | |||
Turnout | 697 | 32.3 | -1.0 | ||
Conservative hold | Swing |
Party | Candidate | Votes | % | ± | |
---|---|---|---|---|---|
Labour | Adam Tolhurst | 527 | |||
Labour | Tony Winckless | 491 | |||
Liberal Democrat | Elvie Lowe | 353 | |||
Conservative | Margaret Bridge | 331 | |||
Conservative | Eileen Hodgson | 289 | |||
Liberal Democrat | David Spurling | 227 | |||
Monster Raving Loony | Sheikh Mihand | 42 | |||
Turnout | 2,260 | 37.2 | +4.4 | ||
Labour hold | Swing | ||||
Labour gain from Liberal Democrat | Swing | ||||
Party | Candidate | Votes | % | ± | |
---|---|---|---|---|---|
Conservative | Adrian Crowther | 1,148 | |||
Conservative | Ken Pugh | 1,057 | |||
Conservative | Andy Booth | 910 | |||
Labour | Jamie Bicknell | 533 | |||
Labour | Libby Tucker | 532 | |||
Labour | Mark Tucker | 484 | |||
UKIP | Maureen Morgan | 390 | |||
Turnout | 5,054 | 38.5 | -26.0 | ||
Conservative hold | Swing | ||||
Conservative hold | Swing |
Party | Candidate | Votes | % | ± | |
---|---|---|---|---|---|
Labour | Nick Williams | 482 | |||
Conservative | Ed Gent | 421 | |||
Liberal Democrat | Dave Banks | 420 | |||
Labour | Paul Williams | 369 | |||
Liberal Democrat | Keith Nevols | 236 | |||
Turnout | 1,928 | 32.3 | -24.0 | ||
Labour gain from Liberal Democrat | Swing | ||||
Conservative hold | Swing |
Party | Candidate | Votes | % | ± | |
---|---|---|---|---|---|
Labour | Jackie Constable | 908 | |||
Conservative | Peter Marchington | 846 | |||
Labour | Mick Constable | 841 | |||
Conservative | Richard Darby | 812 | |||
Conservative | Mick Galvin | 754 | |||
Labour | Julian Stewart | 625 | |||
Liberal Democrat | Sandy Sims | 149 | |||
Turnout | 4,935 | 36.9 | -23.9 | ||
Labour hold | Swing | ||||
Conservative hold | Swing | ||||
Labour hold | Swing |
Party | Candidate | Votes | % | ± | |
---|---|---|---|---|---|
Labour | Mike Haywood | 752 | |||
Labour | Martin McCusker | 530 | |||
Conservative | Alan Blackley | 396 | |||
Conservative | Keith Ferrin | 279 | |||
UKIP | Aaron Donkin | 207 | |||
Liberal Democrat | Rosemary Madgwick | 119 | |||
Turnout | 2,283 | 36.2 | -24.5 | ||
Labour hold | Swing | ||||
Labour gain from Conservative | Swing | ||||
Party | Candidate | Votes | % | ± | |
---|---|---|---|---|---|
Labour | Mark Ellen | 504 | |||
Labour | David Sargent | 453 | |||
Conservative | Chris Foulds | 376 | |||
Conservative | Emma Bridge | 360 | |||
Liberal Democrat | Colin Howe | 98 | |||
Turnout | 1,791 | 31.8 | -19.1 | ||
Labour gain from Conservative | Swing | ||||
Labour hold | Swing |
Party | Candidate | Votes | % | ± | |
---|---|---|---|---|---|
Labour | Angela Harrison | 688 | |||
Labour | Stephen Worrall | 575 | |||
Conservative | David Wilson | 434 | |||
Liberal Democrat | David Kemp | 122 | |||
Turnout | 1,829 | 32.1 | -19.4 | ||
Labour hold | Swing | ||||
Labour hold | Swing |
Party | Candidate | Votes | % | ± | |
---|---|---|---|---|---|
Conservative | June Garrad | 911 | |||
Conservative | John Morris | 871 | |||
Conservative | Lesley Ingham | 838 | |||
Labour | Alan Henley | 664 | |||
Labour | Pat Wiggins | 618 | |||
Labour | Ian Smart | 557 | |||
UKIP | Rosemary Donkin | 326 | |||
Monster Raving Loony | Mad Mike Young | 171 | |||
Turnout | 4,956 | 32.0 | -37.7 | ||
Conservative hold | Swing | ||||
Conservative hold | Swing |
Party | Candidate | Votes | % | ± | |
---|---|---|---|---|---|
Conservative | Mike Cosgrove | 906 | |||
Conservative | John Coulter | 854 | |||
Labour | Judith Webb | 628 | |||
Labour | Paul Durkin | 627 | |||
Green | Tina Hagger | 224 | |||
Liberal Democrat | Brian Head | 154 | |||
Liberal Democrat | Richard Matthewman | 100 | |||
Turnout | 3,493 | 47.5 | -21.7 | ||
Conservative hold | Swing | ||||
Conservative hold | Swing |
Party | Candidate | Votes | % | ± | |
---|---|---|---|---|---|
Conservative | Derek Conway | 1,242 | |||
Conservative | Sylvia Bennett | 1,021 | |||
Labour | Shelley Cheesman | 521 | |||
Labour | Geraldine Feltham | 403 | |||
Liberal Democrat | Brenda Hammond | 317 | |||
UKIP | Stephen Trafford | 296 | |||
Turnout | 3,800 | 44.0 | +7.1 | ||
Conservative hold | Swing | ||||
Conservative gain from Labour | Swing | ||||
Party | Candidate | Votes | % | ± | |
---|---|---|---|---|---|
Conservative | Lloyd Bowen | 940 | |||
Conservative | Rick Barnicott | 857 | |||
Labour | Ian Buxton | 470 | |||
Labour | Gillian Griffiths | 460 | |||
UKIP | James Nash | 163 | |||
Independent | Graeme William | 107 | |||
Turnout | 2,997 | 42.4 | -23.9 | ||
Conservative hold | Swing | ||||
Conservative hold | Swing |
Party | Candidate | Votes | % | ± | |
---|---|---|---|---|---|
Conservative | David Simmons | 979 | |||
Conservative | Ted Wilcox | 941 | |||
Labour | Catherine Read | 430 | |||
Labour | Michael Wakeman | 364 | |||
Liberal Democrat | Ruth Cronk | 331 | |||
Liberal Democrat | Michael Wheeler | 329 | |||
Green | Huw Jones | 209 | |||
Turnout | 3,583 | 47.6 | -22.1 | ||
Conservative hold | Swing | ||||
Conservative hold | Swing |
Party | Candidate | Votes | % | ± | |
---|---|---|---|---|---|
Independent | Monique Bonney | 528 | 52.0 | -5.7 | |
Conservative | Mike Whiting | 487 | 48.0 | +5.7 | |
Majority | 41 | 4.0 | -11.3 | ||
Turnout | 1,015 | 52.1 | +8.1 | ||
Independent hold | Swing |
Party | Candidate | Votes | % | ± | |
---|---|---|---|---|---|
Conservative | Alan Willicombe | 1,121 | |||
Conservative | Jean Willicombe | 950 | |||
UKIP | Lee Burgess | 472 | |||
Labour | Margaret Cooper | 441 | |||
Labour | Andrew Cooper | 439 | |||
Liberal Democrat | Ann McLean | 315 | |||
Turnout | 3,738 | 53.7 | -24.4 | ||
Conservative hold | Swing | ||||
Conservative hold | Swing |
A by-election was held in Kemsley on 8 March 2012 after the death of Conservative councillor Brenda Simpson. [11] The seat was held for the Conservatives by Mike Whiting with a majority of 72 votes over Labour candidate Richard Raycraft. [11]
Party | Candidate | Votes | % | ± | |
---|---|---|---|---|---|
Conservative | Mike Whiting | 384 | 33.7 | -16.9 | |
Labour | Richard Raycraft | 312 | 27.3 | -0.7 | |
UKIP | Derek Carnell | 279 | 24.5 | +10.5 | |
Liberal Democrat | Berick Tomes | 166 | 14.5 | +7.1 | |
Majority | 72 | 6.3 | |||
Turnout | 1,141 | 23.2 | -10.2 | ||
Conservative hold | Swing |
A by-election was held in Sheppey Central on 16 October 2014 following the death of Conservative councillor John Morris. [12] The seat was gained for the UK Independence Party by David Jones with a majority of 507 votes over Conservative Tina Booth. [12] David Jones became the second UK Independence Party councillor on Swale council after the defection of Adrian Crowther from the Conservatives in 2013. [12]
Party | Candidate | Votes | % | ± | |
---|---|---|---|---|---|
UKIP | David Jones | 831 | 58.4 | +42.7 | |
Conservative | Tina Booth | 324 | 22.8 | -21.2 | |
Labour | Alan Henley | 240 | 16.9 | -15.2 | |
Monster Raving Loony | "Mad" Mike Young | 27 | 1.9 | +0.0 | |
Majority | 507 | 35.7 | |||
Turnout | 1,422 | 19.9 | -12.1 | ||
UKIP gain from Conservative | Swing | ||||
The 1999 St Helens Metropolitan Borough Council election took place on 6 May 1999 to elect members of St Helens Metropolitan Borough Council in Merseyside, England. One third of the council was up for election and the Labour party stayed in overall control of the council.
The 2008 St Helens Metropolitan Borough Council election took place on 1 May 2008 to elect members of St Helens Metropolitan Borough Council in Merseyside, England. One third of the council was up for election and the council stayed under no overall control.
The 2007 Redcar and Cleveland Borough Council election took place on 3 May 2007 to elect members of Redcar and Cleveland Unitary Council in England. The whole council was up for election and the council stayed under no overall control.
The 2003 Colchester Borough Council election took place on 1 May 2003 to elect members of Colchester Borough Council in Essex, England. This was the same day as the other 2003 United Kingdom local elections. One third of the seats were up for election and the council stayed under no overall control.
The 2008 Colchester Borough Council election took place on 1 May 2008 to elect members of Colchester Borough Council in Essex, England. One third of the council was up for election and the Conservative party lost overall control of the council to no overall control.
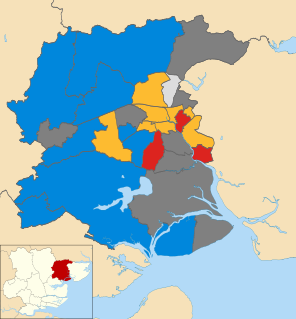
The 2011 Colchester Borough Council election took place on 5 May 2011 to elect members of Colchester Borough Council in Essex, England. One third of the council was up for election and the council stayed under no overall control.
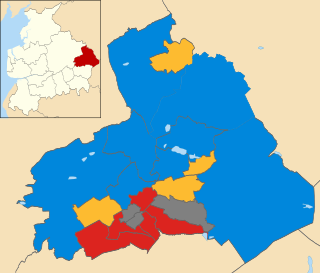
The 2014 Colchester Borough Council election took place on 22 May 2014 to elect members of Colchester Borough Council in Essex, England. One third of the council was up for election and the council stayed under no overall control.
The 2011 Pendle Borough Council election took place on 5 May 2011 to elect members of Pendle Borough Council in Lancashire, England. One third of the council was up for election and the council stayed under no overall control.
The 2012 Pendle Borough Council election took place on 3 May 2012 to elect members of Pendle Borough Council in Lancashire, England. One third of the council was up for election and the council stayed under no overall control.
The 2011 Torridge District Council election took place on 5 May 2011 to elect members of Torridge District Council in Devon, England. The whole council was up for election and the council stayed under no overall control.
The 2012 Huntingdonshire District Council election took place on 3 May 2012 to elect members of Huntingdonshire District Council in Cambridgeshire, England. One third of the council was up for election and the Conservative party stayed in overall control of the council.
The 2004 Swale Borough Council election took place on 10 June 2004 to elect members of Swale Borough Council in Kent, England. One third of the council was up for election and the Conservative party stayed in overall control of the council.
The 2006 Swale Borough Council election took place on 4 May 2006 to elect members of Swale Borough Council in Kent, England. One third of the council was up for election and the Conservative party stayed in overall control of the council.
The 2007 Swale Borough Council election took place on 3 May 2007 to elect members of Swale Borough Council in Kent, England. One third of the council was up for election and the Conservative party stayed in overall control of the council.
The 2008 Swale Borough Council election took place on 1 May 2008 to elect members of Swale Borough Council in Kent, England. One third of the council was up for election and the Conservative party stayed in overall control of the council.
The 2010 Swale Borough Council election took place on 6 May 2010 to elect members of Swale Borough Council in Kent, England. One third of the council was up for election and the Conservative party stayed in overall control of the council.
An election was held in Swale Borough Council in England as part of the United Kingdom local elections on 7 May 2015. All 47 seats were up for election under new ward boundaries.
The 2007 West Oxfordshire District Council election took place on 3 May 2007 to elect members of West Oxfordshire District Council in Oxfordshire, England. One third of the council was up for election and the Conservative party stayed in overall control of the council.
The 2012 West Oxfordshire District Council election took place on 3 May 2012 to elect members of West Oxfordshire District Council in Oxfordshire, England. One third of the council was up for election and the Conservative party stayed in overall control of the council.
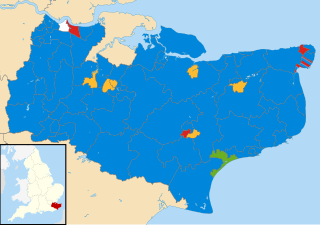
The 2017 Kent County Council election was held on 4 May 2017 as part of the 2017 local elections in the United Kingdom. All 81 councillors were elected, from 72 electoral divisions, each of which returned either one or two county councillors by first-past-the-post voting for a four-year term of office.