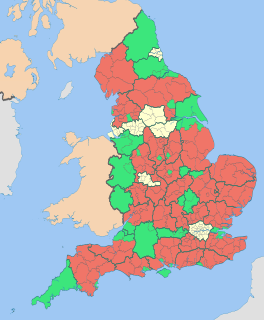
The 2011 Craven District Council election took place on 5 May 2011 to elect members of Craven District Council in North Yorkshire, England. One third of the council was up for election and the Conservative party stayed in overall control of the council. [1]
Craven is a local government district of North Yorkshire, England centred on the market town of Skipton. In 1974, Craven district was formed as the merger of Skipton urban district, Settle Rural District and most of Skipton Rural District, all in the West Riding of Yorkshire. The population of the Local Authority at the 2011 Census was 55,409. It comprises the upper reaches of Airedale, Wharfedale, Ribblesdale, and includes most of the Aire Gap and Craven Basin.
Non-metropolitan districts, or colloquially "shire districts", are a type of local government district in England. As created, they are sub-divisions of non-metropolitan counties in a two-tier arrangement.
North Yorkshire is a non-metropolitan county and largest ceremonial county in England. It is located primarily in the region of Yorkshire and the Humber but partly in the region of North East England. The estimated population of North Yorkshire was 602,300 in mid 2016.
After the election, the composition of the council was as follows:
The Conservative Party, officially the Conservative and Unionist Party, is a centre-right political party in the United Kingdom. Presently led by Theresa May, it has been the governing party since 2010. It presently has 314 Members of Parliament in the House of Commons, 249 members of the House of Lords, and 18 members of the European Parliament. It also has 31 Members of the Scottish Parliament, 12 members of the Welsh Assembly, eight members of the London Assembly and 9,008 local councillors. One of the major parties of UK politics, it has formed the government on 45 occasions, more than any other party.
The Liberal Democrats are a liberal political party in the United Kingdom. They presently have 11 Members of Parliament in the House of Commons, 96 members of the House of Lords, and one member of the European Parliament. They also have five Members of the Scottish Parliament and a member each in the Welsh Assembly and London Assembly. The party reached the height of its influence in the early 2010s, forming a junior partner in a coalition government from 2010 to 2015. It is presently led by Vince Cable.
There was no change in the political composition of the council after the election, with the Conservatives retaining a majority. [3] All nine councillors who were defending seats held them, with the closest result being in Skipton West where Liberal Democrat Polly English held the seat with a majority of 7 votes over Conservative candidate David Walsh. [3] The only new councillor after the election came in Gargrave and Malhamdale, where Conservative Simon Myers held the seat previously held by party colleague David Crawford, who stood down at the election. [3]
A Councillor is a member of a local government council.
Skipton is a market town and civil parish in the Craven district of North Yorkshire, England. Historically in the West Riding of Yorkshire, it is on the River Aire and the Leeds and Liverpool Canal to the south of the Yorkshire Dales, 16 miles (26 km) northwest of Bradford and 38 miles (61 km) west of York. At the 2011 Census, the population was 14,623.
Gargrave is a large village and civil parish in the Craven district located along the A65, 4 miles (6 km) north-west of Skipton in North Yorkshire, England. It is situated on the very edge of the Yorkshire Dales. The River Aire and the Leeds and Liverpool Canal pass through the village. It had a population of 1,764 in 2001 reducing slightly to 1,755 at the 2011 census.
The results meant the Conservatives retained 18 seats and there were 8 independent and 4 Liberal Democrat councillors following the election, while Labour did not win any seats despite standing in 8 of the 10 seats contested. [4]
The Labour Party is a centre-left political party in the United Kingdom which has been described as an alliance of social democrats, democratic socialists and trade unionists. The party's platform emphasises greater state intervention, social justice and strengthening workers' rights.
Party | Seats | Gains | Losses | Net gain/loss | Seats % | Votes % | Votes | +/− | |
---|---|---|---|---|---|---|---|---|---|
Independent | 5 | 0 | 0 | 0 | 50.0 | 35.1 | 4,127 | +14.9% | |
Conservative | 4 | 0 | 0 | 0 | 40.0 | 35.6 | 4,186 | -8.4% | |
Liberal Democrat | 1 | 0 | 0 | 0 | 10.0 | 10.3 | 1,207 | -17.9% | |
Labour | 0 | 0 | 0 | 0 | 0 | 17.2 | 2,025 | +11.9% | |
Green | 0 | 0 | 0 | 0 | 0 | 1.8 | 213 | +1.8% | |
Party | Candidate | Votes | % | ± | |
---|---|---|---|---|---|
Independent | Linda Barrington | 838 | 60.3 | +32.0 | |
Conservative | Gerald Hurtley | 552 | 39.7 | -2.6 | |
Majority | 286 | 20.6 | |||
Turnout | 1,390 | 47.1 | -23.3 | ||
Independent hold | Swing | ||||
Party | Candidate | Votes | % | ± | |
---|---|---|---|---|---|
Conservative | John Quinn | 496 | 61.5 | -1.9 | |
Labour | James Black | 217 | 26.9 | +26.9 | |
Liberal Democrat | John Manley | 93 | 11.5 | -25.1 | |
Majority | 279 | 34.6 | +7.8 | ||
Turnout | 806 | 53.7 | +8.0 | ||
Conservative hold | Swing | ||||
Party | Candidate | Votes | % | ± | |
---|---|---|---|---|---|
Conservative | Simon Myers | 907 | 65.6 | +3.4 | |
Labour | Christopher Baker | 346 | 25.0 | +25.0 | |
Liberal Democrat | Andrew Rankine | 130 | 9.4 | -28.4 | |
Majority | 561 | 40.6 | +16.1 | ||
Turnout | 1,383 | 55.6 | -20.1 | ||
Conservative hold | Swing | ||||
Party | Candidate | Votes | % | ± | |
---|---|---|---|---|---|
Independent | Graham Beck | 816 | 60.0 | -7.7 | |
Conservative | James Stafford | 303 | 22.3 | +0.6 | |
Labour | Robert Holland | 241 | 17.7 | +7.2 | |
Majority | 513 | 37.7 | -8.3 | ||
Turnout | 1,360 | 43.3 | -27.0 | ||
Independent hold | Swing | ||||
Party | Candidate | Votes | % | ± | |
---|---|---|---|---|---|
Conservative | Christopher Harbron | 589 | 44.8 | -5.7 | |
Liberal Democrat | Eric Jaquin | 405 | 30.8 | -8.6 | |
Labour | Christine Rose | 322 | 24.5 | +14.4 | |
Majority | 184 | 14.0 | +2.9 | ||
Turnout | 1,316 | 47.7 | +5.4 | ||
Conservative hold | Swing | ||||
Party | Candidate | Votes | % | ± | |
---|---|---|---|---|---|
Conservative | Marcia Turner | 518 | 34.8 | -22.6 | |
Independent | John Kerwin-Davey | 376 | 25.2 | +25.2 | |
Green | Claire Nash | 213 | 14.3 | +14.3 | |
Liberal Democrat | Roland Wohlrapp | 203 | 13.6 | -29.0 | |
Labour | Brigid Reeves | 180 | 12.1 | +12.1 | |
Majority | 142 | 9.5 | -5.3 | ||
Turnout | 1,490 | 53.1 | +6.6 | ||
Conservative hold | Swing | ||||
Party | Candidate | Votes | % | ± | |
---|---|---|---|---|---|
Independent | Robert Heseltine | 520 | 56.8 | +56.8 | |
Labour | Duncan Hall | 197 | 21.5 | +0.5 | |
Conservative | Martin Bellamy | 133 | 14.5 | -14.1 | |
Liberal Democrat | Lindsay Bottomley | 65 | 7.1 | -43.3 | |
Majority | 323 | 35.3 | |||
Turnout | 915 | 32.9 | +5.2 | ||
Independent hold | Swing | ||||
Party | Candidate | Votes | % | ± | |
---|---|---|---|---|---|
Liberal Democrat | Pauline English | 311 | 27.1 | -29.8 | |
Conservative | David Walsh | 304 | 26.5 | -16.6 | |
Labour | Peter Madeley | 250 | 21.8 | +21.8 | |
Independent | Bernard Clarke | 203 | 17.7 | +17.7 | |
Independent | James Paton | 80 | 7.0 | +7.0 | |
Majority | 7 | 0.6 | -35.1 | ||
Turnout | 1,148 | 39.1 | +3.4 | ||
Liberal Democrat hold | Swing | ||||
Party | Candidate | Votes | % | ± | |
---|---|---|---|---|---|
Independent | Kenneth Hart | 871 | 76.2 | +8.9 | |
Labour | Keith Reeves | 272 | 23.8 | +11.5 | |
Majority | 599 | 52.4 | +5.5 | ||
Turnout | 1,143 | 40.4 | -27.7 | ||
Independent hold | Swing | ||||
Party | Candidate | Votes | % | ± | |
---|---|---|---|---|---|
Independent | Robert Mason | 423 | 52.4 | -0.9 | |
Conservative | Piers Tempest | 384 | 47.6 | +0.9 | |
Majority | 39 | 4.8 | -1.8 | ||
Turnout | 807 | 51.5 | +0.9 | ||
Independent hold | Swing | ||||
The 1998 Craven District Council election took place on 7 May 1998 to elect members of Craven District Council in North Yorkshire, England. One third of the council was up for election and the Liberal Democrats lost overall control of the council to no overall control.
The 1999 Craven District Council election took place on 6 May 1999 to elect members of Craven District Council in North Yorkshire, England. One third of the council was up for election and the Conservative party gained overall control of the council from no overall control.
The 2000 Craven District Council election took place on 4 May 2000 to elect members of Craven District Council in North Yorkshire, England. One third of the council was up for election and the Conservative party stayed in overall control of the council.
The 2002 Craven District Council election took place on 2 May 2002 to elect members of Craven District Council in North Yorkshire, England. The whole council was up for election with boundary changes since the last election in 2000 reducing the number of seats by 4. The council stayed under no overall control.
The 2003 Craven District Council election took place on 1 May 2003 to elect members of Craven District Council in North Yorkshire, England. One third of the council was up for election and the council stayed under no overall control.
The 2004 Craven District Council election took place on 10 June 2004 to elect members of Craven District Council in North Yorkshire, England. One third of the council was up for election and the council stayed under no overall control.
The 2007 Craven District Council election took place on 3 May 2007 to elect members of Craven District Council in North Yorkshire, England. One third of the council was up for election and the council stayed under no overall control.
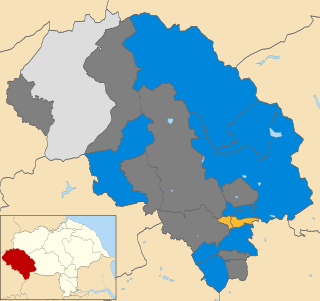
The 2008 Craven District Council election took place on 1 May 2008 to elect members of Craven District Council in North Yorkshire, England. One third of the council was up for election and the council stayed under no overall control.
The 2010 Craven District Council election took place on 6 May 2010 to elect members of Craven District Council in North Yorkshire, England. One third of the council was up for election and the Conservative party gained overall control of the council from no overall control.
The 1999 Pendle Borough Council election took place on 6 May 1999 to elect members of Pendle Borough Council in Lancashire, England. One third of the council was up for election and the Liberal Democrats lost overall control of the council to no overall control.
The 2007 Pendle Borough Council election took place on 3 May 2007 to elect members of Pendle Borough Council in Lancashire, England. One third of the council was up for election and the Liberal Democrats stayed in overall control of the council.
The 2011 Tandridge District Council election took place on 5 May 2011 to elect members of Tandridge District Council in Surrey, England. One third of the council was up for election and the Conservative party stayed in overall control of the council.
The 2012 Pendle Borough Council election took place on 3 May 2012 to elect members of Pendle Borough Council in Lancashire, England. One third of the council was up for election and the council stayed under no overall control.
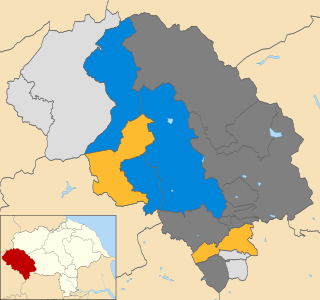
The 2006 Craven District Council election took place on 4 May 2006 to elect members of Craven District Council in North Yorkshire, England. One third of the council was up for election and the council stayed under no overall control.
The 2012 Craven District Council election took place on 3 May 2012 to elect members of Craven District Council in North Yorkshire, England. One third of the council was up for election and the Conservative party stayed in overall control of the council.
The 2014 Craven District Council election took place on 22 May 2014 to elect members of Craven District Council in North Yorkshire, England. One third of the council was up for election and the Conservative party stayed in overall control of the council.
The 2003 West Oxfordshire District Council election took place on 1 May 2003 to elect members of West Oxfordshire District Council in Oxfordshire, England. One third of the council was up for election and the Conservative party stayed in overall control of the council.
The 2007 West Oxfordshire District Council election took place on 3 May 2007 to elect members of West Oxfordshire District Council in Oxfordshire, England. One third of the council was up for election and the Conservative party stayed in overall control of the council.
The 1999 Richmondshire District Council election took place on 6 May 1999 to elect members of Richmondshire District Council in North Yorkshire, England. The whole council was up for election and independents lost overall control of the council to no overall control.
The 2003 Richmondshire District Council election took place on 1 May 2003 to elect members of Richmondshire District Council in North Yorkshire, England. The whole council was up for election with boundary changes since the last election in 1999. The council stayed under no overall control.