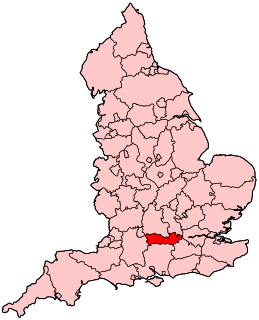
The 2011 West Berkshire Council election took place on 5 May 2011 to elect members of West Berkshire Council in Berkshire, England. The whole council was up for election and the Conservative party stayed in overall control of the council. [1]
West Berkshire Council is the local authority of West Berkshire in Berkshire, England. It is a unitary authority, having the powers of a non-metropolitan county and district council combined. West Berkshire is divided into 30 wards, electing 52 councillors. The council was created by the Local Government Act 1972 as the Newbury District Council and replaced five local authorities: Bradfield Rural District Council, Hungerford Rural District Council, Newbury Borough Council, Newbury Rural District Council and Wantage Rural District Council. On 1 April 1998 it was renamed West Berkshire Council and since then has been a unitary authority, assuming the powers and functions of Berkshire County Council. In the 2015 election the Conservatives won 48 out of 52 seats. The next election to the authority will be in 2019.
Berkshire is one of the home counties in England. It was recognised by the Queen as the Royal County of Berkshire in 1957 because of the presence of Windsor Castle, and letters patent were issued in 1974. Berkshire is a county of historic origin, a ceremonial county and a non-metropolitan county without a county council. The county town is Reading.
England is a country that is part of the United Kingdom. It shares land borders with Wales to the west and Scotland to the north-northwest. The Irish Sea lies west of England and the Celtic Sea lies to the southwest. England is separated from continental Europe by the North Sea to the east and the English Channel to the south. The country covers five-eighths of the island of Great Britain, which lies in the North Atlantic, and includes over 100 smaller islands, such as the Isles of Scilly and the Isle of Wight.
At the last election in 2007 the Conservatives won a majority of 20 seats, with 36 councillors, compared to 16 for the Liberal Democrats. [2] By the time of the 2011 election 2 seats were vacant after the death of Liberal Democrat councillor Keith Lock from Mortimer ward and the resignation of Conservative councillor Ellen Crumly from Thatcham Central ward. [3]
A Councillor is a member of a local government council.
The Liberal Democrats are a liberal political party in the United Kingdom. It is currently led by Vince Cable. They have 11 Members of Parliament in the House of Commons, 96 members of the House of Lords, one member of the European Parliament, five Members of the Scottish Parliament and one member in the Welsh Assembly and London Assembly. At the height of its influence, the party formed a coalition government with the Conservative Party from 2010 to 2015 with its leader Nick Clegg serving as Deputy Prime Minister.
Both the Conservatives and Liberal Democrats stood in all 30 wards, while Labour stood in 17 and the Apolitical Democrats and UK Independence Party stood in 2 wards each. [4] There were also 3 independent candidates to make a total of 142 candidates for the 52 seats on the council. [3]
The Labour Party is a centre-left political party in the United Kingdom that has been described as an alliance of social democrats, democratic socialists and trade unionists. The party's platform emphasises greater state intervention, social justice and strengthening workers' rights.
The UK Independence Party is a hard Eurosceptic, right-wing to far-right political party in the United Kingdom. It currently has one representative in the House of Lords and three Members of the European Parliament (MEPs). It has three Assembly Members (AMs) in the National Assembly for Wales and one member in the London Assembly. The party reached its greatest level of success in the mid-2010s, when it gained two Members of Parliament and was the largest UK party in the European Parliament.
The Conservatives made a net gain of 3 seats to increase their majority on the council, finishing with 39 councillors, compared to 13 for the Liberal Democrats. [5] The Conservatives picked up seats in Thatcham North and Thatcham South and Crookham from the Liberal Democrats to win the majority of the seats in Thatcham. [5] Meanwhile, Labour failed to win any seats but did increase their share of the vote to just under 10%. [5]
Crookham is a village in the English county of Berkshire, and part of the civil parish of Thatcham.
Party | Seats | Gains | Losses | Net gain/loss | Seats % | Votes % | Votes | +/− | |
---|---|---|---|---|---|---|---|---|---|
Conservative | 39 | 4 | 1 | +3 | 75.0 | 57.4 | 55,480 | -2.0% | |
Liberal Democrat | 13 | 1 | 4 | -3 | 25.0 | 31.7 | 30,644 | -3.6% | |
Labour | 0 | 0 | 0 | 0 | 0 | 9.5 | 9,168 | +7.3% | |
Apolitical Democrats | 0 | 0 | 0 | 0 | 0 | 0.6 | 586 | +0.6% | |
Independent | 0 | 0 | 0 | 0 | 0 | 0.5 | 458 | -1.0% | |
UKIP | 0 | 0 | 0 | 0 | 0 | 0.4 | 355 | +0.1% |
Party | Candidate | Votes | % | ± | |
---|---|---|---|---|---|
Conservative | Irene Neill | 884 | 79.6 | -0.1 | |
Liberal Democrat | Elizabeth Peplow | 227 | 20.4 | +0.1 | |
Majority | 657 | 59.1 | -0.3 | ||
Turnout | 1,111 | 51 | +4 | ||
Conservative hold | Swing |
Party | Candidate | Votes | % | ± | |
---|---|---|---|---|---|
Conservative | Alan Law | 1,065 | 76.8 | -6.4 | |
Liberal Democrat | Ceinwen Lally | 322 | 23.2 | +6.4 | |
Majority | 743 | 53.6 | -12.9 | ||
Turnout | 1,387 | 58 | +7 | ||
Conservative hold | Swing |
Party | Candidate | Votes | % | ± | |
---|---|---|---|---|---|
Conservative | Michael Mooney | 1,482 | |||
Conservative | Anthony Linden | 1,342 | |||
Conservative | Emma Webster | 1,321 | |||
Labour | Senan Hartney | 623 | |||
Labour | Clive Taylor | 594 | |||
Labour | James Hutchinson | 539 | |||
Liberal Democrat | Sylvia Fowler | 341 | |||
Liberal Democrat | Stephen Brown | 303 | |||
Liberal Democrat | David Wood | 279 | |||
Turnout | 6,824 | 43 | +8 | ||
Conservative hold | Swing | ||||
Conservative hold | Swing |
Party | Candidate | Votes | % | ± | |
---|---|---|---|---|---|
Conservative | Graham Pask | 1,865 | |||
Conservative | Quentin Webb | 1,648 | |||
Liberal Democrat | Benjamin Morgan | 611 | |||
Liberal Democrat | Philippa Harper | 462 | |||
Turnout | 4,586 | 55 | +6 | ||
Conservative hold | Swing | ||||
Conservative hold | Swing |
Party | Candidate | Votes | % | ± | |
---|---|---|---|---|---|
Liberal Democrat | Royce Longton | 1,210 | |||
Conservative | Carol Jackson-Doerge | 1,130 | |||
Conservative | Ian MacFarlane | 971 | |||
Liberal Democrat | Nicholas Morse | 929 | |||
Turnout | 4,240 | 52 | +7 | ||
Liberal Democrat hold | Swing | ||||
Conservative hold | Swing |
Party | Candidate | Votes | % | ± | |
---|---|---|---|---|---|
Conservative | Brian Bedwell | 1,575 | |||
Conservative | Peter Argyle | 1,462 | |||
Conservative | Manohar Gopal | 1,406 | |||
Labour | Gordon Lewis | 746 | |||
Labour | Charles Croal | 737 | |||
Labour | Bernadette McNally | 568 | |||
Liberal Democrat | Arthur Johnson | 200 | |||
Liberal Democrat | Gary Johnson | 182 | |||
Liberal Democrat | Pamela Taylor | 164 | |||
Turnout | 7,040 | 38 | +4 | ||
Conservative hold | Swing | ||||
Conservative hold | Swing |
Party | Candidate | Votes | % | ± | |
---|---|---|---|---|---|
Conservative | Hilary Cole | 697 | 71.0 | -11.2 | |
Independent | Andrew Fforde-Lutter | 189 | 19.3 | +19.3 | |
Liberal Democrat | Richard Johnson | 95 | 9.7 | -8.1 | |
Majority | 508 | 51.8 | -12.6 | ||
Turnout | 981 | 52 | +5 | ||
Conservative hold | Swing |
Party | Candidate | Votes | % | ± | |
---|---|---|---|---|---|
Conservative | Jeffrey Beck | 1,104 | |||
Conservative | Dave Goff | 928 | |||
Liberal Democrat | David Tysoe | 572 | |||
Liberal Democrat | Rruwan Uduwerage-Perera | 553 | |||
Labour | Johnathan Roberts | 292 | |||
Labour | Thomas Satterthwaite | 280 | |||
Turnout | 3,729 | 41 | +2 | ||
Conservative hold | Swing | ||||
Conservative hold | Swing |
Party | Candidate | Votes | % | ± | |
---|---|---|---|---|---|
Conservative | Garth Simpson | 890 | 73.3 | +4.3 | |
Liberal Democrat | Philip Brooks | 325 | 26.7 | -4.3 | |
Majority | 565 | 46.5 | +8.4 | ||
Turnout | 1,215 | ||||
Conservative hold | Swing |
Party | Candidate | Votes | % | ± | |
---|---|---|---|---|---|
Conservative | Virginia Celsing | 828 | 70.7 | +2.4 | |
Liberal Democrat | Silvia Boschetto | 343 | 29.3 | -2.4 | |
Majority | 485 | 41.4 | +4.9 | ||
Turnout | 1,171 | 52 | -1 | ||
Conservative hold | Swing |
Party | Candidate | Votes | % | ± | |
---|---|---|---|---|---|
Conservative | George Chandler | 900 | 69.9 | -0.9 | |
Liberal Democrat | Paul Allen | 247 | 19.2 | +5.5 | |
Labour | Paul Johnston | 141 | 10.9 | +4.3 | |
Majority | 653 | 50.7 | -6.4 | ||
Turnout | 1,288 | 56 | +4 | ||
Conservative hold | Swing |
Party | Candidate | Votes | % | ± | |
---|---|---|---|---|---|
Conservative | Adrian Edwards | 1,329 | |||
Conservative | Howard Bairstow | 1,307 | |||
Liberal Democrat | Bryan Harper | 884 | |||
Liberal Democrat | Sam Dibas | 758 | |||
Labour | Linda Cooper | 213 | |||
UKIP | David Black | 205 | |||
Labour | Leslie Cooper | 204 | |||
UKIP | David McMahon | 150 | |||
Independent | Brian Burgess | 132 | |||
Turnout | 5,182 | 57 | -1 | ||
Conservative hold | Swing | ||||
Conservative hold | Swing |
Party | Candidate | Votes | % | ± | |
---|---|---|---|---|---|
Liberal Democrat | William Drummond | 868 | |||
Liberal Democrat | Julian Swift-Hook | 857 | |||
Conservative | Allan Beal | 693 | |||
Conservative | Christopher Austin | 688 | |||
Labour | Hannah Cooper | 204 | |||
Labour | Gary Puffett | 202 | |||
Turnout | 3,512 | 44 | +2 | ||
Liberal Democrat hold | Swing | ||||
Liberal Democrat hold | Swing |
Party | Candidate | Votes | % | ± | |
---|---|---|---|---|---|
Conservative | Paul Hewer | 1,315 | |||
Conservative | David Holtby | 1,178 | |||
Liberal Democrat | Denise Gaines | 840 | |||
Liberal Democrat | Rhona Sherwood | 711 | |||
Turnout | 4,044 | 50 | +1 | ||
Conservative hold | Swing | ||||
Conservative hold | Swing |
Party | Candidate | Votes | % | ± | |
---|---|---|---|---|---|
Conservative | Anthony Stansfeld | 1,417 | |||
Conservative | Andrew Rowles | 1,393 | |||
Liberal Democrat | James Mole | 493 | |||
Liberal Democrat | Simon Hudson | 487 | |||
Turnout | 3,790 | 53 | +6 | ||
Conservative hold | Swing | ||||
Conservative hold | Swing |
Party | Candidate | Votes | % | ± | |
---|---|---|---|---|---|
Conservative | Arthur Jones | 1,489 | |||
Conservative | Arnos Lundie | 1,293 | |||
Liberal Democrat | Joyce Easteal | 426 | |||
Liberal Democrat | Peter Greenhalgh | 229 | |||
Labour | Grahame Murphy | 228 | |||
Turnout | 3,665 | 47 | +0 | ||
Conservative hold | Swing | ||||
Conservative hold | Swing |
Party | Candidate | Votes | % | ± | |
---|---|---|---|---|---|
Liberal Democrat | Mollie Lock | 1,337 | |||
Liberal Democrat | Geoffrey Mayes | 1,061 | |||
Conservative | Hugh Gunn | 996 | |||
Conservative | Sarah Jones | 942 | |||
Turnout | 4,336 | 55 | +1 | ||
Liberal Democrat hold | Swing | ||||
Liberal Democrat hold | Swing |
Party | Candidate | Votes | % | ± | |
---|---|---|---|---|---|
Liberal Democrat | Anthony Vickers | 844 | |||
Liberal Democrat | Gwendoline Mason | 758 | |||
Conservative | Mauline Akins | 701 | |||
Conservative | Leon Larkings | 669 | |||
Apolitical Democrats | Charlotte Farrow | 195 | |||
Apolitical Democrats | David Yates | 181 | |||
Labour | Gerald Orbell | 166 | |||
Turnout | 3,514 | 46 | +0 | ||
Liberal Democrat hold | Swing | ||||
Liberal Democrat hold | Swing |
Party | Candidate | Votes | % | ± | |
---|---|---|---|---|---|
Conservative | Pamela Bale | 876 | 75.8 | -7.0 | |
Labour | Ian Stevens | 157 | 13.6 | +8.2 | |
Liberal Democrat | Matthew Shakespeare | 122 | 10.6 | +5.0 | |
Majority | 719 | 62.3 | -14.3 | ||
Turnout | 1,155 | 52 | +11 | ||
Conservative hold | Swing |
Party | Candidate | Votes | % | ± | |
---|---|---|---|---|---|
Conservative | Timothy Metcalfe | 1,621 | |||
Conservative | David Betts | 1,536 | |||
Labour | Robert Tutton | 512 | |||
Labour | Riyad Abboushi | 318 | |||
Liberal Democrat | Ann Turner | 282 | |||
Liberal Democrat | Paul Walter | 226 | |||
Turnout | 4,495 | 48 | +10 | ||
Conservative hold | Swing | ||||
Conservative hold | Swing |
Party | Candidate | Votes | % | ± | |
---|---|---|---|---|---|
Conservative | Paul Bryant | 1,360 | |||
Conservative | Marcus Franks | 1,209 | |||
Liberal Democrat | Susan Farrant | 561 | |||
Liberal Democrat | Martha Vickers | 419 | |||
Labour | Richard Garvie | 325 | |||
Turnout | 3,874 | 53 | +9 | ||
Conservative hold | Swing | ||||
Conservative hold | Swing |
Party | Candidate | Votes | % | ± | |
---|---|---|---|---|---|
Conservative | Michael Johnston | 1,133 | |||
Conservative | Robert Tuck | 1,071 | |||
Liberal Democrat | Diane Smith | 947 | |||
Liberal Democrat | Alexander Payton | 938 | |||
Labour | Alan Burgess | 320 | |||
Turnout | 4,409 | 54 | +5 | ||
Conservative hold | Swing | ||||
Conservative hold | Swing |
Party | Candidate | Votes | % | ± | |
---|---|---|---|---|---|
Conservative | Keith Chopping | 698 | 68.2 | +1.2 | |
Liberal Democrat | Robert Bird | 326 | 31.8 | -1.2 | |
Majority | 372 | 36.3 | +2.2 | ||
Turnout | 1,024 | 47 | -4 | ||
Conservative hold | Swing |
Party | Candidate | Votes | % | ± | |
---|---|---|---|---|---|
Liberal Democrat | David Rendel | 1,075 | |||
Conservative | Richard Crumly | 873 | |||
Liberal Democrat | Antony Ferguson | 774 | |||
Conservative | David Dobson | 734 | |||
Labour | Matthew Beadle | 236 | |||
Turnout | 3,692 | 45 | +6 | ||
Liberal Democrat gain from Conservative | Swing | ||||
Conservative hold | Swing |
Party | Candidate | Votes | % | ± | |
---|---|---|---|---|---|
Conservative | John Horton | 961 | |||
Conservative | Sheila Ellison | 958 | |||
Liberal Democrat | Michael Cole | 726 | |||
Liberal Democrat | Emma Spriggs | 607 | |||
Labour | Judith Dear | 211 | |||
Labour | Juno Orbell | 177 | |||
Turnout | 3,640 | 46 | -4 | ||
Conservative gain from Liberal Democrat | Swing | ||||
Party | Candidate | Votes | % | ± | |
---|---|---|---|---|---|
Conservative | Dominic Boeck | 1,101 | |||
Conservative | Roger Croft | 1,082 | |||
Liberal Democrat | Owen Jeffery | 940 | |||
Liberal Democrat | Robert Morgan | 917 | |||
Labour | Theresa McDowell | 239 | |||
Labour | Stephen Schollar | 195 | |||
Turnout | 4,474 | 47 | +8 | ||
Conservative gain from Liberal Democrat | Swing | ||||
Party | Candidate | Votes | % | ± | |
---|---|---|---|---|---|
Liberal Democrat | Jeffrey Brooks | 932 | |||
Liberal Democrat | Keith Woodhams | 891 | |||
Conservative | Robert Denton-Powell | 771 | |||
Conservative | John Burgoyne-Probyn | 698 | |||
Labour | David Hamilton | 207 | |||
Independent | George Rattray | 137 | |||
Turnout | 3,636 | 40 | +3 | ||
Liberal Democrat hold | Swing | ||||
Liberal Democrat hold | Swing |
Party | Candidate | Votes | % | ± | |
---|---|---|---|---|---|
Liberal Democrat | Alan Macro | 575 | 55.6 | +4.7 | |
Conservative | Robert Holden | 326 | 31.5 | -2.8 | |
Labour | Thomas Adams | 134 | 12.9 | +1.2 | |
Majority | 249 | 24.1 | +7.5 | ||
Turnout | 1,035 | 48 | +6 | ||
Liberal Democrat hold | Swing |
Party | Candidate | Votes | % | ± | |
---|---|---|---|---|---|
Liberal Democrat | David Allen | 685 | |||
Liberal Democrat | Roger Hunneman | 639 | |||
Conservative | David Moffat | 499 | |||
Conservative | Pauline Bastien | 491 | |||
Labour | Sean Semple | 157 | |||
Apolitical Democrats | David Reid | 127 | |||
Apolitical Democrats | Iain Wallace | 83 | |||
Turnout | 2,681 | 42 | +7 | ||
Liberal Democrat hold | Swing | ||||
Liberal Democrat hold | Swing |
Party | Candidate | Votes | % | ± | |
---|---|---|---|---|---|
Conservative | Laszlo Zverko | 574 | 59.7 | -4.7 | |
Labour | Paul Anderson | 243 | 25.3 | +12.6 | |
Liberal Democrat | Richard Croker | 144 | 15.0 | -7.8 | |
Majority | 331 | 34.4 | -7.2 | ||
Turnout | 961 | 44 | +5 | ||
Conservative hold | Swing |
A by-election was held in Hungerford ward on 15 August 2013 after the death of Conservative councillor David Holtby. [8] The seat was held for the Conservatives by James Podger with a reduced majority of 59 votes over the Liberal Democrats. [8]
By-elections, also spelled bye-elections, are used to fill elected offices that have become vacant between general elections.
Hungerford is a historic market town and civil parish in Berkshire, England, 8 miles (13 km) west of Newbury, 9 miles (14 km) east of Marlborough, 27 miles (43 km) northeast of Salisbury and 60 miles west of London. The Kennet and Avon Canal passes through the town from the west alongside the River Dun, a major tributary of the River Kennet. The confluence with the Kennet is to the north of the centre whence canal and river both continue east. Amenities include schools, shops, cafés, restaurants, and facilities for the main national sports. The railway station is a minor stop on the London to Exeter Line.
Party | Candidate | Votes | % | ± | |
---|---|---|---|---|---|
Conservative | James Podger | 810 | 48.4 | -12.7 | |
Liberal Democrat | Denise Gaines | 751 | 44.8 | +5.9 | |
Labour | Gary Puffett | 86 | 5.1 | +5.1 | |
United People's Party | Andrew Stott | 28 | 1.7 | +1.7 | |
Majority | 59 | 3.5 | |||
Turnout | 1,675 | 38.2 | -12 | ||
Conservative hold | Swing |
A by-election was held in Purley on Thames ward on 28 January 2015 after the death of Conservative councillor David Betts. [9] The seat was held for the Conservatives with a majority of 764 votes over the Labour party. [10]
Purley on Thames is a village and civil parish in Berkshire, England. Purley is centred 3 miles (4.8 km) north-west of Reading, 1 mile (1.6 km) east of Pangbourne, and 22 miles (35 km) south-east of Oxford. Consequently, the Reading urban area is the principal social, economic and cultural centre for the people of Purley. Historically, Purley comprised three separate manors and associated settlements, these being Purley Magna to the east, Purley Parva to the north-west, and La Hyde, to the west. In the centre there is an historic area named variously Lething or Burley (Domesday) which accommodated traders and craftsmen alongside the main Reading to Oxford Road.
Party | Candidate | Votes | % | ± | |
---|---|---|---|---|---|
Conservative | Richard Jones | 936 | 68.1 | +1.0 | |
Labour | Ian Stevens | 172 | 12.5 | -8.7 | |
UKIP | Catherine Anderson | 163 | 11.9 | +11.9 | |
Liberal Democrat | Stephen Bown | 104 | 7.6 | -4.1 | |
Majority | 764 | 55.6 | |||
Turnout | 1,375 | 26.6 | -21 | ||
Conservative hold | Swing |
Newbury is a constituency represented in the House of Commons of the UK Parliament since 2005 by Richard Benyon, a Conservative. It was created by the Redistribution of Seats Act 1885 and has been in continual existence since then.
The 1999 Craven District Council election took place on 6 May 1999 to elect members of Craven District Council in North Yorkshire, England. One third of the council was up for election and the Conservative party gained overall control of the council from no overall control.
The 2003 Harlow District Council election took place on 1 May 2003 to elect members of Harlow District Council in Essex, England. One third of the council was up for election and the council stayed under no overall control.
The 2008 Fareham Council election took place on 1 May 2008 to elect members of Fareham Borough Council in Hampshire, England. Half of the council was up for election and the Conservative party stayed in overall control of the council.
The 2011 council elections in Guildford saw the Conservatives retain control over Guildford Borough Council with an increased majority of 20 seats. Full results for each ward can be found at Guildford Council election, full results, 2011.
The 2011 Carlisle City Council election took place on 5 May 2011 to elect members of Carlisle District Council in Cumbria, England. One third of the council was up for election and the council stayed under no overall control.
The 2011 Derbyshire Dales District Council election took place on 5 May 2011 to elect members of Derbyshire Dales District Council in Derbyshire, England. The whole council was up for election and the Conservative party stayed in overall control of the council.
The 2011 Wealden District Council election took place on 5 May 2011 to elect members of Wealden District Council in East Sussex, England. The whole council was up for election and the Conservative party stayed in overall control of the council.
The 2012 Huntingdonshire District Council election took place on 3 May 2012 to elect members of Huntingdonshire District Council in Cambridgeshire, England. One third of the council was up for election and the Conservative party stayed in overall control of the council.
The 2014 Huntingdonshire District Council election took place on 22 May 2014 to elect members of Huntingdonshire District Council in Cambridgeshire, England. One third of the council was up for election and the Conservative party stayed in overall control of the council.
The 2007 Rother District Council election took place on 3 May 2007 to elect members of Rother District Council in East Sussex, England. The whole council was up for election and the Conservative party stayed in overall control of the council.
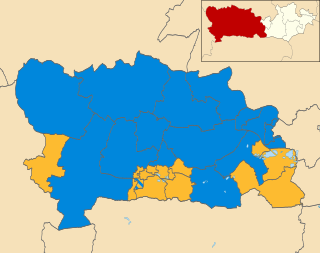
The 2003 West Berkshire Council election took place on 1 May 2003 to elect members of West Berkshire Council in Berkshire, England. The whole council was up for election with boundary changes since the last election in 2000 reducing the number of seats by 2. The Liberal Democrats lost overall control of the council to no overall control.
The 2007 West Berkshire Council election took place on 3 May 2007 to elect members of West Berkshire Council in Berkshire, England. The whole council was up for election and the Conservative party stayed in overall control of the council.
The 2014 St Helens Metropolitan Borough Council election took place on 22 May 2014 to elect members of St Helens Metropolitan Borough Council in Merseyside, England. One third of the council was up for election and the Labour party stayed in overall control of the council.
The 2014 Craven District Council election took place on 22 May 2014 to elect members of Craven District Council in North Yorkshire, England. One third of the council was up for election and the Conservative party stayed in overall control of the council.
The 2015 Wychavon District Council election took place on 7 May 2015 to elect members of Wychavon District Council in Worcestershire, England. The whole council was up for election and the Conservative party stayed in overall control of the council.
The 2012 West Oxfordshire District Council election took place on 3 May 2012 to elect members of West Oxfordshire District Council in Oxfordshire, England. One third of the council was up for election and the Conservative party stayed in overall control of the council.
The 2014 West Oxfordshire District Council election took place on 22 May 2014 to elect members of West Oxfordshire District Council in Oxfordshire, England. One third of the council was up for election and the Conservative party stayed in overall control of the council.
The 2015 West Oxfordshire District Council election took place on 22 May 2015 to elect members of West Oxfordshire District Council in Oxfordshire, England. One third of the council was up for election and the Conservative party stayed in overall control of the council.