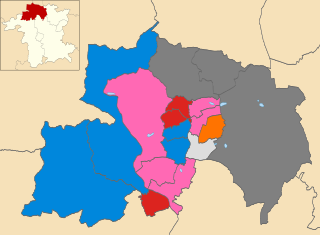
The 2011 Wyre Forest District Council election took place on 5 May 2011 to elect members of Wyre Forest District Council in Worcestershire, England. One third of the council was up for election and the Conservative party stayed in overall control of the council. [1]
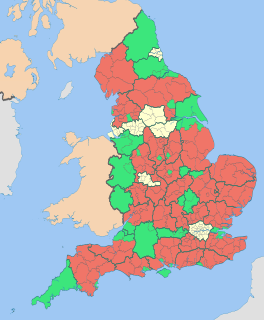
Non-metropolitan districts, or colloquially "shire districts", are a type of local government district in England. As created, they are sub-divisions of non-metropolitan counties in a two-tier arrangement.
Worcestershire is a county in the West Midlands of England. Between 1974 and 1998, it was merged with the neighbouring county of Herefordshire as Hereford and Worcester.
England is a country that is part of the United Kingdom. It shares land borders with Wales to the west and Scotland to the north-northwest. The Irish Sea lies west of England and the Celtic Sea lies to the southwest. England is separated from continental Europe by the North Sea to the east and the English Channel to the south. The country covers five-eighths of the island of Great Britain, which lies in the North Atlantic, and includes over 100 smaller islands, such as the Isles of Scilly and the Isle of Wight.
After the election, the composition of the council was
The Conservative Party, officially the Conservative and Unionist Party, is a centre-right political party in the United Kingdom. Presently led by Theresa May, it has been the governing party since 2010. It presently has 314 Members of Parliament in the House of Commons, 249 members of the House of Lords, and 18 members of the European Parliament. It also has 31 Members of the Scottish Parliament, 12 members of the Welsh Assembly, eight members of the London Assembly and 9,008 local councillors. One of the major parties of UK politics, it has formed the government on 45 occasions, more than any other party.
The Labour Party is a centre-left political party in the United Kingdom which has been described as an alliance of social democrats, democratic socialists and trade unionists. The party's platform emphasises greater state intervention, social justice and strengthening workers' rights. Labour is a full member of the Party of European Socialists and Progressive Alliance, and holds observer status in the Socialist International. As of 2017, the party was considered the "largest party in Western Europe" in terms of party membership, with more than half a million members.
The Liberal Party is a British political party that was founded in 1989 by members of the original Liberal Party opposed to its merger with the Social Democratic Party (SDP) to form the Liberal Democrats. The party holds seven local council seats.
After the last election in 2010 the Conservatives had a majority on the council with 23 seats, compared to 8 for Health Concern, 5 Liberals, 3 Labour, 2 Liberal Democrats and 1 independent. [3] However, in late May 2010 the leader of Health Concern on the council, Howard Martin, left the party to sit as an independent and went on to join Labour in September 2010. [4] Another change came in March 2011 when both of the Liberal Democrat councillors, husband and wife Peter and Helen Dyke, left the party to become independents due to disillusionment with the national Conservative-Liberal Democrat coalition. [5]
Independent Community and Health Concern, previously Independent Kidderminster Hospital and Health Concern is a political party based in Kidderminster, United Kingdom. It grew out of the campaign to restore the casualty unit at Kidderminster Hospital, and the National Health Service is still its primary focus, but the party has since diversified. Since 2015 it has also been known as the Wyre Forest Independent Party and has successfully contested local elections within the Wyre Forest local government area, which includes Kidderminster.
The Liberal Democrats are a liberal, centrist political party in the United Kingdom. They presently have 11 Members of Parliament in the House of Commons, 96 members of the House of Lords, and one member of the European Parliament. They also have five Members of the Scottish Parliament and a member each in the Welsh Assembly and London Assembly. The party reached the height of its influence in the early 2010s, forming a junior partner in a coalition government from 2010 to 2015. It is presently led by Vince Cable.
The Conservatives retained a majority on the council with 24 councillors and gained a seat from Health Concern in Mitton. [2] [6] [7] Labour were the other party to make gains, taking an extra 2 seats, including gaining Areley Kings from Health Concern by 39 votes. [2] [8] This made Labour the second largest party on the council with six seats, while Health Concern dropped three to have four seats. [9] Meanwhile, Peter Dyke held Aggborough and Spennells as an independent, after having left the Liberal Democrats earlier in the year. [10]
Areley Kings is a Worcestershire village on the River Severn 10 miles north of Worcester in the picturesque area of the Wyre Forest. The area is featured in the Domesday Book and many historical places of interest, like Areley Hall, are open to visitors. Nearby Stourport on Severn grew during the Victorian era and is still very popular with tourists and holiday makers all year round for canal and river cruising and for the many well signed walks through some of the finest Worcestershire countryside.
Spennells is a suburb of Kidderminster, Worcestershire about a mile south of the town centre. It is located just to the east of the A449 and the railway line between Worcester and Kidderminster. There is a park, a lake and Kidderminster Golf Club is just to the north. Many of the streets on the major housing estate are named after birds. The area has several shops including a supermarket, a pharmacy, a florist, a hairdresser, a hospice shop, and two takeaway restaurants. Spennells has a primary school, Heronswood Primary School.
Party | Seats | Gains | Losses | Net gain/loss | Seats % | Votes % | Votes | +/− | |
---|---|---|---|---|---|---|---|---|---|
Conservative | 7 | 1 | 0 | +1 | 50.0 | 38.6 | 10,669 | -0.5% | |
Labour | 4 | 2 | 0 | +2 | 28.6 | 23.9 | 6,617 | +5.3% | |
Health Concern | 1 | 0 | 3 | -3 | 7.1 | 21.1 | 5,825 | -3.7% | |
Liberal | 1 | 0 | 0 | 0 | 7.1 | 5.9 | 1,634 | -1.0% | |
Independent | 1 | 0 | 0 | 0 | 7.1 | 3.7 | 1,012 | +3.7% | |
Liberal Democrat | 0 | 0 | 0 | 0 | 0 | 3.3 | 909 | -6.7% | |
UKIP | 0 | 0 | 0 | 0 | 0 | 1.9 | 512 | +1.9% | |
Green | 0 | 0 | 0 | 0 | 0 | 1.7 | 462 | +0.1% | |
Party | Candidate | Votes | % | ± | |
---|---|---|---|---|---|
Independent | Peter Dyke | 831 | 37.6 | +37.6 | |
Conservative | Gill Onslow | 570 | 25.8 | -12.3 | |
Labour | Dan Watson | 239 | 10.8 | -0.1 | |
Health Concern | Liz Davies | 220 | 9.9 | -6.8 | |
Liberal Democrat | Michael Troth | 203 | 9.2 | -25.1 | |
UKIP | Tony Baker | 149 | 6.7 | +6.7 | |
Majority | 261 | 11.8 | |||
Turnout | 2,212 | 42.7 | -25.3 | ||
Independent hold | Swing | ||||
Party | Candidate | Votes | % | ± | |
---|---|---|---|---|---|
Labour | Vi Higgs | 691 | 34.8 | +9.8 | |
Conservative | Ken Henderson | 652 | 32.9 | -3.3 | |
Health Concern | John Thomas | 588 | 29.6 | -9.2 | |
Liberal Democrat | John Stephen | 53 | 2.7 | +2.7 | |
Majority | 39 | 2.0 | |||
Turnout | 1,984 | 42.8 | -23.3 | ||
Labour gain from Health Concern | Swing | ||||
Party | Candidate | Votes | % | ± | |
---|---|---|---|---|---|
Conservative | Jenny Greener | 1,047 | 42.0 | +2.1 | |
Labour | Paul Gittins | 681 | 27.3 | +13.2 | |
Health Concern | Derek Killingworth | 626 | 25.1 | -2.4 | |
Liberal Democrat | Jayne Smith | 141 | 5.7 | -12.7 | |
Majority | 366 | 14.7 | +2.3 | ||
Turnout | 2,495 | 46.6 | -26.3 | ||
Conservative hold | Swing | ||||
Party | Candidate | Votes | % | ± | |
---|---|---|---|---|---|
Conservative | Stephen Williams | 1,247 | 78.6 | +11.2 | |
Labour | Matthew Nicholls | 198 | 12.5 | +2.8 | |
Liberal Democrat | Jean Prosser | 142 | 8.9 | +8.9 | |
Majority | 1,049 | 66.1 | +21.6 | ||
Turnout | 1,587 | 48.9 | -27.6 | ||
Conservative hold | Swing | ||||
Party | Candidate | Votes | % | ± | |
---|---|---|---|---|---|
Labour | Adrian Sewell | 602 | 28.7 | +6.4 | |
Health Concern | Mary Rayner | 558 | 26.6 | -11.8 | |
Conservative | Juliet Smith | 521 | 24.9 | -7.8 | |
Independent | Steven Walker | 181 | 8.6 | +8.6 | |
Liberal | Mark Haynes | 144 | 6.9 | +6.9 | |
Green | Phil Oliver | 89 | 4.2 | -2.4 | |
Majority | 44 | 2.1 | |||
Turnout | 2,095 | 35.3 | -23.7 | ||
Labour gain from Health Concern | Swing | ||||
Party | Candidate | Votes | % | ± | |
---|---|---|---|---|---|
Labour | Christopher Nicholls | 538 | 55.5 | +8.6 | |
Conservative | Greta Smith | 235 | 24.2 | +0.8 | |
Health Concern | Les Rising | 197 | 20.3 | +6.9 | |
Majority | 303 | 31.2 | +7.7 | ||
Turnout | 970 | 47.4 | -1.0 | ||
Labour hold | Swing | ||||
Party | Candidate | Votes | % | ± | |
---|---|---|---|---|---|
Conservative | Anne Hingley | 1,098 | 47.0 | +10.3 | |
Labour | Nigel Knowles | 714 | 30.5 | +5.3 | |
Health Concern | Michael Shellie | 460 | 19.7 | -3.9 | |
Liberal Democrat | Steven Burns | 66 | 2.8 | -9.1 | |
Majority | 384 | 16.4 | +4.9 | ||
Turnout | 2,338 | 42.7 | -26.1 | ||
Conservative hold | Swing | ||||
Party | Candidate | Votes | % | ± | |
---|---|---|---|---|---|
Conservative | Paul Harrison | 701 | 32.8 | +1.4 | |
Liberal | John Stevenson | 513 | 24.0 | -17.7 | |
Labour | Vicky Smith | 484 | 22.7 | +2.4 | |
Health Concern | Chris Thomas | 333 | 15.6 | +15.6 | |
Green | Alexandra Heelis | 103 | 4.8 | -1.8 | |
Majority | 188 | 8.8 | |||
Turnout | 2,134 | 35.0 | -26.8 | ||
Conservative hold | Swing | ||||
Party | Candidate | Votes | % | ± | |
---|---|---|---|---|---|
Labour | Michael Kelly | 895 | 37.9 | +13.6 | |
Conservative | Susan Meekings | 845 | 35.8 | -1.0 | |
Health Concern | Jim Lawson | 485 | 20.5 | -3.0 | |
Liberal Democrat | Clare Cassidy | 87 | 3.7 | -9.5 | |
Green | Dave Finch | 50 | 2.1 | -0.1 | |
Majority | 50 | 2.1 | |||
Turnout | 2,362 | 45.3 | -21.5 | ||
Labour hold | Swing | ||||
Party | Candidate | Votes | % | ± | |
---|---|---|---|---|---|
Health Concern | Jim Parish | 925 | 44.0 | +2.0 | |
Conservative | David Little | 813 | 38.7 | -0.6 | |
Labour | Jennifer Knowles | 363 | 17.3 | -1.4 | |
Majority | 112 | 5.3 | +2.6 | ||
Turnout | 2,101 | 39.0 | -27.2 | ||
Health Concern hold | Swing | ||||
Party | Candidate | Votes | % | ± | |
---|---|---|---|---|---|
Conservative | Chris Rogers | 805 | 36.1 | -9.9 | |
Health Concern | Cliff Brewer | 778 | 34.9 | -0.9 | |
Labour | Gary Watson | 399 | 17.9 | -0.4 | |
UKIP | Bill Jones | 156 | 7.0 | +7.0 | |
Green | Steve Brown | 89 | 4.0 | +4.0 | |
Majority | 27 | 1.2 | -9.0 | ||
Turnout | 2,227 | 38.4 | -29.0 | ||
Conservative gain from Health Concern | Swing | ||||
Party | Candidate | Votes | % | ± | |
---|---|---|---|---|---|
Liberal | Michael Price | 977 | 43.8 | -1.4 | |
Conservative | Averil Chinn | 794 | 35.6 | +6.9 | |
Labour | Lee Wright | 461 | 20.7 | +7.3 | |
Majority | 183 | 8.2 | -8.3 | ||
Turnout | 2,232 | 41.6 | -26.7 | ||
Liberal hold | Swing | ||||
Party | Candidate | Votes | % | ± | |
---|---|---|---|---|---|
Conservative | Tracey Onslow | 822 | 40.2 | -2.0 | |
Health Concern | Linda Candlin | 388 | 19.0 | +1.0 | |
Labour | Bill Bradley | 352 | 17.2 | -0.9 | |
Liberal Democrat | Adrian Beavis | 217 | 10.6 | -7.7 | |
UKIP | Michael Wrench | 207 | 10.1 | +10.1 | |
Green | Mike Whitbread | 61 | 3.0 | -0.4 | |
Majority | 434 | 21.2 | -2.7 | ||
Turnout | 2,047 | 36.2 | -23.3 | ||
Conservative hold | Swing | ||||
Party | Candidate | Votes | % | ± | |
---|---|---|---|---|---|
Conservative | John Hart | 519 | 60.6 | +5.0 | |
Health Concern | Caroline Shellie | 267 | 31.2 | -2.9 | |
Green | Kate Spohrer | 70 | 8.2 | +2.2 | |
Majority | 252 | 29.4 | +7.9 | ||
Turnout | 856 | 50.4 | -1.9 | ||
Conservative hold | Swing | ||||
The 1998 Wyre Forest District Council election took place on 7 May 1998 to elect members of Wyre Forest District Council in Worcestershire, England. One third of the council was up for election and the Labour party stayed in overall control of the council.
The 1999 Wyre Forest District Council election took place on 6 May 1999 to elect members of Wyre Forest District Council in Worcestershire, England. One third of the council was up for election and the Labour party lost overall control of the council to no overall control.
The 2000 Wyre Forest District Council election took place on 4 May 2000 to elect members of Wyre Forest District Council in Worcestershire, England. One third of the council was up for election and the council stayed under no overall control.
The 2002 Wyre Forest District Council election took place on 2 May 2002 to elect members of Wyre Forest District Council in Worcestershire, England. One third of the council was up for election and the Independent Kidderminster Hospital and Health Concern party gained overall control of the council from no overall control.
The 2003 Wyre Forest District Council election took place on 1 May 2003 to elect members of Wyre Forest District Council in Worcestershire, England. One third of the council was up for election and the council stayed under no overall control.
The 2004 Wyre Forest District Council election took place on 10 June 2004 to elect members of Wyre Forest District Council in Worcestershire, England. The whole council was up for election with boundary changes since the last election in 2003. The council stayed under no overall control, but with the Conservatives taking over as the largest party on the council from the Health Concern party.
The 2006 Wyre Forest District Council election took place on 4 May 2006 to elect members of Wyre Forest District Council in Worcestershire, England. One third of the council was up for election and the council stayed under no overall control.
The 2007 Wyre Forest District Council election took place on 3 May 2007 to elect members of Wyre Forest District Council in Worcestershire, England. One third of the council was up for election and the council stayed under no overall control.
The 2008 Wyre Forest District Council election took place on 1 May 2008 to elect members of Wyre Forest District Council in Worcestershire, England. One third of the council was up for election and the Conservative party gained overall control of the council from no overall control.
The 2012 St Albans City and District Council election took place on 3 May 2012 to elect members of St Albans District Council in Hertfordshire, England. One third of the council was up for election and the council stayed under no overall control.
The 2010 Wyre Forest District Council election took place on 6 May 2010 to elect members of Wyre Forest District Council in Worcestershire, England. One third of the council was up for election and the Conservative party gained overall control of the council from no overall control.
The 2012 Wyre Forest District Council election took place on 3 May 2012 to elect members of Wyre Forest District Council in Worcestershire, England. One third of the council was up for election and the Conservative party lost overall control of the council to no overall control.
The 2014 Wyre Forest District Council election took place on 22 May 2014 to elect members of Wyre Forest District Council in Worcestershire, England. One third of the council was up for election and the council stayed under no overall control.
The 1999 Wychavon District Council election took place on 6 May 1999 to elect members of Wychavon District Council in Worcestershire, England. The whole council was up for election and the Conservative party gained overall control of the council from no overall control.
The 2015 Wyre Forest District Council election took place on 7 May 2015 to elect members of Wyre Forest District Council in Worcestershire, England. The whole council was up for election after boundary changes reduced the number of seats by nine. The Conservative party gained overall control of the council from no overall control.
The 2015 Wychavon District Council election took place on 7 May 2015 to elect members of Wychavon District Council in Worcestershire, England. The whole council was up for election and the Conservative party stayed in overall control of the council.
The 2006 West Oxfordshire District Council election took place on 4 May 2006 to elect members of West Oxfordshire District Council in Oxfordshire, England. One third of the council was up for election and the Conservative party stayed in overall control of the council.
The 2014 West Oxfordshire District Council election took place on 22 May 2014 to elect members of West Oxfordshire District Council in Oxfordshire, England. One third of the council was up for election and the Conservative party stayed in overall control of the council.