Brighton and Hove City Council election, 2011

Last updated

Brighton and Hove City Council election, 2011
  2007 5 May 2011 2015  

All 54 council seats
28 seats needed for a majority

  First party Second party Third party
  No image wide.svg No image wide.svg No image wide.svg
Party Green Conservative Labour
Last election 13 seats, 20.7% 26 seats, 34.6% 13 seats, 24.7%
Seats won23 18 13
Seat changeIncrease2.svg10Decrease2.svg8Steady2.svg
Popular vote73,832 64,837 71,738
Percentage32.8% 28.8% 31.7%
SwingIncrease2.svg12.1%Decrease2.svg6.1%Increase2.svg7.0%

Brighton and Hove City Council election 2011 map.svg

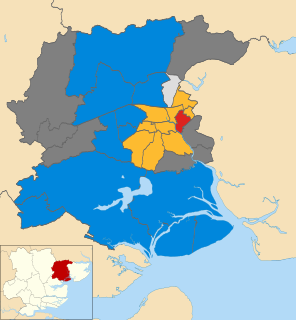
Map of results of 2011 election

Previous Largest Party before election


Conservative

Subsequent Largest Party


Green

Elections to Brighton and Hove City Council were held on 5 May 2011, in line with other local elections in the United Kingdom. The whole council, a unitary authority, was up for election with 54 councillors elected from 21 wards.

Brighton and Hove City and unitary authority in England

Brighton and Hove is a seaside city in East Sussex, in South East England. The towns of Brighton and Hove formed a unitary authority in 1997 and in 2001 were granted city status by Queen Elizabeth II. "Brighton" is often referred to synonymously with the official "Brighton and Hove" although many locals still consider the two to be separate towns. At the 2011 census, the city was England's most populous seaside resort, with a population of 273,400.

A unitary authority is a type of local authority that has a single tier and is responsible for all local government functions within its area or performs additional functions which elsewhere in the relevant country are usually performed by national government or a higher level of sub-national government.

Contents

The Green Party made significant gains, overtaking the Conservatives to become the largest party with 23 seats, the largest Green group on any council. The Greens gained seats at the expense of all three other parties, taking the only ward previously in Liberal Democrat hands. The Conservatives lost not only to the Greens but to Labour Co-op candidates in different parts of the city. [1]

Green Party of England and Wales Political party in England and Wales

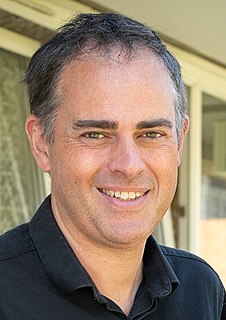
The Green Party of England and Wales is a green, left-wing political party in England and Wales. Headquartered in London, since September 2018, its co-leaders are Siân Berry and Jonathan Bartley. The Green Party has one representative in the House of Commons, one in the House of Lords, and three in the European Parliament. In addition, it has various councillors in UK local government and two members of the London Assembly.

Conservative Party (UK) Political party in the United Kingdom

The Conservative Party, officially the Conservative and Unionist Party, is a centre-right political party in the United Kingdom. Presently led by Theresa May, it has been the governing party since 2010. It presently has 314 Members of Parliament in the House of Commons, 249 members of the House of Lords, and 18 members of the European Parliament. It also has 31 Members of the Scottish Parliament, 12 members of the Welsh Assembly, eight members of the London Assembly and 9,008 local councillors. One of the major parties of UK politics, it has formed the government on 45 occasions, more than any other party.

Liberal Democrats (UK) Political party in the United Kingdom

The Liberal Democrats are a liberal political party in the United Kingdom. They presently have 11 Members of Parliament in the House of Commons, 96 members of the House of Lords, and one member of the European Parliament. They also have five Members of the Scottish Parliament and a member each in the Welsh Assembly and London Assembly. The party reached the height of its influence in the early 2010s, forming a junior partner in a coalition government from 2010 to 2015. It is presently led by Vince Cable.

The Greens, Conservatives and Labour Co-op fielded candidates for every seat on the council. The Liberal Democrats contested all but one ward. The UK Independence Party, European Citizens Party and Trade Unionists and Socialists Against Cuts also fielded candidates. In addition, there were eight independents standing, including re-standing councillor and former Liberal Democrat David Watkins. [2]

UK Independence Party British political party

The UK Independence Party is a hard Eurosceptic, right-wing political party in the United Kingdom. It currently has one representative in the House of Lords and seven Members of the European Parliament (MEPs). It has four Assembly Members (AMs) in the National Assembly for Wales and one member in the London Assembly. The party reached its greatest level of success in the mid-2010s, when it gained two Members of Parliament and was the largest UK party in the European Parliament.

Trade Unionist and Socialist Coalition political party

Trade Unionist and Socialist Coalition (TUSC) is a socialist electoral alliance launched in Britain for the 2010 general election.

Following the election the Labour Co-operative group rejected the possibility of forming a coalition with the Green Party, who then went on to form the first ever Green council administration in the UK, as a minority administration. [3] [4] As of 2018, it is the most recent local authority election in which the Green Party of England and Wales won the most votes and seats.

Following the election, the composition of the council was as follows:

Green: 23 Conservative: 18 Labour: 13

Changes between 2007 and 2011 elections

Since the 2007 Council Election there were a number of changes to the make up of the council:

In the Regency, Goldsmid and St. Peter's & North Laine wards there were by-elections, all of which were won or held by the Green Party. In Brunswick and Adelaide one councillor, David Watkins resigned from the Liberal Democrats and stood as an independent in this election. Jayne Bennett, who was elected as an Independent in the 2007 election in the Stanford/Hove Park ward, rejoined the Conservative Party (which she had left in 2002 [5] ), and stood as such in 2011.

Two ward names were changed during the four-year period: Hollingbury and Stanmer became Hollingdean and Stanmer, and Stanford ward was renamed Hove Park, using the council's powers under the Local Government and Public Involvement in Health Act 2007.

Results of election

Brighton & Hove Election Result 2011
PartySeatsGainsLossesNet gain/lossSeats %Votes %Votes+/−
  Green 23 10 0 +10 42.59 32.75 73,832 +12.06
  Conservative 18 0 8 -8 33.33 28.76 64,837 -6.08
  Labour Co-op 13 5 5 0 24.07 31.82 71,738 +7.00
  Liberal Democrat 0 0 1 -1 0 4.64 10,450 -5.09
  Independent 0 0 1 -1 0 0.83 1,878 -4.54
  UKIP 0 0 0 0 0 0.77 1,734 +0.06
  TUSC 0 0 0 0 0 0.40 900 N/A
  European Citizens Party 0 0 0 0 0 0.03 76 N/A

Ward breakdown

Brunswick and Adelaide

Brunswick and Adelaide highlighted BHward13-Brunswick and Adelaide.jpg
Brunswick and Adelaide highlighted
Brunswick and Adelaide (2)
PartyCandidateVotes%±
Green Phelim MacCafferty 1,140 20.07 +8.21
Green Ollie Sykes 1,135 19.30 +8.69
Liberal Democrat Paul Elgood 919 15.63 -7.55
Labour Co-op Ray Barnes 622 10.58 +3.59
Labour Co-op Rob Macey 611 10.34 +3.87
Liberal Democrat Brian Stone 502 8.54 -9.40
Conservative Richard Latham 395 6.72 -2.34
Conservative Adam Campbell 394 6.70 -2.08
Independent David Watkins 163 2.77 -15.17
UKIP Mark Cribb 69 1.17 N/A
Turnout 3,138 41.8 +13.1
Green gain from Liberal Democrat Swing +15.76
Green gain from Independent Swing +23.86

Central Hove

Central Hove highlighted BHward21-Central Hove.jpg
Central Hove highlighted
Central Hove (2)
PartyCandidateVotes%±
Green Chris Hawtree 1,006 17.73 +8.81
Conservative Andrew Wealls 972 17.13 -3.35
Conservative Jan Young 932 16.43 -2.71
Green Anthea Ballam 819 14.44 +7.37
Labour Co-op Celia Barlow 704 12.41 +5.68
Labour Co-op Caroline Penn 594 10.47 +4.01
Liberal Democrat Mark Collins 347 6.12 -8.58
Liberal Democrat Rebecca Taylor 299 5.27 -8.90
Turnout 2988 42.7 +8.7
Green gain from Conservative Swing +13.51
Conservative hold Swing -3.09

East Brighton

East Brighton highlighted BHward4-East Brighton.jpg
East Brighton highlighted
East Brighton (3)
PartyCandidateVotes%±
Labour Co-op Gill Mitchell 2,059 18.41 +2.63
Labour Co-op Warren Morgan 1,862 16.65 +2.92
Labour Co-op Craig Turton 1,616 14.45 +2.09
Green Alison Ghanimi 955 8.54 +2.46
Conservative Peter Booth 940 8.40 -1.40
Conservative Chris Sandland 826 7.38 -2.39
Green Lianna Etkind 815 7.29 +2.71
Conservative Kelvin Poplett 803 7.18 -1.94
Green Pip Tindall 627 5.61 +1.25
Liberal Democrat Paul Chandler 323 2.89 -1.04
Liberal Democrat Bruce Neave 218 1.95 -1.97
TUSC Bill North 142 1.27 -2.42
Turnout 4,045 39.5 +4.1
Labour Co-op hold Swing +0.07
Labour Co-op hold Swing +4.29
Labour Co-op hold Swing +3.82

Goldsmid

Goldsmid highlighted BHward14-Goldsmid.jpg
Goldsmid highlighted
Goldsmid (3)
PartyCandidateVotes%±
Green Ruth Buckley 2,264 14.19 +7.51
Green Alexandra Phillips 2,204 13.82 +7.72
Green Rob Jarrett 1,898 11.90 +3.80
Labour Co-op Melanie Davis 1,755 11.00 +1.13
Labour Co-op Nigel Jenner 1,516 9.50 -0.13
Conservative Adam Love 1,428 8.96 -1.71
Conservative Rob Buckwell 1,420 8.90 -1.03
Conservative Debra Livingstone-Wade 1,333 8.25 -1.29
Labour Co-op Lis Telcs 1,271 7.97 -0.84
Liberal Democrat Andrew Malling 312 1.96 -2.92
Liberal Democrat Gloria Parks 281 1.76 -4.01
Liberal Democrat John Aloy 269 1.69 -2.37
Turnout 5,566 56.6 +19.1
Green gain from Conservative Swing +9.80
Green hold Swing +8.75
Green gain from Labour Co-op Swing +2.67

Hangleton and Knoll

Hangleton and Knoll highlighted BHward16-Hangleton and Knoll.jpg
Hangleton and Knoll highlighted
Hangleton and Knoll (3)
PartyCandidateVotes%±
Conservative Dawn Barnett 2,412 16.73 -2.00
Labour Co-op Brian Fitch 2,139 14.84 +1.98
Conservative Tony Janio 2,056 14.26 -1.54
Conservative Michael Ireland 1,884 13.07 -2.58
Labour Co-op Dominic Ford 1,855 12.87 +2.17
Labour Co-op Alun Jones 1,778 12.33 +1.67
Independent Jo Heard 688 4.77 +2.10
Green Martin Ashby 492 3.41 +1.14
Green Adele Bates 379 2.63 +0.83
Liberal Democrat Lawrence Collins 326 2.26 +0.42
Green Nic Compton 265 1.84 +0.07
Liberal Democrat Dinah Staples 143 0.99 -0.41
Turnout 5,121 46.9 +1.3
Conservative hold Swing -4.17
Labour Co-op gain from Conservative Swing +4.56
Conservative hold Swing -3.06

Hanover and Elm Grove

Hanover and Elm Grove highlighted BHward6-Hanover and Elm Grove.jpg
Hanover and Elm Grove highlighted
Hanover and Elm Grove (3)
PartyCandidateVotes%±
Green Bill Randall 2,861 18.84 +0.23
Green Matt Follett 2,800 18.44 +0.51
Green Liz Wakefield 2,576 16.97 +0.38
Labour Co-op Leo Barraclough 1,662 10.95 +2.17
Labour Co-op Tracey Hill 1,661 10.94 -0.33
Labour Co-op David Speirs 1,606 10.58 +2.52
Conservative Rosemary Faulkner 499 3.29 -0.82
Conservative Roger McCabe 441 2.90 -1.01
Conservative Karen Miles 434 2.86 -0.65
Liberal Democrat Elliot Eke 189 1.24 -1.60
Liberal Democrat Raymond Parker 159 1.05 -1.17
TUSC John Redford 156 1.03 N/A
Liberal Democrat Belkasim Gahran 140 0.92 -1.26
Turnout 5,411 46.7 +10.1
Green hold Swing +0.55
Green hold Swing -1.65
Green hold Swing -2.14

Hollingdean and Stanmer

Hollingdean and Stanmer highlighted BHward7-Hollingdean and Stanmer.jpg
Hollingdean and Stanmer highlighted
Hollingdean and Stanmer (3)
PartyCandidateVotes%±
Green Sven Rufus 1,753 13.58 +5.78
Green Christina Summers 1,748 13.55 +7.16
Labour Co-op Jeane Lepper 1,681 13.03 -2.07
Labour Co-op Pat Hawkes 1,557 12.07 +0.13
Green Luke Walter 1,523 11.80 +6.95
Labour Co-op Christine Simpson 1,511 11.71 -0.23
Conservative Rachael Bates 767 5.94 -3.60
Conservative Patrick Lowe 761 5.90 -3.57
Conservative Rob Labs 732 5.67 -3.72
UKIP Nigel Carter 166 1.29 N/A
Liberal Democrat Oliver Eke 138 1.07 -3.27
Liberal Democrat Emma Harrop 127 0.98 -2.27
TUSC Tony Greenstein 126 0.98 -1.66
TUSC Phil Clarke 120 0.93 N/A
Liberal Democrat Lillian Harrop 105 0.81 -2.24
TUSC Dave Hill 89 0.67 N/A
Turnout 4,662 39.7 +9.07
Green gain from Labour Co-op Swing +4.06
Green gain from Labour Co-op Swing +4.39
Labour Co-op hold Swing -4.33

Hove Park

Hove Park highlighted BHward15-Hove Park.jpg
Hove Park highlighted
Hove Park (2)
PartyCandidateVotes%±
Conservative Jayne Bennett 2,557 35.01 +4.66
Conservative Vanessa Brown 2,368 32.43 +0.63
Labour Co-op John Cooper 661 9.05 +5.31
Labour Co-op Bernie Katz 505 6.91 +3.75
Green Gavin Graham 458 6.27 +2.20
Green Jane Prisley 292 4.00 +2.15
Liberal Democrat Anna Gerrard 198 2.71 -0.11
Liberal Democrat Manrico Oliveri 158 2.16 +0.37
UKIP Sasha Stephens 106 1.45 N/A
Turnout 3,771 46.9 -3.53
Conservative hold Swing +16.03
Conservative hold Swing -2.21

Moulsecoomb and Bevendean

Moulsecoomb and Bevendean highlighted BHward3-Moulsecoomb and Bevendean.jpg
Moulsecoomb and Bevendean highlighted
Moulsecoomb and Bevendean (3)
PartyCandidateVotes%±
Labour Co-op Mo Marsh 1,721 15.98 +3.45
Labour Co-op Leigh Farrow 1,666 15.47 +5.04
Labour Co-op Anne Meadows 1,663 15.44 +2.92
Green Allie Cannell 1,080 10.03 +1.27
Conservative Maria Caulfield 1,048 9.73 -2.37
Conservative Cath Slater 863 8.01 -4.08
Green Kelly Dibbert 852 7.91 +3.52
Conservative Ayas Fallon-Khan 838 7.78 -4.07
Green Amelia Mills 772 7.17 +3.08
TUSC Dave Bangs 267 2.48 -1.77
Turnout 3,868 31.8 +4.62
Labour Co-op hold Swing +5.52
Labour Co-op gain from Conservative Swing +7.41
Labour Co-op hold Swing +6.76

North Portslade

North Portslade highlighted BHward17-North Portslade.jpg
North Portslade highlighted
North Portslade (2)
PartyCandidateVotes%±
Labour Co-op Bob Carden 1,596 29.82 +7.07
Labour Co-op Penny Gilbey 1,240 23.16 +3.62
Conservative Trevor Alford 1,010 18.87 -2.70
Conservative Kerry Underhill 639 11.94 -8.77
Green Jacob Chapman 245 4.58 +1.01
UKIP Maria McCallum 155 2.90 N/A
Green Dave Walsh 130 2.43 -1.06
Liberal Democrat Ali Haydor 126 2.35 -2.51
Liberal Democrat Billie Lewis 106 1.98 -1.51
Independent Theo Child 106 1.98 N/A
Turnout 3,030 39.6
Labour Co-op hold Swing +15.84
Labour Co-op gain from Conservative Swing +6.32

Patcham

Patcham highlighted BHward8-Patcham.jpg
Patcham highlighted
Patcham (3)
PartyCandidateVotes%±
Conservative Brian Pidgeon 2,187 15.81 -4.96
Conservative Carol Theobald 2,059 14.88 -5.53
Conservative Geoffrey Theobald 2,042 14.76 -5.34
Green Hugh Woodhouse 1,433 10.36 +7.00
Green Geraldine Keenan 1,338 9.67 +4.79
Green Linda McRae 1,274 9.21 +6.73
Labour Co-op Christine Moody 1,151 8.32 +2.21
Labour Co-op Jatin Patel 960 6.94 -0.07
Labour Co-op Rosemary Collins 735 5.31 -0.67
UKIP Philip Wray 252 1.82 -1.39
Liberal Democrat Christopher Hurley 219 1.58 -1.13
Liberal Democrat Lawrence Eke 186 0.95 -1.37
Turnout 5,092 46.74 +2.80
Conservative hold Swing -8.31
Conservative hold Swing -9.09
Conservative hold Swing -9.27

Preston Park

Preston Park highlighted BHward10-Preston Park.jpg
Preston Park highlighted
Preston Park (3)
PartyCandidateVotes%±
Green Amy Kennedy 2,616 16.12 +3.75
Green Mike Jones 2,564 15.80 +6.82
Green Leo Littman 2,291 14.12 +6.34
Labour Co-op Kevin Allen 2,104 12.97 +1.81
Labour Co-op Juliet McCaffery 2,063 12.71 +0.36
Labour Co-op Tim Lunnon 1,848 11.39 +1.36
Conservative Clive Brimmell 743 4.58 -1.14
Conservative Georgina Dore 726 4.47 -1.18
Conservative William Mills 667 4.11 -1.37
Liberal Democrat Tallulah Frankland 218 1.34 -1.98
Liberal Democrat Keith Tipping 179 1.10 -1.16
Liberal Democrat Lee Shingles 169 1.04 -0.98
The European Citizens Party Yuri Borgmann-Prebil 37 0.23 N/A
Turnout 5,708 52.76 +7.85
Green hold Swing +0.81
Green gain from Labour Co-op Swing +5.46
Green gain from Labour Co-op Swing +6.11

Queen's Park

Queen's Park highlighted BHward5-Queen's Park.jpg
Queen's Park highlighted
Queen's Park (3)
PartyCandidateVotes%±
Green Geoffrey Bowden 2,227 14.72 +0.46
Green Stephanie Powell 2,221 14.68 +2.58
Green Ben Duncan 2,147 14.19 +2.69
Labour Co-op Daniel Chapman 1,970 13.02 +1.63
Labour Co-op Christopher Cooke 1,867 12.34 +0.98
Labour Co-op Tom French 1,822 12.04 +0.97
Conservative Philip Brownlie 766 5.06 -2.17
Conservative Anne Glow 738 4.88 -1.52
Conservative Gail Woodcock 653 4.32 -1.55
Liberal Democrat Elizabeth Robinson 237 1.57 -1.31
Liberal Democrat Jacob Frohawk-Mclucas 189 1.25 -1.59
Independent Brian Ralfe 155 1.02 -1.35
Independent Mohammed Asaduzzaman 140 0.93 N/A
Turnout 5,335 45.49 +5.50
Green hold Swing -1.17
Green hold Swing +1.60
Green hold Swing +1.72

Regency

Regency highlighted BHward12-Regency.jpg
Regency highlighted
Regency (2)
PartyCandidateVotes%±
Green Ania Kitcat 1,696 28.53 +11.34
Green Jason Kitcat 1,629 27.40 +11.30
Labour Co-op James Asser 691 11.62 -0.03
Labour Co-op Dan Wilson 665 11.19 +1.98
Conservative Andrew Hancox 494 8.31 -2.33
Conservative Michael MacFarlane 449 7.55 -3.27
Liberal Democrat Gareth Jones 166 2.79 -6.57
Liberal Democrat Larissa Rowe 155 2.61 -6.15
Turnout 3,092 38.91
Green hold Swing +11.37
Green hold Swing +10.93

Rottingdean Coastal

Rottingdean Coastal highlighted BHward1-Rottingdean Coastal.jpg
Rottingdean Coastal highlighted
Rottingdean Coastal (3)
PartyCandidateVotes%±
Conservative Lynda Hyde 2,642 19.19 -1.49
Conservative Mary Mears 2,433 17.67 -1.99
Conservative David Smith 2,219 16.12 -3.65
Labour Co-op Tony Frisby 1,053 7.65 +3.37
Labour Co-op Michael Adams 1,044 7.58 +4.23
Green Andrew Coleman 1,000 7.26 +0.38
Labour Co-op Harris Fitch 931 6.76 +3.42
Green Rebecca Duffy 692 5.03 -1.07
Green Stuart Hay 679 4.93 -0.80
Liberal Democrat Harry Dienes 483 3.51 -0.61
UKIP Barry Pinchen 310 2.25 -1.37
UKIP Paul Perrin 283 2.06 -0.42
Turnout 4,992 46.52 +4.77
Conservative hold Swing -2.26
Conservative hold Swing -3.84
Conservative hold Swing -4.81

South Portslade

South Portslade highlighted BHward18-South Portslade.jpg
South Portslade highlighted
South Portslande (2)
PartyCandidateVotes%±
Labour Co-op Leslie Hamilton 1,580 28.04 +6.70
Labour Co-op Alan Robins 1,234 21.90 +2.87
Conservative Stephen Harbor-Wade 941 16.70 -3.15
Conservative Steve Harmer-Strange 830 14.73 -5.50
Green Cathy Marchland 398 7.06 +1.05
Green Steve Watson 263 4.67 +1.07
Liberal Democrat Ken Rist 208 3.69 -1.63
Liberal Democrat Peter Denyer 180 3.19 -1.42
Turnout 3,053 43.35 +2.65
Labour Co-op hold Swing +9.85
Labour Co-op gain from Conservative Swing +8.37

St Peter's and North Laine

St Peter's and North Laine highlighted BHward11-St Peter's and North Laine.jpg
St Peter's and North Laine highlighted
St Peter's and North Laine (3)
PartyCandidateVotes%±
Green Lizzie Deane 3,407 22.41 +3.21
Green Ian Davey 3,132 20.02 +2.52
Green Pete West 3,043 19.45 +1.85
Labour Co-op Clare Calder 1,326 8.48 +0.32
Labour Co-op James Hallwood 1,148 7.34 -0.34
Labour Co-op Peter Gillman 1,137 7.27 -0.09
Conservative Mike Long 490 3.13 -1.08
Conservative Joseph Tansey 481 3.07 -1.09
Conservative Patrick Ward 480 3.07 -0.63
Liberal Democrat David Sears 316 2.02 -1.08
Liberal Democrat William Parker 240 1.53 -0.85
Liberal Democrat Graham Hunnable 231 1.48 -1.10
UKIP Sabiha Choudhury 134 0.86 N/A
Independent Gerald O'Brien 81 0.52 N/A
Turnout 5,508 41.40 +7.28
Green hold Swing +2.89
Green hold Swing +2.54
Green hold Swing +2.26

Westbourne

Westbourne highlighted BHward20-Westbourne.jpg
Westbourne highlighted
Westbourne (2)
PartyCandidateVotes%±
Conservative Brian Oxley 1,228 19.74 -6.93
Conservative Denise Cobb 1,152 18.51 -7.62
Labour Co-op Simon Battle 1,020 16.39 +4.38
Green Louisa Greenbaum 911 14.64 +6.58
Labour Co-op Jacqueline Teeboon 807 12.97 +3.22
Green Ray Cunningham 615 9.88 +1.82
Liberal Democrat June Batchelor 264 4.24 -0.56
Liberal Democrat Coreen Sears 186 2.99 +0.46
The European Citizens Party Susan Collard 39 0.64 N/A
Turnout 3,388 45.52 +6.66
Conservative hold Swing -11.31
Conservative hold Swing -12.51

Wish

Wish highlighted BHward19-Wish.jpg
Wish highlighted
Wish (2)
PartyCandidateVotes%±
Labour Co-op Anne Pissaridou 1,348 19.95 +6.84
Conservative Garry Peltzer Dunn 1,310 19.38 -6.32
Conservative Ted Kemble 1,183 17.51 -7.01
Labour Co-op Christine Robinson 1,144 16.93 +4.03
Green Sue Baumgardt 540 7.99 +0.62
Independent Jenny Barnard-Langston 301 4.45 N/A
Green Anton Simanowitz 299 4.42 +0.06
Independent Mark Barnard 244 3.61 N/A
Liberal Democrat Bob Bailey 170 2.52 -1.81
Liberal Democrat Daniel Russell 119 1.76 -2.27
UKIP Richard Allden 100 1.48 N/A
Turnout 3,572 51.10 +4.52
Labour Co-op gain from Conservative Swing +13.85
Conservative hold Swing -10.14

Withdean

Withdean highlighted BHward9-Withdean.jpg
Withdean highlighted
Withdean (3)
PartyCandidateVotes%±
Green Sue Shanks 2,184 13.86 +8.51
Conservative Ann Norman 2,105 13.35 -2.01
Conservative Ken Norman 1,992 12.64 -2.26
Conservative Robert Németh 1,891 12.00 -3.57
Green Paul Philo 1,810 11.48 +6.51
Green Jacqui Cuff 1,672 10.61 +6.83
Labour Co-op Caraline Brown 1,222 7.75 +2.17
Labour Co-op Susan Darby 1,164 7.38 +1.96
Labour Co-op Fraser Kemp 983 6.24 +1.10
Liberal Democrat John Lovatt 309 1.96 -1.27
Liberal Democrat Robert Stockman 218 1.38 -1.48
Liberal Democrat Hyder Khalil 213 1.35 -1.33
Turnout 5,447 50.95 +7.27
Green gain from Conservative Swing +12.08
Conservative hold Swing -7.04
Conservative hold Swing -4.59

Woodingdean

Woodingdean highlighted Map of Brighton and Hove wards -Woodingdean.jpg
Woodingdean highlighted
Woodingdean (2)
PartyCandidateVotes%±
Conservative Dee Simson 1,619 27.80 -5.35
Conservative Geoff Wells 1,565 26.87 -6.22
Labour Co-op Susan Burns 853 14.65 +4.78
Labour Co-op Julian Hayes 756 13.14 +4.11
Green Andrea Finch 403 6.92 +2.95
Green Karen James 259 4.45 +1.00
UKIP Graham Townsend 159 2.73 N/A
Liberal Democrat Christine-Reba Edge 121 2.08 -2.18
Liberal Democrat Anthony Eke 89 1.53 -1.64
Turnout 3,149 42.73 +3.89
Conservative hold Swing -10.13
Conservative hold Swing -10.33

Related Research Articles

Brighton Pavilion (UK Parliament constituency) Parliamentary constituency in the United Kingdom

Brighton Pavilion is a constituency represented in the House of Commons of the UK Parliament since 2010 by Caroline Lucas of the Green Party; who on being elected, became the first MP for that party in the United Kingdom.

Brighton Kemptown (UK Parliament constituency) Parliamentary constituency in the United Kingdom

Brighton Kemptown is a constituency created in 1950 in the House of Commons of the UK Parliament covering the eastern portion of the city of Brighton and Hove including Kemptown and part of the Lewes District.

Brighton and Hove City Council is a unitary authority in East Sussex, England. It was created as Brighton and Hove Borough Council on 1 April 1997 replacing Brighton and Hove Borough Councils. It was granted city status in 2001.

2006 Colchester Borough Council election

The 2006 Colchester Borough Council election took place on 4 May 2006 to elect members of Colchester Borough Council in Essex, England. One third of the council was up for election and the council stayed under no overall control.

2007 Calderdale Metropolitan Borough Council election

Elections to Calderdale Metropolitan Borough Council were held on 3 May 2007 with the exception of the Warley ward which was postponed until 14 June 2007 due to the sudden death of one of the candidates. One third of the council was up for election and the council stayed under no overall control with a minority Conservative administration. The total turnout of the election was 38.01%. The winning candidate in each ward is highlighted in bold.

2010 Barnet London Borough Council election

The 2010 Barnet Council election took place on 6 May 2010 to elect members of Barnet London Borough Council in London, England. The whole council was up for election and the Conservative party stayed in overall control of the council.

2011 South Norfolk District Council election

The elections to South Norfolk District Council were held on Thursday 5 May 2011 along with various other local elections around England, elections to the Scottish Parliament, National Assembly of Wales and Northern Ireland Assembly, and a referendum on whether to adopt the Alternative Vote electoral system for elections to the House of Commons. All 46 council seats were up for election. The previous council was controlled by the Conservatives, with the Liberal Democrats being the only opposition.

The 2011 council elections in Guildford saw the Conservatives retain control over Guildford Borough Council with an increased majority of 20 seats. Full results for each ward can be found at Guildford Council election, full results, 2011.

2011 Sunderland City Council election

The 2011 Sunderland Council election took place on 5 May 2011 to elect members of Sunderland Metropolitan Borough Council in Tyne and Wear, England. One third of the council was up for election and the Labour party stayed in overall control of the council.

2012 Watford Borough Council election

Elections to Watford Borough Council were held on 3 May 2012. Three years in every four, a third of the council retires and elections are held.

2011 City of Bradford Metropolitan District Council election

The City of Bradford Metropolitan District Council election took place on Thursday 5 May 2011.

2013 Norfolk County Council election

The Norfolk County Council election took place across Norfolk on 2 May 2013, coinciding with local elections for all county councils in England. The results were announced the following day, Friday 3 May 2013. The result brought to an end 12 years of Conservative administration, who finished three seats short of a majority after losing 20 seats, leaving the Council in no overall control (NOC). UKIP and the Labour Party both made gains of 14 and 11 seats respectively. The Liberal Democrats and the Green Party both lost three seats each, whilst an independent won a single seat in North Norfolk.

2014 St Albans City and District Council election

The 2014 St Albans City and District Council election took place on 22 May 2014 to elect members of St Albans District Council in Hertfordshire, England. One third of the council was up for election and the council stayed under no overall control.

2014 Enfield London Borough Council election

The 2014 Enfield Council election took place on 22 May 2014 to elect members of Enfield London Borough Council in London, England. The whole council was up for election and the Labour party retained overall control of the council, increasing their majority over the Conservative party by five seats.

2014 Brent London Borough Council election

The 2014 Brent London Borough Council election took place on 22 May 2014 to elect members of Brent London Borough Council in London, England. The whole council was up for election and the Labour Party stayed in overall control of the council.

2012 St Helens Metropolitan Borough Council election

The 2012 St Helens Metropolitan Borough Council election took place on 3 May 2012 to elect members of St Helens Metropolitan Borough Council in Merseyside, England. One third of the council was up for election and the Labour party stayed in overall control of the council.

2015 South Norfolk District Council election

The 2015 South Norfolk District Council election was held on Thursday 7 May 2015 to elect the whole council as part of United Kingdom local elections, 2015 coinciding with the general election. The council continued to consist of 46 councillors and as immediately after the previous election, the council was controlled by local Conservatives, with local Liberal Democrats being the only opposition. The governing group's numbers were augmented by two councillors at the expense of that opposition group. Three defecting-from-majority independent councillors lost their council seats.

2018 Lambeth London Borough Council election

The 2018 Lambeth Council election took place on 3 May 2018 to elect members of Lambeth Council in England. The election saw Labour remain in control of Lambeth Council with a slightly reduced majority, winning over 90% of the seats. The Green Party of England and Wales achieved its best-ever result in the borough, winning 5 seats and becoming the official opposition.

2018 City of Bradford Metropolitan District Council election

The 2018 City of Bradford Metropolitan District Council took place on 3 May 2018 to elect members of Bradford District Council in England. This was on the same day as other local elections. One councillor was elected in each ward for a four-year term so the councillors elected in 2018 last stood for election in 2014. Each ward is represented by three councillors, the election of which is staggered, so only one third of the councillors were elected in this election. Before the election there was a Labour majority and afterwards Labour had increased their majority.

References

  1. Ridgway, Tim (8 May 2011). "Updated: Greens triumph in Brighton and Hove". The Argus. Retrieved 2011-07-21.
  2. "Election candidates 2011". Brighton & Hove Council. 2011-04-04. Retrieved 2011-04-09.
  3. "Labour are not looking for coalition with Greens". News From Brighton. Retrieved 2011-07-21.
  4. "UK's first Green council administration announced". Brighton and Hove Green Party. Retrieved 2011-07-21.
  5. The Argus. 10 March 2003 https://web.archive.org/web/20150402110849/http://www.theargus.co.uk/archive/2003/03/10/6740664.Councillor_goes_it_alone_in_elections/. Archived from the original on 2 April 2015. Retrieved 10 March 2015.Missing or empty |title= (help)