![]() | ||||||||||||||||||||||
---|---|---|---|---|---|---|---|---|---|---|---|---|---|---|---|---|---|---|---|---|---|---|
| ||||||||||||||||||||||
All 53 members | ||||||||||||||||||||||
Turnout | 44.83% | |||||||||||||||||||||
| ||||||||||||||||||||||
|
Elections to Tonbridge and Malling Borough Council were held on 5 May 2011. The whole borough council (53 members) were up for election. Parish council elections and the national Alternative Vote referendum were held on the same day.
Elections to Tonbridge and Malling Borough Council in Kent, United Kingdom are held every four years. Since the last boundary changes in 2003, 53 councillors have been elected from 26 wards.
The Conservatives tightened their grip on the Council by gaining three seats from the Liberal Democrats. They however lost one seat to Labour who now had a presence on the Council after a four-year absence. The leader of the Liberal Democrats David Thornewell lost his seat after 37 years on the Council. Thornewell had been a member of the Council since its creation in 1974. [1] He had also been a member of Malling Rural District Council, one of the Council's predecessors, between 1972 and 1974.
Tonbridge & Malling Borough Council [2] [3] | |||
---|---|---|---|
Party | Seats | +/- | |
Conservative Party | 48 | +2 | |
Liberal Democrats | 4 | -3 | |
Labour Party | 1 | +1 | |
Total | 53 | ||
Valid Ballot Papers | 39,512 | ||
Rejected Ballot Papers | 454 | ||
Ballot Papers Issued | 39,966 | ||
Registered Electors | 89,146 | ||
Turnout | 44.83% |
Aylesford Ward (2) [4] | |||||
---|---|---|---|---|---|
Candidate | Party | Votes | % (Total) | % (Valid) | |
John Albert Leonard Balcombe | Conservative Party | 1,061 | 38.82% | 64.26% | |
David William Smith | Conservative Party | 978 | 35.78% | 59.24% | |
Julia Susan Taylor | Labour Party | 362 | 13.25% | 21.93% | |
Stephen Coddrington Clarke | Liberal Democrats | 332 | 12.15% | 20.11% | |
Total | 2,733 | 100.00% | |||
Valid Ballot Papers | 1,651 | ||||
Rejected Ballot Papers | 20 | ||||
Ballot Papers Issued | 1,671 | ||||
Registered Electors | 3,861 | ||||
Turnout | 43.28% |
Blue Bell Hill & Walderslade Ward (2) [5] | |||||
---|---|---|---|---|---|
Candidate | Party | Votes | % (Total) | % (Valid) | |
Peter John Homewood | Conservative Party | 1,072 | 46.03% | 76.68% | |
Allan Kenneth Sullivan | Conservative Party | 896 | 38.47% | 64.09% | |
Richard James Baron | Labour Party | 361 | 15.50% | 25.82% | |
Total | 2,329 | 100.00% | |||
Valid Ballot Papers | 1,398 | ||||
Rejected Ballot Papers | 42 | ||||
Ballot Papers Issued | 1,440 | ||||
Registered Electors | 3,208 | ||||
Turnout | 44.89% |
Borough Green & Long Mill Ward (3) [6] | |||||
---|---|---|---|---|---|
Candidate | Party | Votes | % (Total) | % (Valid) | |
Sue Murray | Conservative Party | 1,522 | 23.93% | 57.46% | |
David William Patrick Evans | Conservative Party | 1,422 | 22.36% | 53.68% | |
Tony Sayer | Conservative Party | 1,256 | 19.75% | 47.41% | |
Mike Taylor | Independent | 783 | 12.31% | 29.56% | |
Paul Michael Spensley | Independent | 454 | 7.14% | 17.14% | |
Victoria Hayman | Labour Party | 321 | 5.05% | 12.12% | |
Stephen Hayman | Labour Party | 302 | 4.75% | 11.40% | |
James Hayman | Labour Party | 300 | 4.72% | 11.33% | |
Total | 6,360 | 100.00% | |||
Valid Ballot Papers | 2,649 | ||||
Rejected Ballot Papers | 70 | ||||
Ballot Papers Issued | 2,719 | ||||
Registered Electors | 5,296 | ||||
Turnout | 51.34% |
Burham, Eccles & Wouldham Ward (2) [7] | |||||
---|---|---|---|---|---|
Candidate | Party | Votes | % (Total) | % (Valid) | |
Roger William Dalton | Conservative Party | 837 | 34.52% | 60.39% | |
Dave Davis | Conservative Party | 808 | 33.32% | 58.30% | |
Marion Irene Mountford | Labour Party | 362 | 14.93% | 26.12% | |
Timothy Peter Fulwell | Liberal Democrats | 216 | 8.91% | 15.58% | |
Valerie Ann Lilian Oxberry | Liberal Democrats | 202 | 8.33% | 14.57% | |
Total | 2,425 | 100.00% | |||
Valid Ballot Papers | 1,386 | ||||
Rejected Ballot Papers | 30 | ||||
Ballot Papers Issued | 1,416 | ||||
Registered Electors | 3,419 | ||||
Turnout | 41.42% |
Cage Green Ward (2) [8] | |||||
---|---|---|---|---|---|
Candidate | Party | Votes | % (Total) | % (Valid) | |
Mark Osmond Davis | Conservative Party | 1,065 | 37.53% | 65.06% | |
Nicolas John Heslop | Conservative Party | 1,044 | 36.79% | 63.78% | |
Bruce Goodhart | Labour Party | 314 | 11.06% | 19.18% | |
Jason Lower | Liberal Democrats | 223 | 7.86% | 13.62% | |
Howard Porter | Green Party | 192 | 6.77% | 11.73% | |
Total | 2,838 | 100.00% | |||
Valid Ballot Papers | 1,637 | ||||
Rejected Ballot Papers | 17 | ||||
Ballot Papers Issued | 1,654 | ||||
Registered Electors | 3,251 | ||||
Turnout | 50.88% |
Castle Ward (2) [9] | |||||
---|---|---|---|---|---|
Candidate | Party | Votes | % (Total) | % (Valid) | |
Vivian Mary Chimmo Branson | Conservative Party | 1,049 | 32.98% | 63.58% | |
Owen Charles Baldock | Conservative Party | 1,030 | 32.38% | 62.42% | |
Hazel Frances Dawe | Green Party | 326 | 10.25% | 19.76% | |
Gill Wilson | Liberal Democrats | 294 | 9.24% | 17.82% | |
Steven Mark Dawe | Green Party | 271 | 8.52% | 16.42% | |
Tim Wilson | Liberal Democrats | 211 | 6.63% | 12.79% | |
Total | 3,181 | 100.00% | |||
Valid Ballot Papers | 1,650 | ||||
Rejected Ballot Papers | 52 | ||||
Ballot Papers Issued | 1,702 | ||||
Registered Electors | 3,600 | ||||
Turnout | 47.28% |
Ditton Ward (2) [10] | |||||
---|---|---|---|---|---|
Candidate | Party | Votes | % (Total) | % (Valid) | |
Jeannett Marie Bellamy | Conservative Party | 864 | 27.68% | 51.92% | |
Carol Mary Gale | Conservative Party | 805 | 25.79% | 48.38% | |
Barry David Stone | Liberal Democrats | 495 | 15.86% | 29.75% | |
Paul Hatcher | Liberal Democrats | 480 | 15.38% | 28.85% | |
Alan Piper | Labour Party | 254 | 8.14% | 15.26% | |
Daniel James Frost | Labour Party | 223 | 7.15% | 13.40% | |
Total | 3,121 | 100.00% | |||
Valid Ballot Papers | 1,664 | ||||
Rejected Ballot Papers | 25 | ||||
Ballot Papers Issued | 1,689 | ||||
Registered Electors | 3,689 | ||||
Turnout | 45.78% |
Downs Ward (2) [11] | |||||
---|---|---|---|---|---|
Candidate | Party | Votes | % (Total) | % (Valid) | |
Ann Kemp | Conservative Party | 1,056 | 39.43% | 72.03% | |
Matthew Aidan Craig Balfour | Conservative Party | 1,032 | 38.54% | 70.40% | |
Andrew Payne | Liberal Democrats | 349 | 13.03% | 23.81% | |
Hugh James Maxwell Young | Liberal Democrats | 241 | 9.00% | 16.44% | |
Total | 2,678 | 100.00% | |||
Valid Ballot Papers | 1,466 | ||||
Rejected Ballot Papers | 33 | ||||
Ballot Papers Issued | 1,499 | ||||
Registered Electors | 2,899 | ||||
Turnout | 51.71% |
East Malling Ward (2) [12] | |||||
---|---|---|---|---|---|
Candidate | Party | Votes | % (Total) | % (Valid) | |
Liz Simpson | Liberal Democrats | 737 | 34.47% | 55.88% | |
Christine Jean Woodger | Liberal Democrats | 541 | 25.30% | 41.02% | |
Richard Charles Brown | Conservative Party | 410 | 19.18% | 31.08% | |
Peter McDermott | Conservative Party | 277 | 12.96% | 21.00% | |
Stuart Terrence | Independent | 173 | 8.09% | 13.12% | |
Total | 2,138 | 100.00% | |||
Valid Ballot Papers | 1,319 | ||||
Rejected Ballot Papers | 9 | ||||
Ballot Papers Issued | 1,328 | ||||
Registered Electors | 3,496 | ||||
Turnout | 37.99% |
East Peckham & Golden Green Ward (2) [13] | |||||
---|---|---|---|---|---|
Candidate | Party | Votes | % (Total) | % (Valid) | |
Liz Holland | Conservative Party | 924 | 38.07% | 65.58% | |
Howard Seymour Rogers | Conservative Party | 784 | 32.30% | 55.64% | |
Tony Mark Dowdeswell | UK Independence Party | 222 | 9.15% | 15.76% | |
Terry Scott | Labour Party | 220 | 9.06% | 15.61% | |
Adriana Fabin | Liberal Democrats | 153 | 6.30% | 10.86% | |
Ralph Lovesey | Liberal Democrats | 124 | 5.11% | 8.80% | |
Total | 2,427 | 100.00% | |||
Valid Ballot Papers | 1,409 | ||||
Rejected Ballot Papers | 9 | ||||
Ballot Papers Issued | 1,418 | ||||
Registered Electors | 3,079 | ||||
Turnout | 46.05% |
Hadlow, Mereworth & West Peckham Ward (2) [14] | |||||
---|---|---|---|---|---|
Candidate | Party | Votes | % (Total) | % (Valid) | |
Jill Ann Anderson | Conservative Party | 1,198 | 44.85% | 77.99% | |
Janet Lynne Sergison | Conservative Party | 1,069 | 40.02% | 69.60% | |
Charles Henry Fraser Vernon | Liberal Democrats | 404 | 15.13% | 26.30% | |
Total | 2,671 | 100.00% | |||
Valid Ballot Papers | 1,536 | ||||
Rejected Ballot Papers | 36 | ||||
Ballot Papers Issued | 1,572 | ||||
Registered Electors | 3,369 | ||||
Turnout | 46.66% |
Higham Ward (3) [15] | |||||
---|---|---|---|---|---|
Candidate | Party | Votes | % (Total) | % (Valid) | |
Andy Allison | Conservative Party | 1,513 | 26.13% | 68.80% | |
Tom Edmondston-Low | Conservative Party | 1,433 | 24.75% | 65.17% | |
David John Trice | Conservative Party | 1,336 | 23.07% | 60.75% | |
Douglas Ramsay | Labour Party | 534 | 9.22% | 24.28% | |
Emily Williams | Labour Party | 508 | 8.77% | 23.10% | |
Alastair Mordaunt | Labour Party | 467 | 8.06% | 21.24% | |
Total | 5,791 | 100.00% | |||
Valid Ballot Papers | 2,199 | ||||
Rejected Ballot Papers | 35 | ||||
Ballot Papers Issued | 2,234 | ||||
Registered Electors | 4,633 | ||||
Turnout | 48.22% |
Hildenborough Ward (2) [16] | |||||
---|---|---|---|---|---|
Candidate | Party | Votes | % (Total) | % (Valid) | |
Mark Russell Rhodes | Conservative Party | 1,361 | 37.69% | 71.03% | |
Chris Smith | Conservative Party | 1,259 | 34.87% | 65.71% | |
Justine Mountford | Green Party | 278 | 7.70% | 14.51% | |
Joseph William Barry Gray | Liberal Democrats | 253 | 7.01% | 13.20% | |
Stuart John Riches | Liberal Democrats | 235 | 6.51% | 12.27% | |
Richard Mountford | Green Party | 225 | 6.23% | 11.74% | |
Total | 3,611 | 100.00% | |||
Valid Ballot Papers | 1,916 | ||||
Rejected Ballot Papers | 17 | ||||
Ballot Papers Issued | 1,933 | ||||
Registered Electors | 3,786 | ||||
Turnout | 51.06% |
Ightham Ward (1) [17] | ||||
---|---|---|---|---|
Candidate | Party | Votes | % | |
Rodney Chartres | Conservative Party | 632 | 79.70% | |
Paul Raymond Rootes | Liberal Democrats | 161 | 20.30% | |
Total | 793 | 100.00% | ||
Rejected Ballot Papers | 7 | |||
Ballot Papers Issued | 800 | |||
Registered Electors | 1,565 | |||
Turnout | 51.12% |
Judd Ward (2) [18] | |||||
---|---|---|---|---|---|
Candidate | Party | Votes | % (Total) | % (Valid) | |
Peter Francis Bolt | Conservative Party | 1,025 | 35.93% | 64.71% | |
David John Cure | Conservative Party | 798 | 27.97% | 50.38% | |
Reuben Ames | Labour Party | 321 | 11.25% | 20.26% | |
Patricia Townend | Labour Party | 307 | 10.76% | 19.38% | |
Robert William George Oliver | Green Party | 209 | 7.33% | 13.19% | |
Peter Rodney Wood | Liberal Democrats | 193 | 6.76% | 12.18% | |
Total | 2,853 | 100.00% | |||
Valid Ballot Papers | 1,584 | ||||
Rejected Ballot Papers | 14 | ||||
Ballot Papers Issued | 1,598 | ||||
Registered Electors | 3,425 | ||||
Turnout | 46.66% |
Kings Hill Ward (2) [19] | |||||
---|---|---|---|---|---|
Candidate | Party | Votes | % (Total) | % (Valid) | |
Christopher Brown | Conservative Party | 1,419 | 40.55% | 73.18% | |
Trevor John Robins | Conservative Party | 1,204 | 34.41% | 62.09% | |
Nigel James Holland | Liberal Democrats | 237 | 6.77% | 12.22% | |
Kathleen Maria Garlick | Labour Party | 236 | 6.74% | 12.17% | |
Terence Pullinger | Labour Party | 236 | 6.74% | 12.17% | |
David Leonard Waller | UK Independence Party | 167 | 4.77% | 8.61% | |
Total | 3,499 | 100.00% | |||
Valid Ballot Papers | 1,939 | ||||
Rejected Ballot Papers | 23 | ||||
Ballot Papers Issued | 1,962 | ||||
Registered Electors | 4,870 | ||||
Turnout | 40.29% |
Larkfield North Ward (2) [20] | |||||
---|---|---|---|---|---|
Candidate | Party | Votes | % (Total) | % (Valid) | |
Mike Parry-Waller | Conservative Party | 654 | 25.80% | 45.80% | |
Russ Taylor | Conservative Party | 627 | 24.73% | 43.91% | |
David Thornewell | Liberal Democrats | 576 | 22.72% | 40.34% | |
John Roderick Hastings Celements | Liberal Democrats | 456 | 17.99% | 31.93% | |
Janet Julia Denbow | Labour Party | 222 | 8.76% | 15.55% | |
Total | 2,535 | 100.00% | |||
Valid Ballot Papers | 1,428 | ||||
Rejected Ballot Papers | 8 | ||||
Ballot Papers Issued | 1,436 | ||||
Registered Electors | 3,654 | ||||
Turnout | 39.30% |
Larkfield South Ward (2) [21] | |||||
---|---|---|---|---|---|
Candidate | Party | Votes | % (Total) | % (Valid) | |
Anita Sandra Oakley | Liberal Democrats | 580 | 26.48% | 49.32% | |
Timothy Bishop | Liberal Democrats | 508 | 23.20% | 43.20% | |
Peter John Collett | Conservative Party | 390 | 17.81% | 33.16% | |
Nigel Peter Day | Conservative Party | 320 | 14.61% | 27.21% | |
David Charles Finn | Labour Party | 204 | 9.32% | 17.35% | |
Mark Forgione | Labour Party | 188 | 8.58% | 15.99% | |
Total | 2,190 | 100.00% | |||
Valid Ballot Papers | 1,176 | ||||
Rejected Ballot Papers | 12 | ||||
Ballot Papers Issued | 1,188 | ||||
Registered Electors | 3,088 | ||||
Turnout | 38.47% |
Medway Ward (2) [22] | |||||
---|---|---|---|---|---|
Candidate | Party | Votes | % (Total) | % (Valid) | |
Jessica Ruth Louise Elks | Conservative Party | 966 | 32.62% | 62.12% | |
Russell David Lancaster | Conservative Party | 899 | 30.36% | 57.81% | |
Paul Drury | Labour Party | 358 | 12.09% | 23.02% | |
David Buss | Labour Party | 334 | 11.28% | 21.48% | |
Nicholas Sebastian Scott Ford | Liberal Democrats | 214 | 7.23% | 13.76% | |
Clive John Gray | Liberal Democrats | 190 | 6.42% | 12.22% | |
Total | 2,961 | 100.00% | |||
Valid Ballot Papers | 1,555 | ||||
Rejected Ballot Papers | 17 | ||||
Ballot Papers Issued | 1,572 | ||||
Registered Electors | 3,725 | ||||
Turnout | 42.20% |
Snodland East Ward (2) [23] | |||||
---|---|---|---|---|---|
Candidate | Party | Votes | % (Total) | % (Valid) | |
Steven Michael King | Conservative Party | 499 | 26.60% | 50.56% | |
Julian Atkins | Labour Party | 465 | 24.79% | 47.11% | |
David Martin Laverty | Labour Party | 456 | 24.31% | 46.20% | |
Les Withey | Conservative Party | 456 | 24.31% | 46.20% | |
Total | 1,876 | 100.00% | |||
Valid Ballot Papers | 987 | ||||
Rejected Ballot Papers | 13 | ||||
Ballot Papers Issued | 1,000 | ||||
Registered Electors | 2,916 | ||||
Turnout | 34.29% |
Snodland West Ward (3) [24] | |||||
---|---|---|---|---|---|
Candidate | Party | Votes | % (Total) | % (Valid) | |
David Keeley | Conservative Party | 963 | 19.04% | 53.35% | |
Anne Moloney | Conservative Party | 961 | 19.00% | 53.24% | |
Barbara Ann Brown | Conservative Party | 947 | 18.72% | 52.47% | |
Paul Michael Hickmott | Labour Party | 870 | 17.20% | 48.20% | |
Iain Paul Stephen Laverty | Labour Party | 670 | 13.24% | 37.12% | |
Wayne John Mallard | Labour Party | 648 | 12.81% | 35.90% | |
Total | 5,059 | 100.00% | |||
Valid Ballot Papers | 1,805 | ||||
Rejected Ballot Papers | 22 | ||||
Ballot Papers Issued | 1,827 | ||||
Registered Electors | 4,508 | ||||
Turnout | 40.53% |
Trench Ward (2) [25] | |||||
---|---|---|---|---|---|
Candidate | Party | Votes | % (Total) | % (Valid) | |
Jean Atkinson | Conservative Party | 677 | 33.38% | 60.28% | |
Pam Bates | Conservative Party | 590 | 29.09% | 52.54% | |
Robert Baughan | Labour Party | 404 | 19.92% | 35.98% | |
Tania Blackmore | Labour Party | 357 | 17.60% | 31.79% | |
Total | 2,028 | 100.00% | |||
Valid Ballot Papers | 1,123 | ||||
Rejected Ballot Papers | 14 | ||||
Ballot Papers Issued | 1,137 | ||||
Registered Electors | 2,951 | ||||
Turnout | 38.53% |
Vauxhall Ward (2) [26] | |||||
---|---|---|---|---|---|
Candidate | Party | Votes | % (Total) | % (Valid) | |
Maria Frances Heslop | Conservative Party | 734 | 26.06% | 49.26% | |
Sarah Victoria Spence | Conservative Party | 654 | 23.22% | 43.89% | |
Frani Hoskins | Liberal Democrats | 450 | 15.97% | 30.20% | |
Garry Christopher Bridge | Liberal Democrats | 335 | 11.89% | 22.48% | |
James Parish | Labour Party | 263 | 9.34% | 17.65% | |
Kathryn Parish | Labour Party | 248 | 8.80% | 16.64% | |
Stephen Greville Jackson | Green Party | 133 | 4.72% | 8.93% | |
Total | 2,817 | 100.00% | |||
Valid Ballot Papers | 1,490 | ||||
Rejected Ballot Papers | 7 | ||||
Ballot Papers Issued | 1,497 | ||||
Registered Electors | 3,435 | ||||
Turnout | 43.58% |
Wateringbury Ward (1) [27] | ||||
---|---|---|---|---|
Candidate | Party | Votes | % | |
Simon Richard Jonathan Jessel | Conservative Party | 493 | 62.56% | |
David Thomas Mitchelmore | Labour Party | 164 | 20.81% | |
Stephen James Patt | Liberal Democrats | 131 | 16.62% | |
Total | 788 | 100.00% | ||
Rejected Ballot Papers | 6 | |||
Ballot Papers Issued | 794 | |||
Registered Electors | 1,579 | |||
Turnout | 50.28% |
West Malling & Leybourne Ward (3) [28] | |||||
---|---|---|---|---|---|
Candidate | Party | Votes | % (Total) | % (Valid) | |
Sasha Luck | Conservative Party | 1,234 | 22.78% | 57.53% | |
Brian John Luker | Conservative Party | 1,147 | 21.18% | 53.47% | |
Mark Squire Worrall | Conservative Party | 1,137 | 20.99% | 53.01% | |
Yvonne Smith | Liberal Democrats | 489 | 9.03% | 22.80% | |
Julie May Lusher | Liberal Democrats | 402 | 7.42% | 18.74% | |
Jeremy Leslie Teasdale | Labour Party | 361 | 6.67% | 16.83% | |
George Demuth | Liberal Democrats | 350 | 6.46% | 16.32% | |
Peter Graham Stevens | UK Independence Party | 296 | 5.47% | 13.80% | |
Total | 5,416 | 100.00% | |||
Valid Ballot Papers | 2,145 | ||||
Rejected Ballot Papers | 13 | ||||
Ballot Papers Issued | 2,158 | ||||
Registered Electors | 4,479 | ||||
Turnout | 48.18% |
Wrotham Ward (1) [29] | ||||
---|---|---|---|---|
Candidate | Party | Votes | % | |
Martin Andrew Coffin | Conservative Party | 459 | 64.47% | |
Chris Mills | Liberal Democrats | 253 | 35.53% | |
Total | 712 | 100.00% | ||
Rejected Ballot Papers | 10 | |||
Ballot Papers Issued | 722 | |||
Registered Electors | 1,365 | |||
Turnout | 52.89% |
Tonbridge and Malling is a constituency represented in the House of Commons of the UK Parliament since 2015 by Tom Tugendhat, a Conservative.
Chatham and Aylesford is a constituency represented in the House of Commons of the UK Parliament since 2010 by Tracey Crouch, a Conservative.
Elections to Slough Borough Council were held on 4 May 2006. One third of the council was up for election. This was the 121st Slough general local authority election since Slough became a local government unit in 1863.
An election to Slough Borough Council was held on 10 June 2004. The whole council was up for election. This was the 120th Slough general local authority election, since Slough became a local government unit in 1863, including both whole Council elections and elections by thirds.
The 2007 council elections in Guildford saw the Conservatives retain control over Guildford Borough Council. Full results for each ward can be found at Guildford Council election, full results, 2007.
The 2010 Barnet Council election took place on 6 May 2010 to elect members of Barnet London Borough Council in London, England. The whole council was up for election and the Conservative party stayed in overall control of the council.
Local elections were held in the United Kingdom in 1991. The results were a setback for the governing Conservative Party, who were left with their lowest number of councillors since 1973 - though their popular vote was an improvement from the 1990 local elections, and the Conservatives would go on to win the general election in 1992.
The 1999 Pendle Borough Council election took place on 6 May 1999 to elect members of Pendle Borough Council in Lancashire, England. One third of the council was up for election and the Liberal Democrats lost overall control of the council to no overall control.
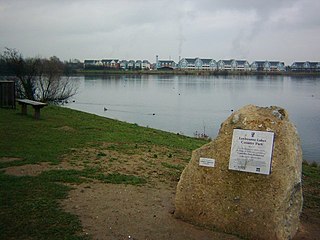
Leybourne Lakes Country Park is near Snodland, in Kent, England. The park, which opened in 2004, was created from disused gravel pits that have been flooded and landscaped to make fishing and wildlife lakes.
The eighth full elections for Guildford Borough Council took place on 6 May 1999.
The 2011 council elections in Guildford saw the Conservatives retain control over Guildford Borough Council with an increased majority of 20 seats. Full results for each ward can be found at Guildford Council election, full results, 2011.
The 2003 Hertsmere Borough Council election took place on 1 May 2003 to elect members of Hertsmere Borough Council in Hertfordshire, England. One third of the council was up for election and the Conservative party stayed in overall control of the council.
The 2014 Enfield Council election took place on 22 May 2014 to elect members of Enfield London Borough Council in London, England. The whole council was up for election and the Labour party retained overall control of the council, increasing their majority over the Conservative party by five seats.
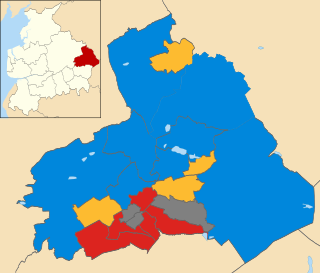
The 2011 Pendle Borough Council election took place on 5 May 2011 to elect members of Pendle Borough Council in Lancashire, England. One third of the council was up for election and the council stayed under no overall control.
The 2014 Brent London Borough Council election took place on 22 May 2014 to elect members of Brent London Borough Council in London, England. The whole council was up for election and the Labour Party stayed in overall control of the council.
Malling was a rural district in Kent, England which covered West Malling, East Malling, Snodland, Larkfield, Borough Green and Aylesford.