The 2011 Ashford Borough Council election took place on 5 May 2011 to elect members of Ashford Borough Council in Kent, England. The whole council was up for election and the Conservative party stayed in overall control of the council. [1]
Borough status in the United Kingdom is granted by royal charter to local government districts in England, Wales and Northern Ireland. The status is purely honorary, and does not give any additional powers to the council or inhabitants of the district. In Scotland, similarly chartered communities were known as royal burghs, although the status is no longer granted.
Kent is a county in South East England and one of the home counties. It borders Greater London to the north west, Surrey to the west and East Sussex to the south west. The county also shares borders with Essex along the estuary of the River Thames, and with the French department of Pas-de-Calais through the Channel Tunnel. The county town is Maidstone.
England is a country that is part of the United Kingdom. It shares land borders with Wales to the west and Scotland to the north-northwest. The Irish Sea lies west of England and the Celtic Sea lies to the southwest. England is separated from continental Europe by the North Sea to the east and the English Channel to the south. The country covers five-eighths of the island of Great Britain, which lies in the North Atlantic, and includes over 100 smaller islands, such as the Isles of Scilly and the Isle of Wight.
The Conservatives gained 2 seats to have 30 of the 43 councillors. [2] Labour picked up 3 seats, while the Ashford Independents made a net gain of 1 seat, to both have 5 councillors. [3] Meanwhile, the Liberal Democrats were reduced to just 2 seats in North Willesborough and Victoria wards, a result that was blamed on the party's national unpopularity. [2] Overall turnout in the election was 56%. [2]
A Councillor is a member of a local government council.
The Labour Party is a centre-left political party in the United Kingdom which has been described as an alliance of social democrats, democratic socialists and trade unionists. The party's platform emphasises greater state intervention, social justice and strengthening workers' rights.
The Liberal Democrats are a liberal political party in the United Kingdom. They presently have 11 Members of Parliament in the House of Commons, 96 members of the House of Lords, and one member of the European Parliament. They also have five Members of the Scottish Parliament and a member each in the Welsh Assembly and London Assembly. The party reached the height of its influence in the early 2010s, forming a junior partner in a coalition government from 2010 to 2015. It is presently led by Vince Cable.
Party | Seats | Gains | Losses | Net gain/loss | Seats % | Votes % | Votes | +/− | |
---|---|---|---|---|---|---|---|---|---|
Conservative | 30 | 3 | 1 | +2 | 69.8 | 46.8 | 21,836 | -6.0% | |
Ashford Independent | 5 | 4 | 3 | +1 | 11.6 | 19.9 | 9,276 | +19.9% | |
Labour | 5 | 3 | 0 | +3 | 11.6 | 10.5 | 4,914 | +3.4% | |
Liberal Democrat | 2 | 0 | 6 | -6 | 4.7 | 10.4 | 4,852 | -17.5% | |
Independent | 1 | 0 | 0 | 0 | 2.3 | 8.1 | 3,762 | -3.2% | |
Green | 0 | 0 | 0 | 0 | 0 | 2.4 | 1,135 | +1.5% | |
UKIP | 0 | 0 | 0 | 0 | 0 | 1.8 | 853 | +1.8% |
2 Conservative candidates were elected unopposed.
Party | Candidate | Votes | % | ± | |
---|---|---|---|---|---|
Labour | David Adley | 241 | 36.3 | +36.3 | |
Ashford Independent | Brian Norris | 240 | 36.1 | -2.3 | |
Conservative | Paul Hardisty | 183 | 27.6 | +6.4 | |
Majority | 1 | 0.2 | |||
Turnout | 664 | 34.3 | +6.1 | ||
Labour gain from Liberal Democrat | Swing | ||||
Party | Candidate | Votes | % | ± | |
---|---|---|---|---|---|
Labour | Chris Clark | 481 | |||
Labour | Brendan Naughton | 479 | |||
Conservative | Stephen Bates | 452 | |||
Conservative | Cenghizhan Jem | 335 | |||
Ashford Independent | Laura Lawrence | 308 | |||
Ashford Independent | Stacey Smith | 261 | |||
Turnout | 2,316 | 33.8 | +5.1 | ||
Labour hold | Swing | ||||
Party | Candidate | Votes | % | ± | |
---|---|---|---|---|---|
Conservative | Neil Bell | 776 | 80.4 | +6.4 | |
Liberal Democrat | Clare Hardwick | 189 | 19.6 | -6.4 | |
Majority | 587 | 60.8 | +12.8 | ||
Turnout | 965 | 48.1 | +5.4 | ||
Conservative hold | Swing | ||||
Party | Candidate | Votes | % | ± | |
---|---|---|---|---|---|
Conservative | Michael Claughton | 407 | 50.7 | -11.4 | |
Ashford Independent | Shirley Ambrose | 208 | 25.9 | +25.9 | |
Labour | Thomas Reed | 123 | 15.3 | -7.9 | |
Green | Steven Campkin | 65 | 8.1 | +8.1 | |
Majority | 199 | 24.8 | -14.1 | ||
Turnout | 80.3 | 44.3 | +8.9 | ||
Conservative hold | Swing | ||||
Party | Candidate | Votes | % | ± | |
---|---|---|---|---|---|
Ashford Independent | Winston Michael | 401 | 38.9 | +38.9 | |
Liberal Democrat | Rita Hawes | 367 | 35.6 | -32.3 | |
Conservative | Ian Cooling | 262 | 25.4 | -6.7 | |
Majority | 34 | 3.3 | |||
Turnout | 1,030 | 43.9 | +8.4 | ||
Independent gain from Liberal Democrat | Swing | ||||
Party | Candidate | Votes | % | ± | |
---|---|---|---|---|---|
Conservative | Andrew Buchanan | 300 | 36.8 | -17.8 | |
Ashford Independent | John Ley | 282 | 34.6 | +34.6 | |
Liberal Democrat | Christopher Took | 234 | 28.7 | -16.7 | |
Majority | 18 | 2.2 | -7.0 | ||
Turnout | 816 | 41.9 | +2.2 | ||
Conservative hold | Swing | ||||
Party | Candidate | Votes | % | ± | |
---|---|---|---|---|---|
Conservative | Gerald Clarkson | 674 | 68.1 | -5.0 | |
Liberal Democrat | George Whyte | 315 | 31.9 | +5.0 | |
Majority | 359 | 36.3 | -9.9 | ||
Turnout | 989 | 49.5 | +9.5 | ||
Conservative hold | Swing | ||||
Party | Candidate | Votes | % | ± | |
---|---|---|---|---|---|
Conservative | Douglas Marriott | 580 | 56.8 | -3.1 | |
Ashford Independent | Sarah Dacre | 279 | 27.3 | +27.3 | |
Green | Geoffery Meaden | 162 | 15.9 | -12.2 | |
Majority | 301 | 29.5 | -2.3 | ||
Turnout | 1,021 | 52.5 | +7.1 | ||
Conservative hold | Swing | ||||
Party | Candidate | Votes | % | ± | |
---|---|---|---|---|---|
Conservative | David Robey | 456 | 49.0 | -18.0 | |
Ashford Independent | Antony Bartlett | 280 | 30.1 | +30.1 | |
Green | Lola Sansom | 113 | 12.1 | +12.1 | |
Liberal Democrat | Leonard Wicklewright | 82 | 8.8 | -12.9 | |
Majority | 176 | 18.9 | -36.4 | ||
Turnout | 931 | 49.7 | -10.9 | ||
Conservative hold | Swing | ||||
Party | Candidate | Votes | % | ± | |
---|---|---|---|---|---|
Conservative | Peter Feacey | 935 | |||
Conservative | Bernard Heyes | 801 | |||
UKIP | David Botting | 370 | |||
Ashford Independent | Rachel Moorat | 368 | |||
Independent | Michael Sharpe | 291 | |||
Turnout | 2,765 | 39.6 | +6.5 | ||
Conservative hold | Swing | ||||
Party | Candidate | Votes | % | ± | |
---|---|---|---|---|---|
Conservative | Jessamy Blanford | 423 | 42.2 | -6.3 | |
Ashford Independent | Jerry Preston-Ladd | 400 | 39.9 | +15.9 | |
Labour | Waheed Qureshi | 179 | 17.9 | +7.6 | |
Majority | 23 | 2.3 | -22.2 | ||
Turnout | 1,002 | 38.3 | +5.3 | ||
Conservative hold | Swing | ||||
Party | Candidate | Votes | % | ± | |
---|---|---|---|---|---|
Ashford Independent | Jane Davey | 376 | 44.4 | +23.7 | |
Conservative | Gregory Winter | 311 | 36.8 | -1.9 | |
Liberal Democrat | John Mackie | 159 | 18.8 | -21.8 | |
Majority | 65 | 7.7 | |||
Turnout | 846 | 44.7 | +8.3 | ||
Independent gain from Liberal Democrat | Swing | ||||
Party | Candidate | Votes | % | ± | |
---|---|---|---|---|---|
Conservative | Michael Burgess | unopposed | |||
Conservative hold | Swing | ||||
Party | Candidate | Votes | % | ± | |
---|---|---|---|---|---|
Ashford Independent | Philip Sims | 440 | 45.7 | ||
Conservative | Elizabeth Tweed | 415 | 43.1 | ||
Labour | Robert Maxted | 107 | 11.1 | ||
Majority | 25 | 2.6 | |||
Turnout | 962 | 54.0 | |||
Independent gain from Conservative | Swing | ||||
Party | Candidate | Votes | % | ± | |
---|---|---|---|---|---|
Conservative | Marion Martin | 505 | 50.0 | -23.5 | |
Liberal Democrat | Kelly-Marie Blundell | 195 | 19.3 | -7.2 | |
Ashford Independent | Charlotte Fraser | 171 | 16.9 | +16.9 | |
Labour | Terry Pavlou | 138 | 13.7 | +13.7 | |
Majority | 310 | 30.7 | -16.3 | ||
Turnout | 1,009 | 46.2 | +9.2 | ||
Conservative hold | Swing | ||||
Party | Candidate | Votes | % | ± | |
---|---|---|---|---|---|
Labour | Harriet Yeo | 224 | 30.5 | +30.5 | |
Conservative | Richard Davis | 202 | 27.5 | +9.0 | |
Ashford Independent | Abigail Burt | 165 | 22.4 | +9.9 | |
Liberal Democrat | Jack Cowen | 144 | 19.6 | -19.0 | |
Majority | 22 | 3.0 | |||
Turnout | 735 | 37.3 | +7.9 | ||
Labour gain from Liberal Democrat | Swing | ||||
Party | Candidate | Votes | % | ± | |
---|---|---|---|---|---|
Liberal Democrat | Robert Davidson | 624 | |||
Ashford Independent | Andrew Mortimer | 522 | |||
Liberal Democrat | Robert Cowley | 502 | |||
Ashford Independent | Simon Thomason | 452 | |||
Conservative | Alex Bell | 446 | |||
Conservative | Alan Pickering | 351 | |||
Labour | Leonardo Cannon | 302 | |||
Turnout | 3,199 | 46.7 | +8.3 | ||
Liberal Democrat hold | Swing | ||||
Independent gain from Liberal Democrat | Swing | ||||
Party | Candidate | Votes | % | ± | |
---|---|---|---|---|---|
Conservative | Bettina Heyes | 540 | 54.4 | -11.6 | |
Labour | Martin Chandler | 214 | 21.6 | +6.6 | |
Independent | Natalie Edwards-Moss | 163 | 16.4 | +16.4 | |
Liberal Democrat | Stuart Dove | 75 | 7.6 | -11.5 | |
Majority | 326 | 32.9 | -14.0 | ||
Turnout | 992 | 41.0 | +10.8 | ||
Conservative hold | Swing | ||||
Party | Candidate | Votes | % | ± | |
---|---|---|---|---|---|
Conservative | James Wedgbury | 489 | 73.4 | -7.6 | |
Labour | Thomas Devine | 177 | 26.6 | +16.1 | |
Majority | 312 | 46.8 | -23.7 | ||
Turnout | 666 | 32.5 | +2.5 | ||
Conservative hold | Swing | ||||
Party | Candidate | Votes | % | ± | |
---|---|---|---|---|---|
Conservative | Michael Bennett | 586 | 52.5 | -29.1 | |
Ashford Independent | Juliet Fenton | 438 | 39.2 | +39.2 | |
Liberal Democrat | Marion Murray | 93 | 8.3 | -10.1 | |
Majority | 148 | 13.2 | -50.0 | ||
Turnout | 1,117 | 58.3 | +9.7 | ||
Conservative hold | Swing | ||||
Party | Candidate | Votes | % | ± | |
---|---|---|---|---|---|
Conservative | Peter Wood | 1,194 | |||
Conservative | William Howard | 1,019 | |||
Ashford Independent | Susan Davison | 535 | |||
Green | Tracy Dighton-Brown | 496 | |||
Liberal Democrat | Rosemary Davies | 340 | |||
Turnout | 3,584 | 52.7 | +11.4 | ||
Conservative hold | Swing | ||||
Party | Candidate | Votes | % | ± | |
---|---|---|---|---|---|
Conservative | Amanda Hodgkinson | 387 | 46.7 | -0.3 | |
Independent | Malcolm Eke | 238 | 28.7 | +15.7 | |
Ashford Independent | Terence Stock | 126 | 15.2 | +15.2 | |
Independent | Jonathan Clarke | 77 | 9.3 | +9.3 | |
Majority | 149 | 18.0 | -0.5 | ||
Turnout | 828 | 37.5 | +0.9 | ||
Conservative hold | Swing | ||||
Party | Candidate | Votes | % | ± | |
---|---|---|---|---|---|
Independent | David Smith | 526 | 63.8 | +20.0 | |
Labour | Sophie Griffiths | 150 | 18.2 | +18.2 | |
Conservative | Carol Brook | 148 | 18.0 | +0.6 | |
Majority | 376 | 45.6 | +23.9 | ||
Turnout | 824 | 32.8 | +5.6 | ||
Independent hold | Swing | ||||
Party | Candidate | Votes | % | ± | |
---|---|---|---|---|---|
Conservative | John Link | 626 | 70.8 | -4.2 | |
Green | Matthew Stanley | 187 | 21.2 | +21.2 | |
Liberal Democrat | Anthony Hardwick | 71 | 8.0 | -17.0 | |
Majority | 439 | 49.7 | -0.3 | ||
Turnout | 884 | 46.9 | +8.7 | ||
Conservative hold | Swing | ||||
Party | Candidate | Votes | % | ± | |
---|---|---|---|---|---|
Labour | Brendan Chilton | 286 | 56.2 | +56.2 | |
Ashford Independent | Palma Laughton | 223 | 43.8 | -24.4 | |
Majority | 63 | 12.4 | |||
Turnout | 509 | 28.5 | +8.2 | ||
Labour gain from Independent | Swing | ||||
Party | Candidate | Votes | % | ± | |
---|---|---|---|---|---|
Conservative | Graham Galpin | 645 | |||
Conservative | Matthew French | 578 | |||
Ashford Independent | Emily Neighbour | 382 | |||
Labour | David Burt | 366 | |||
Labour | Angharad Yeo | 310 | |||
Ashford Independent | James McDonald | 268 | |||
Liberal Democrat | Nadiya Yildirim | 178 | |||
Turnout | 2,727 | 41.4 | +5.6 | ||
Conservative hold | Swing | ||||
Party | Candidate | Votes | % | ± | |
---|---|---|---|---|---|
Conservative | Paul Clokie | 523 | 50.1 | -19.0 | |
Independent | Gillian Whittaker | 251 | 24.0 | +24.0 | |
Independent | Michael Pearson | 146 | 14.0 | +14.0 | |
Labour | Rebecca Andrews | 124 | 11.9 | +11.9 | |
Majority | 272 | 26.1 | -12.1 | ||
Turnout | 1,044 | 56.7 | +13.0 | ||
Conservative hold | Swing | ||||
Party | Candidate | Votes | % | ± | |
---|---|---|---|---|---|
Conservative | Peter Goddard | 546 | 58.8 | -0.4 | |
Independent | Roy Isworth | 382 | 41.2 | +41.2 | |
Majority | 164 | 17.7 | -0.7 | ||
Turnout | 928 | 48.6 | +8.5 | ||
Conservative hold | Swing | ||||
Party | Candidate | Votes | % | ± | |
---|---|---|---|---|---|
Liberal Democrat | Jeremy Adby | 425 | |||
Conservative | Harold Apps | 387 | |||
Labour | Roy Clark | 370 | |||
Liberal Democrat | Stephen Dye | 361 | |||
Labour | Susan Clark | 347 | |||
Conservative | Muhammed Khan | 293 | |||
Ashford Independent | Karen Hopkins | 189 | |||
Ashford Independent | Sarah Stanfield | 185 | |||
Turnout | 2,557 | 36.9 | +6.5 | ||
Liberal Democrat hold | Swing | ||||
Conservative gain from Liberal Democrat | Swing | ||||
Party | Candidate | Votes | % | ± | |
---|---|---|---|---|---|
Conservative | Neil Shorter | 329 | 37.7 | +1.3 | |
Independent | John Holland | 253 | 29.0 | -9.6 | |
Labour | Robert Vincent | 184 | 21.1 | +6.6 | |
Ashford Independent | Simon Nelson | 107 | 12.3 | +12.3 | |
Majority | 76 | 8.7 | |||
Turnout | 873 | 36.3 | +6.2 | ||
Conservative gain from Independent | Swing | ||||
Party | Candidate | Votes | % | ± | |
---|---|---|---|---|---|
Conservative | Clair Bell | 1,113 | |||
Conservative | Robert Taylor | 999 | |||
Independent | Paul Andrews | 470 | |||
UKIP | Thomas Taylor | 386 | |||
Turnout | 2,968 | 47.4 | +4.6 | ||
Conservative hold | Swing | ||||
Party | Candidate | Votes | % | ± | |
---|---|---|---|---|---|
Conservative | Paul Bartlett | uncontested | |||
Conservative hold | Swing | ||||
Party | Candidate | Votes | % | ± | |
---|---|---|---|---|---|
Conservative | Geraldine Dyer | 635 | 58.9 | -13.0 | |
Ashford Independent | Timothy Lee | 332 | 30.8 | +30.8 | |
Green | Hilary Jones | 112 | 10.4 | -2.1 | |
Majority | 303 | 28.1 | -28.2 | ||
Turnout | 1,079 | 55.8 | -4.3 | ||
Conservative hold | Swing | ||||
Party | Candidate | Votes | % | ± | |
---|---|---|---|---|---|
Ashford Independent | Peter Davison | 1,020 | |||
Conservative | Aline Hicks | 992 | |||
Conservative | John Rivers | 601 | |||
Independent | Edward Relf | 525 | |||
Independent | Hilary Moorby | 440 | |||
Liberal Democrat | Christine Stone | 226 | |||
Liberal Democrat | Ian Stone | 183 | |||
Turnout | 3,987 | 52.5 | +6.4 | ||
Independent hold | Swing | ||||
Conservative hold | Swing | ||||
Party | Candidate | Votes | % | ± | |
---|---|---|---|---|---|
Conservative | Steven Wright | 392 | 38.9 | +8.4 | |
Ashford Independent | Jack Woodford | 318 | 31.5 | -33.6 | |
Labour | Alexander Latham | 112 | 11.1 | +11.1 | |
UKIP | Mike Adams | 97 | 9.6 | +9.6 | |
Liberal Democrat | Kenneth Blanshard | 89 | 8.8 | +4.4 | |
Majority | 74 | 7.3 | |||
Turnout | 1,008 | 55.5 | +5.6 | ||
Conservative gain from Independent | Swing | ||||
The 1999 Ashford Borough Council election took place on 6 May 1999 to elect members of Ashford Borough Council in Kent, England. The whole council was up for election and the council stayed under no overall control.
The 2010 Barnet Council election took place on 6 May 2010 to elect members of Barnet London Borough Council in London, England. The whole council was up for election and the Conservative party stayed in overall control of the council.
The 2006 Harrogate Council election took place on 4 May 2006 to elect members of Harrogate Borough Council in North Yorkshire, England. One third of the council was up for election and the Conservative party lost overall control of the council to no overall control.
The 2006 Maidstone Borough Council election took place on 4 May 2006 to elect members of Maidstone Borough Council in Kent, England. One third of the council was up for election and the council stayed under no overall control.
The 2008 Maidstone Borough Council election took place on 1 May 2008 to elect members of Maidstone Borough Council in Kent, England. One third of the council was up for election and the Conservative party gained overall control of the council from no overall control.
The 2010 Maidstone Borough Council election took place on 6 May 2010 to elect members of Maidstone Borough Council in Kent, England. One third of the council was up for election and the Conservative party stayed in overall control of the council.
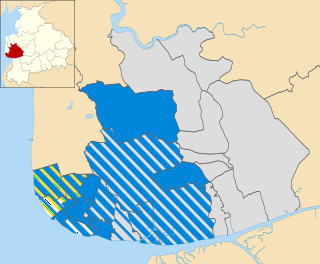
The 2011 Fylde Borough Council election took place on 5 May 2011 to elect members of Fylde Borough Council in Lancashire, England. The whole council was up for election and the Conservative party stayed in overall control of the council.
The 2010 Barrow-in-Furness Borough Council election took place on 6 May 2010 to elect members of Barrow-in-Furness Borough Council in Cumbria, England. One third of the council was up for election and the council stayed under no overall control.
The 2011 Basildon Council election took place on 5 May 2011 to elect members of Basildon Borough Council in Essex, England. One third of the council was up for election and the Conservative party stayed in overall control of the council.
The 2007 Gravesham Borough Council election took place on 3 May 2007 to elect members of Gravesham Borough Council in Kent, England. The whole council was up for election and the Conservative party gained overall control of the council from the Labour party.
The 2002 Hertsmere Borough Council election took place on 2 May 2002 to elect members of Hertsmere Borough Council in Hertfordshire, England. One third of the council was up for election and the Conservative party stayed in overall control of the council.
The 2003 Hertsmere Borough Council election took place on 1 May 2003 to elect members of Hertsmere Borough Council in Hertfordshire, England. One third of the council was up for election and the Conservative party stayed in overall control of the council.
The 2011 Wealden District Council election took place on 5 May 2011 to elect members of Wealden District Council in East Sussex, England. The whole council was up for election and the Conservative party stayed in overall control of the council.
The 2014 Weymouth and Portland Borough Council election took place on 22 May 2014 to elect members of Weymouth and Portland Borough Council in England. This was on the same day as other local elections.
The 2014 Havant Borough Council election took place on 22 May 2014 to elect members of Havant Borough Council in Hampshire, England. One third of the council was up for election and the Conservative party stayed in overall control of the council.
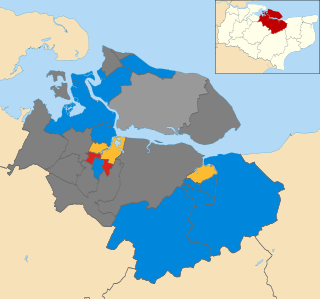
The 2008 Swale Borough Council election took place on 1 May 2008 to elect members of Swale Borough Council in Kent, England. One third of the council was up for election and the Conservative party stayed in overall control of the council.
The 2010 Swale Borough Council election took place on 6 May 2010 to elect members of Swale Borough Council in Kent, England. One third of the council was up for election and the Conservative party stayed in overall control of the council.
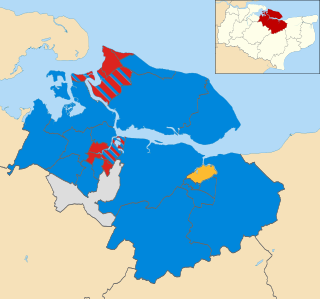
The 2011 Swale Borough Council election took place on 5 May 2011 to elect members of Swale Borough Council in Kent, England. The whole council was up for election and the Conservative party stayed in overall control of the council.
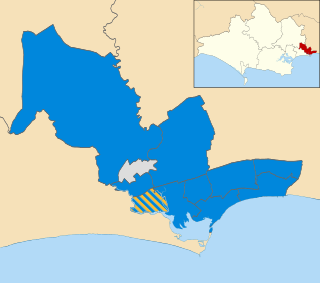
The 2011 Christchurch Borough Council election took place on 5 May 2011 to elect members of Christchurch Borough Council in Dorset, England. The whole council was up for election and the Conservative party stayed in overall control of the council.
The 2015 Christchurch Borough Council election took place on 7 May 2015 to elect members of Christchurch Borough Council in Dorset, England. The whole council was up for election and the Conservative party stayed in overall control of the council.