
Ashford is a town in the county of Kent, England. It lies on the River Great Stour at the south edge of the North Downs, about 61 miles (98 km) southeast of central London and 15.3 miles (24.6 km) northwest of Folkestone by road. In the 2011 census, it had a population of 74,204. The name comes from the Old English æscet, indicating a ford near a clump of ash trees. It has been a market town since the Middle Ages, and a regular market continues to be held.

Ashford is a town and suburb of London almost entirely in the Surrey borough of Spelthorne, but with a small part in the London Borough of Hounslow, England. Mostly residential, Ashford is 13 1⁄2 miles (22 km) WSW of Charing Cross, London, forms part of the London commuter belt, with a minor stop on the Waterloo to Reading Line and has a long commercial high street. It is centred 2 1⁄2 miles (4 km) south of London Heathrow Airport, to which a portion of its economy relates, including business premises relating to aviation and the distribution of air freight – the main cargo depot being next to an adjoining village, Stanwell.

Kent County Council is a county council that governs most of the county of Kent in England. It is the upper tier of elected local government, below which are 12 district councils, and around 300 town and parish councils. The county council has 84 elected councillors. The chief executive and chief officers are responsible for the day-to-day running of the council. Paul Carter is the leader of the council. Kent County Council is currently controlled by the Conservative Party and the official opposition is the Liberal Democrats with 7 seats. It is one of the largest local authorities in England in terms of population served and the largest local authority of its type.

Ashford is a constituency created in 1885 represented in the House of Commons of the UK Parliament since 1997 by Damian Green, a Conservative, who served as First Secretary of State between 11 June and 20 December 2017.

The headquarters of the Connecticut Rivers Council of the Boy Scouts of America is located in East Hartford, Connecticut. The present council was formed as the result of the merger between the Indian Trails Council of Norwich, Connecticut and Long Rivers Council of Hartford, Connecticut. Now it is the largest council in the state with a youth membership of over 28,000 and a volunteer base of nearly 10,000 adults, serving for over half of the state.
Ashford Borough Council in Kent, England is elected every four years. Since the last boundary changes in 2003, 43 councillors have been elected from 35 wards.
Middlesex County Council was the principal local government body in the administrative county of Middlesex from 1889 to 1965.
The 2003 West Lancashire District Council election took place on 1 May 2003 to elect members of West Lancashire District Council in Lancashire, England. One third of the council was up for election and the Conservative party stayed in overall control of the council.
The 1999 Ashford Borough Council election took place on 6 May 1999 to elect members of Ashford Borough Council in Kent, England. The whole council was up for election and the council stayed under no overall control.

Elections to Ashford Borough Council were held on 3 May 2007. The whole council was up for election and the Conservative party held on to overall control of the council.
The Kent County Council election, 2013 was an election to all 84 seats on Kent County Council held on 2 May as part of the United Kingdom local elections, 2009. 84 councillors were elected from 72 electoral divisions, which returned either one or two county councillors each by first-past-the-post voting for a four-year term of office. The electoral divisions were the same as those used at the previous election in 2005. No elections were held in Medway, which is a unitary authority outside the area covered by the County Council.
Ashford Borough Council is the local authority for the Borough of Ashford in Kent.
Spelthorne Borough Council in Surrey, England is elected every four years. Since the last boundary changes in 2003, 39 councillors are elected from 13 wards.
The 2003 Worthing Borough Council election took place on 1 May 2003 to elect members of Worthing Borough Council in West Sussex, England. One third of the council was up for election and the Liberal Democrats lost overall control of the council to no overall control. Overall turnout was 28.61%.
Michael Ashford is the Minority Whip of the Ohio House of Representatives, serving the Forty Fourth District since 2011. He represents more than 116,000 constituents in a district wholly within the city of Toledo.
The 2003 Windsor and Maidenhead Borough Council election took place on 1 May 2003 to elect members of Windsor and Maidenhead Unitary Council in Berkshire, England. The whole council was up for election with boundary changes since the last election in 2000 reducing the number of seats by 1. The Liberal Democrats gained overall control of the council from no overall control.

The 2003 Solihull Metropolitan Borough Council election took place on 1 May 2003 to elect members of Solihull Metropolitan Borough Council in the West Midlands, England.
One third of the council was up for election and the Conservative party stayed in overall control of the council.

The 2011 Ashford Borough Council election took place on 5 May 2011 to elect members of Ashford Borough Council in Kent, England. The whole council was up for election and the Conservative party stayed in overall control of the council.

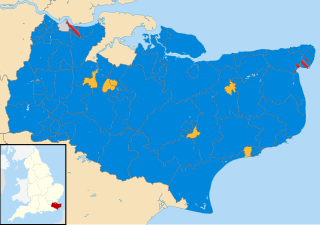
The Kent County Council election, 2013 was an election to all 84 seats on Kent County Council held on Thursday 2 May as part of the United Kingdom local elections, 2013. 84 councillors were elected from 72 electoral divisions, which returned either one or two county councillors each by first-past-the-post voting for a four-year term of office. The electoral divisions were the same as those used at the previous election in 2009. No elections were held in Medway, which is a unitary authority outside the area covered by the County Council. The election saw the Conservative Party narrowly retain overall control of the council.
The 2015 Ashford Borough Council election took place on 7 May 2015 to elect members of Ashford Borough Council in England. This was on the same day as other local elections.
