Elections to Angus Council were held on 1 May 2003, the same day as the other Scottish local government elections.
Local government in Scotland is organised through 32 unitary authorities designated as councils which consist of councillors elected every five years by registered voters in each of the council areas.
Party | Seats | Gains | Losses | Net gain/loss | Seats % | Votes % | Votes | +/− | |
---|---|---|---|---|---|---|---|---|---|
SNP | 17 | 4 | 40.4 | 16,984 | |||||
Independent | 6 | 3 | 18.9 | 7,923 | |||||
Liberal Democrats | 3 | 1 | 13.8 | 5,783 | |||||
Conservative | 2 | 12.3 | 5,173 | ||||||
Labour | 1 | 14.6 | 6,136 | ||||||
Party | Candidate | Votes | % | ± | |
---|---|---|---|---|---|
Conservative | I. Mackintosh | 1057 | 56.3 | ||
SNP | D. Robertson | 590 | 31.4 | ||
Liberal Democrats | C. Campbell | 118 | 6.3 | ||
Labour | M. L. Smith | 113 | 6.0 | ||
Majority | 467 | ||||
Turnout | 56.9 | ||||
Conservative hold | Swing | ||||
Party | Candidate | Votes | % | ± | |
---|---|---|---|---|---|
SNP | J. Henderson | 656 | 43.9 | ||
Conservative | R. J. W. Proctor | 596 | 39.9 | ||
Labour | Ms. W. N. G. Lyon | 136 | 9.1 | ||
Liberal Democrats | W. G. Watson | 106 | 7.1 | ||
Majority | 60 | ||||
Turnout | 50.9 | ||||
SNP hold | Swing | ||||
Party | Candidate | Votes | % | ± | |
---|---|---|---|---|---|
Independent | Ms. R. J. Leslie-Melville | 896 | 55.0 | ||
SNP | C. R. B. Fotheringham | 520 | 31.9 | ||
Labour | Ms. E. M. Smith | 137 | 8.4 | ||
Liberal Democrats | T. S. Simpson | 75 | 4.6 | ||
Majority | 376 | ||||
Turnout | 51.8 | ||||
Independent hold | Swing | ||||
Party | Candidate | Votes | % | ± | |
---|---|---|---|---|---|
Independent | B. Myles | 849 | 55.2 | ||
SNP | C. Harper | 500 | 32.5 | ||
Labour | Ms. C. B. Short | 117 | 7.6 | ||
Liberal Democrats | J. G. Horrocks | 72 | 4.7 | ||
Majority | 349 | ||||
Turnout | 51.0 | ||||
Independent hold | Swing | ||||
Party | Candidate | Votes | % | ± | |
---|---|---|---|---|---|
SNP | I. A. Gaul | 682 | 42.4 | ||
Conservative | A. J. Rymer | 584 | 36.3 | ||
Labour | M. A. J. Cameron | 188 | 11.7 | ||
Liberal Democrats | Ms. L. M. Casebow | 155 | 9.6 | ||
Majority | 98 | ||||
Turnout | 52.1 | ||||
SNP hold | Swing | ||||
Party | Candidate | Votes | % | ± | |
---|---|---|---|---|---|
SNP | Ms. G. H. Middleton | 600 | 42.1 | ||
Conservative | A. McM. Douglas | 311 | 21.8 | ||
Independent | E. P. Fenwick | 277 | 19.4 | ||
Labour | R. W. Milne | 159 | 11.2 | ||
Liberal Democrats | M. Jones | 79 | 5.5 | ||
Majority | 289 | ||||
Turnout | 50.0 | ||||
SNP hold | Swing | ||||
Party | Candidate | Votes | % | ± | |
---|---|---|---|---|---|
SNP | R. J. Scrimgeour | 577 | 41.0 | ||
Liberal Democrats | Ms. A. M. A> Simpson | 469 | 33.4 | ||
Conservative | J. E. Treffry | 240 | 17.1 | ||
Labour | Ms. S. Ryan | 120 | 8.5 | ||
Majority | 108 | ||||
Turnout | 48.4 | ||||
SNP hold | Swing | ||||
Party | Candidate | Votes | % | ± | |
---|---|---|---|---|---|
SNP | W. Middleton | 505 | 40.1 | ||
Independent | G. McFarlane | 377 | 30.0 | ||
Liberal Democrats | Ms. H. C. Fleming | 241 | 19.2 | ||
Labour | A. H. Hunter | 135 | 10.7 | ||
Majority | 128 | ||||
Turnout | 47.1 | ||||
SNP hold | Swing | ||||
Party | Candidate | Votes | % | ± | |
---|---|---|---|---|---|
SNP | Ms. J. M. Mowatt | 469 | 40.9 | ||
Independent | J. Milne | 446 | 38.9 | ||
Labour | Ms. M. E. Smith | 169 | 14.7 | ||
Liberal Democrats | Ms. C. A. Horrocks | 62 | 5.4 | ||
Majority | 23 | ||||
Turnout | 48.5 | ||||
SNP hold | Swing | ||||
Party | Candidate | Votes | % | ± | |
---|---|---|---|---|---|
Independent | M. S. Salmond | 654 | 51.3 | ||
SNP | S. West | 396 | 31.0 | ||
Labour | I. MacDonald | 138 | 10.8 | ||
Liberal Democrats | A. W. Warren | 88 | 6.9 | ||
Majority | 258 | ||||
Turnout | 45.9 | ||||
Independent gain from SNP | Swing | ||||
Party | Candidate | Votes | % | ± | |
---|---|---|---|---|---|
Independent | T. Wood | 486 | 39.2 | ||
SNP | W. G. Crowe | 401 | 32.3 | ||
Labour | J. Sinclair | 195 | 15.7 | ||
Liberal Democrats | Ms. F. E. Ross | 158 | 12.7 | ||
Majority | 85 | ||||
Turnout | 44.2 | ||||
Independent gain from SNP | Swing | ||||
Party | Candidate | Votes | % | ± | |
---|---|---|---|---|---|
Independent | G. Norrie | 908 | 64.2 | ||
SNP | J. Dorward | 293 | 20.7 | ||
Labour | M. D. Holehouse | 148 | 10.5 | +0.7 | |
Liberal Democrats | H. O. Will | 65 | 4.6 | ||
Majority | 615 | ||||
Turnout | 46.6 | ||||
Independent hold | Swing | ||||
Party | Candidate | Votes | % | ± | |
---|---|---|---|---|---|
SNP | Ms. K. M. Ritchie | 559 | 38.8 | -7.3 | |
Independent | Ms. K. M. Stirling | 519 | 36.0 | ||
Labour | J. L. Stewart | 259 | 18.0 | ||
Liberal Democrats | C. T. Ironside | 103 | 7.2 | -1.6 | |
Majority | 40 | ||||
Turnout | 48.9 | ||||
SNP hold | Swing | ||||
Party | Candidate | Votes | % | ± | |
---|---|---|---|---|---|
SNP | W. R. Roberton | 627 | 56.7 | ||
Liberal Democrats | I. J. V. Walker | 305 | 8.7 | +18.9 | |
Labour | E. N. Smith | 173 | 15.7 | -3.4 | |
Majority | 322 | ||||
Turnout | 47.4 | ||||
SNP hold | Swing | ||||
Party | Candidate | Votes | % | ± | |
---|---|---|---|---|---|
Conservative | D. Lumgair | 966 | 41.4 | +14.7 | |
SNP | T. L. Harvey | 456 | 26.5 | -8.0 | |
Liberal Democrats | Ms. A. S. Vann | 153 | 8.9 | -3.3 | |
Labour | R. Ross | 146 | 8.5 | -3.4 | |
Majority | 510 | ||||
Turnout | 55.3 | ||||
Conservative hold | Swing | ||||
Party | Candidate | Votes | % | ± | |
---|---|---|---|---|---|
SNP | F. Ellis | 1058 | 54.9 | ||
Conservative | F. Millar | 389 | 20.2 | ||
Labour | R. S. Bannerman | 289 | 15.0 | ||
Liberal Democrats | Ms. J. Wallace | 192 | 10.0 | ||
Majority | 669 | ||||
Turnout | 56.0 | ||||
SNP hold | Swing | ||||
Party | Candidate | Votes | % | ± | |
---|---|---|---|---|---|
SNP | Ms. H. Oswald | 1017 | 59.3 | +0.9 | |
Conservative | J. H. F. Simson | 320 | 18.6 | -8.7 | |
Labour | Ms. F. Madden | 220 | 12.8 | -1.5 | |
Majority | 697 | ||||
Turnout | 51.4 | ||||
SNP hold | Swing | ||||
Party | Candidate | Votes | % | ± | |
---|---|---|---|---|---|
SNP | S. McGlynn | 998 | 59.3 | -19.3 | |
Conservative | N. Watson | 301 | 17.9 | ||
Labour | R. Milne | 247 | 14.7 | -6.7 | |
Liberal Democrats | Ms. L. H. Warren | 138 | 8.2 | ||
Majority | 697 | ||||
Turnout | 54.0 | ||||
Party | Candidate | Votes | % | ± | |
---|---|---|---|---|---|
SNP | R. Murray | 927 | 54.9 | -6.1 | |
Independent | J. R. Whyte | 363 | 21.5 | ||
Labour | P. E. Rae | 234 | 13.9 | +0.0 | |
Liberal Democrats | Ms. M. M. McKelvie | 163 | 9.7 | ||
Majority | 564 | ||||
Turnout | 58.6 | ||||
SNP hold | Swing | ||||
Party | Candidate | Votes | % | ± | |
---|---|---|---|---|---|
SNP | J. C. Gibb | 671 | 49.4 | -23.8 | |
Labour | Ms. M. Fairgrieve | 300 | 22.1 | -4.7 | |
Independent | G. Forbes | 194 | 14.3 | ||
Conservative | D. Atkinson | 131 | 9.6 | ||
Liberal Democrats | Ms. S. M. C. Ironside | 62 | 4.6 | ||
Majority | 371 | ||||
Turnout | 46.8 | ||||
SNP hold | Swing | ||||
Party | Candidate | Votes | % | ± | |
---|---|---|---|---|---|
Labour | P. A. Murphy | 797 | 53.4 | +2.7 | |
SNP | Ms. R. Lamont | 541 | 36.3 | -13.0 | |
Liberal Democrats | J. D. Coltart | 154 | 10.3 | ||
Majority | 256 | ||||
Turnout | 54.2 | ||||
Labour hold | Swing | ||||
Party | Candidate | Votes | % | ± | |
---|---|---|---|---|---|
SNP | D. Selfridge | 943 | 59.3 | ||
Independent | Ms. J. Beattie | 252 | 15.9 | ||
Labour | A. J. Stuart | 243 | 15.3 | ||
Liberal Democrats | F. W. Cutler | 151 | 9.5 | ||
Majority | 691 | ||||
Turnout | 56.3 | ||||
SNP hold | Swing | ||||
Party | Candidate | Votes | % | ± | |
---|---|---|---|---|---|
Liberal Democrats | P. J. Nield | 731 | 55.7 | +19.0 | |
SNP | G. S. Herald | 401 | 30.6 | ||
Labour | Ms. J. Bruce | 180 | 13.7 | -0.8 | |
Majority | 330 | ||||
Turnout | 47.5 | ||||
Liberal Democrats hold | Swing | ||||
Party | Candidate | Votes | % | ± | |
---|---|---|---|---|---|
Liberal Democrats | R. B. Spiers | 563 | 37.6 | ||
SNP | I. Mutch | 391 | 29.8 | ||
Labour | D. W. Savage | 239 | 18.2 | ||
Majority | 290 | ||||
Turnout | 48.1 | ||||
Liberal Democrats hold | Swing | ||||
Party | Candidate | Votes | % | ± | |
---|---|---|---|---|---|
Liberal Democrats | Ms. J. C. Spiers | 563 | 37.6 | +12.1 | |
SNP | A. J. Gray | 517 | 34.5 | -1.1 | |
Independent | Ms. L. Hill | 240 | 16.0 | ||
Labour | Ms. C. Savage | 177 | 11.8 | -7.5 | |
Majority | 46 | ||||
Turnout | 47.8 | ||||
Liberal Democrats gain from SNP | Swing | ||||
Party | Candidate | Votes | % | ± | |
---|---|---|---|---|---|
SNP | I. J. Angus | 505 | 42.9 | ||
Independent | A. L. Wallace | 315 | 26.7 | ||
Labour | Ms. J. Mollison | 223 | 18.9 | -7.7 | |
Liberal Democrats | K. T. Barthorpe | 135 | 11.5 | -10.8 | |
Majority | 190 | ||||
Turnout | 42.5 | ||||
SNP hold | Swing | ||||
Party | Candidate | Votes | % | ± | |
---|---|---|---|---|---|
Independent | R. R. Spink | 482 | 36.0 | ||
SNP | B. M. C. Milne | 427 | 31.9 | ||
Liberal Democrats | Ms. M. B. Lingane | 219 | 16.4 | ||
Labour | D. G. M. Wardlaw | 210 | 15.7 | ||
Majority | 55 | ||||
Turnout | 47.4 | ||||
Independent gain from SNP | Swing | ||||
Party | Candidate | Votes | % | ± | |
---|---|---|---|---|---|
SNP | A. King | 336 | 27.3 | ||
Independent | D. Fairweather | 333 | 27.1 | ||
Labour | R. G. Thoms | 218 | 17.1 | ||
Conservative | P. Davies | 135 | 11.0 | ||
Independent | A. W. Shand | 131 | 10.7 | ||
Liberal Democrats | Ms. J. E. Paterson | 76 | 6.2 | ||
Majority | 3 | ||||
Turnout | 43.4 | ||||
SNP hold | Swing | ||||
Party | Candidate | Votes | % | ± | |
---|---|---|---|---|---|
SNP | Ms S. M. Welsh | 421 | 38.2 | ||
Labour | Ms. D. Milne | 226 | 20.5 | ||
Independent | I. Watson | 201 | 18.3 | ||
Conservative | D. W. Patullo | 143 | 13.0 | ||
Liberal Democrats | Ms. L. A. Barthorope | 110 | 10.0 | ||
Majority | 195 | ||||
Turnout | 41.9 | ||||
SNP hold | Swing | ||||
Aberdeen City Council represents the Aberdeen City council area of Scotland.
Renfrewshire ; is one of 32 council areas of Scotland. Located in the west central Lowlands, it is one of three council areas contained within the boundaries of the historic county of Renfrewshire, the others being East Renfrewshire to the east and Inverclyde to the west. It also shares borders with Glasgow, North Ayrshire and West Dunbartonshire, and lies on The southern bank of The River Clyde. The term Renfrewshire may also be used to refer to this historic county, also known as the County of Renfrew or Greater Renfrewshire, which remains in use as a registration county and lieutenancy area.
Local elections took place in various parts of the United Kingdom on 1 May 2003, the same day as the Scottish Parliamentary and the Welsh Assembly elections. There were local elections for all councils in Scotland and in most of England. There were no elections in Wales, Northern Ireland or London.
Mid Scotland and Fife is one of the eight electoral regions of the Scottish Parliament which were created in 1999. Nine of the parliament's 73 first past the post constituencies are sub-divisions of the region and it elects seven of the 56 additional-member Members of the Scottish Parliament (MSPs). Thus it elects a total of 16 MSPs.
Ayr, Carrick, and Cumnock is a county constituency represented in the House of Commons of the Parliament of the United Kingdom. It was created for the 2005 general election from parts of the old Ayr and Carrick, Cumnock and Doon Valley constituencies. It has been represented since 2017 by Bill Grant of the Scottish Conservative Party.
The 2007 UK local government elections were held on 3 May 2007. These elections took place in most of England and all of Scotland. There were no local government elections in Wales though the Welsh Assembly had a general election on the same day. There were no local government elections in Northern Ireland. Just over half of English councils and almost all the Scottish councils began the counts on Friday, rather than Thursday night, because of more complex arrangements regarding postal votes.
The 2003 Tunbridge Wells Borough Council election took place on 1 May 2003 to elect members of Tunbridge Wells Borough Council in Kent, England. One third of the council was up for election and the Conservative party stayed in overall control of the council.
The 2003 Southend-on-Sea Council election took place on 1 May 2003 to elect members of Southend-on-Sea Unitary Council in Essex, England. One third of the council was up for election and the Conservative party stayed in overall control of the council.
The Scottish local elections, 2003 were held on 1 May 2003, the same day as Scottish Parliament elections and local elections in parts of England. All 32 Scottish councils had all their seats up for election – all Scottish councils are unitary authorities.
The 2003 Milton Keynes Council election took place on 1 May 2003 to elect members of Milton Keynes Unitary Council in Buckinghamshire, England. One third of the council was up for election and the Liberal Democrats stayed in overall control of the council.
Elections to East Ayrshire Council were held on 1 May 2003, alongside elections to the Scottish Parliament. All 32 seats were up and this was the final election to the council using first past the post. The Scottish Labour Party maintained a large majority.
Elections to Dundee City Council were held on 1 May 2003, the same day as the other Scottish local government elections and the Scottish Parliament general election.
Elections to South Ayrshire Council area were held on 1 May 2003, alongside elections to the Scottish Parliament. All 30 seats were up and this was the final election to the council using First Past the Post. Whilst the Scottish Conservative Party were able to achieve more votes than any other party in the council area, they only received 15 seats - no majority administration was formed with the Scottish Labour Party also holding 15 council seats.
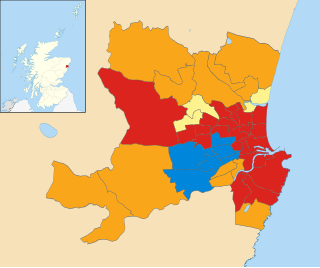
The 1999 Aberdeen City Council election took place on 6 May 1999 to elect members of Aberdeen City Council. This election was held on the same day as other Scottish local government elections and the first Scottish Parliament Election.
The 2003 elections to Argyll and Bute Council were held on the 1 May 2003 and were the third for the unitary authority, which was created under the Local Government etc (Scotland) Act 1994 and replaced the previous two-tier system of local government under Strathclyde Regional Council and Dumbarton and Argyll & Bute District Councils. It was held on the same day as the second Scottish Parliament election and resulted in no change to the administration of the council - independent control. These were the last elections to the council using the first past the post electoral system.
Elections to Midlothian Council were held on 1 May 2003, the same day as the other Scottish local government elections and the Scottish Parliament general election. The election was the last one using the 18 single-member wards using the plurality system of election.
Elections to Renfrewshire Council were held on 1 May 2003, the same day as the other Scottish local government elections and the Scottish Parliament general election. The election was the last one using the 40 single-member wards using the plurality system of election.
Elections to the Moray Council were held on 1 May 2003, the same day as the other Scottish local government elections and the Scottish Parliament general election.
Elections to Inverclyde Council were held on 1 May 2003, the same day as other Scottish Local Government elections and the Scottish Parliament Election.
Elections to Perth and Kinross Council were held on 1 May 2003, the same day as other Scottish Local Government elections and the Scottish Parliament Election.