Elections to Angus Council were held on 6 May 1999, the same day as the other Scottish local government elections.
Local government in Scotland is organised through 32 unitary authorities designated as councils which consist of councillors elected every five years by registered voters in each of the council areas.
Party | Seats | Gains | Losses | Net gain/loss | Seats % | Votes % | Votes | +/− | |
---|---|---|---|---|---|---|---|---|---|
SNP | 21 | 1 | 46.53 | 22,742 | -5.6% | ||||
Labour | 1 | 1 | 18.28 | 8,934 | +3.2% | ||||
Conservative | 2 | 1 | -1 | 17.95 | 8,773 | -0.2% | |||
Liberal Democrats | 2 | 1 | +1 | 8.89 | 4,346 | +1.7% | |||
Brechin Independent Group | 2 | 2 | 0 | +2 | 5.01 | 2,451 | +5.0% | ||
Independent | 1 | 3.23 | 1,577 | -4.5% | |||||
Scottish Socialist | 0 | 0.11 | 52 | +0.1% | |||||
Party | Candidate | Votes | % | ± | |
---|---|---|---|---|---|
Conservative | I. Mackintosh | 973 | 47.6 | ||
SNP | K. A. Gowans | 786 | 38.5 | ||
Labour | D. F. Begg | 284 | 13.9 | ||
Majority | 187 | ||||
Turnout | 2043 | 64.5 | |||
Conservative hold | Swing | ||||
Party | Candidate | Votes | % | ± | |
---|---|---|---|---|---|
SNP | J. Henderson | 834 | 47.1 | ||
Conservative | Ms. S. M. Bradford | 681 | 38.5 | ||
Labour | Ms. C. B. Short | 256 | 14.5 | ||
Majority | 153 | ||||
Turnout | 1762 | 56.4 | |||
SNP hold | Swing | ||||
Party | Candidate | Votes | % | ± | |
---|---|---|---|---|---|
Independent | Ms. R. J. Leslie-Melville | 1023 | 52.2 | ||
SNP | G. P. Allan | 672 | 34.3 | ||
Labour | Ms. C. McIlroy | 263 | 13.4 | ||
Majority | 351 | ||||
Turnout | 1945 | 59.7 | |||
Independent gain from SNP | Swing | ||||
Party | Candidate | Votes | % | ± | |
---|---|---|---|---|---|
Independent | R. J. Myles | 933 | 51.8 | ||
SNP | S. N. Mowatt | 585 | 32.5 | ||
Labour | D. K. Todd | 283 | 15.7 | ||
Majority | 348 | ||||
Turnout | 1782 | 56.4 | |||
Independent gain from SNP | Swing | ||||
Party | Candidate | Votes | % | ± | |
---|---|---|---|---|---|
SNP | F. E. Duncan | 867 | 46.5 | ||
Conservative | A. J. Rymer | 717 | 38.4 | ||
Labour | J. A. C. Caution | 281 | 15.1 | ||
Majority | 150 | ||||
Turnout | 1851 | 59.1 | |||
SNP hold | Swing | ||||
Party | Candidate | Votes | % | ± | |
---|---|---|---|---|---|
SNP | Ms. G. H. Middleton | 995 | 61.8 | ||
Conservative | C. J. R. Dickens | 616 | 38.2 | ||
Majority | 379 | ||||
Turnout | 1588 | 54.5 | |||
SNP hold | Swing | ||||
Party | Candidate | Votes | % | ± | |
---|---|---|---|---|---|
SNP | S. Leslie | 757 | 46.7 | ||
Conservative | A. A. A. Cochrane-Dyet | 544 | 33.6 | ||
Labour | Ms. R. H. Lowe | 319 | 19.7 | ||
Majority | 213 | ||||
Turnout | 55.1 | ||||
SNP hold | Swing | ||||
Party | Candidate | Votes | % | ± | |
---|---|---|---|---|---|
SNP | W. Middleton | 927 | 65.3 | ||
Liberal Democrats | Ms. H. C. Fleming | 492 | 34.7 | ||
Majority | 435 | ||||
Turnout | 1397 | 49.8 | |||
SNP hold | Swing | ||||
Party | Candidate | Votes | % | ± | |
---|---|---|---|---|---|
SNP | Ms. J. M. Mowatt | 535 | 41.4 | ||
Independent | R. J. G. Malcolm | 495 | 38.3 | ||
Labour | R. K. Gittins | 263 | 20.3 | ||
Majority | 40 | ||||
Turnout | 1282 | 47.9 | |||
SNP hold | Swing | ||||
Party | Candidate | Votes | % | ± | |
---|---|---|---|---|---|
SNP | W. A. West | 656 | 42.7 | ||
Conservative | M. S. Salmond | 469 | 30.5 | ||
Labour | J. Sinclair | 284 | 18.5 | ||
Liberal Democrats | Ms R. Stevens | 129 | 8.4 | ||
Majority | 187 | ||||
Turnout | 1534 | 50.1 | |||
SNP hold | Swing | ||||
Party | Candidate | Votes | % | ± | |
---|---|---|---|---|---|
SNP | W. G. Crowe | 499 | 33.1 | ||
Labour | R. Gilbert | 367 | 24.3 | ||
Conservative | J. A. Sutcliffe | 253 | 16.8 | ||
Independent | F. G. Stephen | 226 | 15.0 | ||
Liberal Democrats | P. J. Stevens | 163 | 10.8 | ||
Majority | 132 | ||||
Turnout | 1504 | 51.0 | -8.3 | ||
SNP hold | Swing | ||||
Party | Candidate | Votes | % | ± | |
---|---|---|---|---|---|
Independent | G. Norrie | 1108 | 64.9 | ||
SNP | J. Dorward | 433 | 25.4 | ||
Labour | M. D. Holehouse | 167 | 9.8 | ||
Majority | 675 | ||||
Turnout | 1697 | 54.5 | |||
Independent hold | Swing | ||||
Party | Candidate | Votes | % | ± | |
---|---|---|---|---|---|
SNP | Ms. K. M. Ritchie | 742 | 46.1 | ||
Labour | F. Wood | 422 | 26.2 | ||
Conservative | P. Davies | 305 | 18.9 | ||
Liberal Democrats | C. T. Ironside | 141 | 8.8 | ||
Majority | 320 | ||||
Turnout | 1606 | 55.0 | |||
SNP hold | Swing | ||||
Party | Candidate | Votes | % | ± | |
---|---|---|---|---|---|
SNP | W. R. Roberton | 684 | 49.8 | ||
Conservative | Ms. N. J. Rymer | 307 | 22.4 | ||
Labour | Ms. A. Dixon | 262 | 19.1 | ||
Liberal Democrats | Ms. L. M. Casebow | 120 | 8.7 | ||
Majority | 377 | ||||
Turnout | 1427 | 55.8 | |||
SNP hold | Swing | ||||
Party | Candidate | Votes | % | ± | |
---|---|---|---|---|---|
Conservative | D. Lumgair | 765 | 41.4 | ||
SNP | Ms. H. M. W. Angus | 638 | 34.5 | ||
Liberal Democrats | Ms. A. M. A. Simpson | 226 | 12.2 | ||
Labour | I. Davidson | 219 | 11.9 | ||
Majority | 127 | ||||
Turnout | 1840 | 60.1 | |||
Conservative gain from SNP | Swing | ||||
Party | Candidate | Votes | % | ± | |
---|---|---|---|---|---|
SNP | F. Ellis | 1018 | 51.0 | ||
Conservative | T. I. N. Young | 641 | 32.1 | ||
Labour | R. S. Bannerman | 337 | 16.9 | ||
Majority | 377 | ||||
Turnout | 1984 | 64.3 | |||
SNP gain from Conservative | Swing | ||||
Party | Candidate | Votes | % | ± | |
---|---|---|---|---|---|
SNP | Ms. C. C. C. Ellis | 1102 | 58.4 | ||
Conservative | K. M. U. Nicoll | 515 | 27.3 | ||
Labour | Ms. F. Madden | 270 | 14.3 | - | |
Majority | 587 | ||||
Turnout | 1880 | 59.5 | |||
SNP hold | Swing | ||||
Party | Candidate | Votes | % | ± | |
---|---|---|---|---|---|
SNP | H. S. McGlynn | 1529 | 78.6 | ||
Labour | P. Grimes | 417 | 21.4 | ||
Majority | 1112 | ||||
Turnout | 1911 | 61.6 | |||
Party | Candidate | Votes | % | ± | |
---|---|---|---|---|---|
SNP | R. J. Murray | 1150 | 61.0 | ||
Conservative | S. D. Ramsay | 473 | 25.1 | ||
Labour | P. E. Rae | 263 | 13.9 | ||
Majority | 677 | ||||
Turnout | 1880 | 65.1 | |||
SNP hold | Swing | ||||
Party | Candidate | Votes | % | ± | |
---|---|---|---|---|---|
SNP | J. C. Gibb | 1197 | 73.2 | ||
Labour | A. J. Stuart | 438 | 26.8 | ||
Majority | 759 | ||||
Turnout | 1590 | 52.7 | |||
SNP hold | Swing | ||||
Party | Candidate | Votes | % | ± | |
---|---|---|---|---|---|
Labour | P. A. Murphy | 893 | 50.7 | ||
SNP | Ms. H. Oswald | 868 | 49.3 | ||
Majority | 25 | ||||
Turnout | 1703 | 58.6 | |||
Labour gain from SNP | Swing | ||||
Party | Candidate | Votes | % | ± | |
---|---|---|---|---|---|
SNP | D. Selfridge | 1104 | 57.9 | ||
Conservative | A. J. Dobie | 491 | 25.7 | ||
Labour | Ms. G. Pallis | 313 | 16.4 | ||
Majority | 613 | ||||
Turnout | 1903 | 65.2 | |||
SNP hold | Swing | ||||
Party | Candidate | Votes | % | ± | |
---|---|---|---|---|---|
Liberal Democrats | P. Nield | 625 | 36.7 | ||
SNP | A. W. Shand | 453 | 26.6 | ||
Conservative | S. Tucker | 378 | 22.2 | ||
Labour | Ms. J. Bruce | 246 | 14.5 | ||
Majority | 172 | ||||
Turnout | 1701 | 58.4 | |||
Liberal Democrats gain from SNP | Swing | ||||
Party | Candidate | Votes | % | ± | |
---|---|---|---|---|---|
Liberal Democrats | R. B. Spiers | 751 | 43.4 | ||
SNP | R. F. Swan | 478 | 27.6 | ||
Labour | Ms. C. Savage | 257 | 14.9 | ||
Independent | A. McKinnon | 243 | 14.1 | ||
Majority | 273 | ||||
Turnout | 1718 | 58.3 | |||
Liberal Democrats hold | Swing | ||||
Party | Candidate | Votes | % | ± | |
---|---|---|---|---|---|
SNP | A. J. Gray | 574 | 35.6 | ||
Liberal Democrats | Ms. M. M. McKelvie | 411 | 25.5 | ||
Conservative | R. A. G. Stuart | 316 | 19.6 | ||
Labour | E. Gerrard | 311 | 19.3 | ||
Majority | 163 | ||||
Turnout | 1608 | 55.3 | |||
SNP hold | Swing | ||||
Party | Candidate | Votes | % | ± | |
---|---|---|---|---|---|
SNP | I. J. Angus | 702 | 47.6 | ||
Labour | Ms. J. Warren | 392 | 26.6 | ||
Liberal Democrats | J. G. Paterson | 328 | 22.3 | ||
Scottish Socialist | Ms. M. M. Braid | 52 | 3.5 | ||
Majority | 310 | ||||
Turnout | 1462 | 51.9 | |||
SNP hold | Swing | ||||
Party | Candidate | Votes | % | ± | |
---|---|---|---|---|---|
SNP | B. M. C. Milne | 690 | 42.9 | ||
Liberal Democrats | Ms. J. E. Paterson | 464 | 28.8 | ||
Labour | D. W. Savage | 455 | 28.3 | ||
Majority | 226 | ||||
Turnout | 1594 | 54.3 | |||
SNP hold | Swing | ||||
Party | Candidate | Votes | % | ± | |
---|---|---|---|---|---|
SNP | A. King | 528 | 37.2 | ||
Labour | R. G. Thoms | 341 | 24.0 | ||
Conservative | N. P. Spiers | 328 | 23.1 | ||
Liberal Democrats | H. O. Will | 223 | 15.7 | ||
Majority | 187 | ||||
Turnout | 1413 | 47.0 | |||
SNP hold | Swing | ||||
Party | Candidate | Votes | % | ± | |
---|---|---|---|---|---|
SNP | Ms S. M. Welsh | 739 | 55.0 | ||
Labour | Ms. D. Milne | 331 | 24.6 | ||
Liberal Democrats | Ms. A. S. Vann | 273 | 20.3 | ||
Majority | 408 | ||||
Turnout | 1329 | 48.0 | |||
SNP hold | Swing | ||||
Scotland is a country which is currently in a political union with the rest of the United Kingdom. Having been directly governed by the UK Government since 1707, a system of devolution was established in 1999, after the Scottish people voted by a firm majority to re-establish a primary law making Scottish Parliament in a referendum held in 1997.
The Highlands and Islands is one of the eight electoral regions of the Scottish Parliament which were created in 1999. Eight of the parliament's first past the post constituencies are sub-divisions of the region and it elects seven of the 56 additional-member Members of the Scottish Parliament (MSPs).
South of Scotland was one of the eight electoral regions of the Scottish Parliament when it was created in 1999. The region was replaced with South Scotland in 2011 following a review.
Mid Scotland and Fife is one of the eight electoral regions of the Scottish Parliament which were created in 1999. Nine of the parliament's 73 first past the post constituencies are sub-divisions of the region and it elects seven of the 56 additional-member Members of the Scottish Parliament (MSPs). Thus it elects a total of 16 MSPs.
In the United Kingdom (UK), each of the electoral areas or divisions called constituencies elect one member to a parliament or assembly, with the exception of European Parliament and Northern Ireland Assembly constituencies which are multi member constituencies.
Scotland constitutes a single constituency of the European Parliament. In 2014 it elected six MEPs, using the d'Hondt method of party-list proportional representation.
Local elections took place in much of the United Kingdom on 6 May 1999. All Scottish and Welsh unitary authorities had all their seats elected. In England a third of the seats on each of the Metropolitan Boroughs were elected along with elections in many of the unitary authorities and district councils. There were no local elections in Northern Ireland.
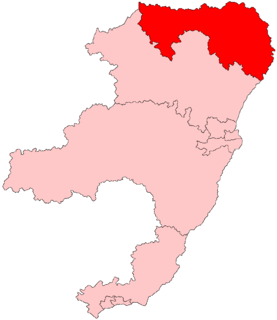
Banff and Buchan was a constituency of the Scottish Parliament (Holyrood) between 1999 and 2011 when it was substantially succeeded by Banffshire and Buchan Coast. It elected one Member of the Scottish Parliament (MSP) by the first past the post method of election. Also, however, it was one of nine constituencies in the North East Scotland electoral region, which elects seven additional members, in addition to nine constituency MSPs, to produce a form of proportional representation for the region as a whole.
Central Scotland is one of the eight electoral regions of the Scottish Parliament which were created in 1999. Nine of the parliament's 73 first past the post constituencies are sub-divisions of the region and it elects seven of the 56 additional-member Members of the Scottish Parliament (MSPs). Thus it elects a total of 16 MSPs.
Shetland is a constituency of the Scottish Parliament (Holyrood). It elects one Member of the Scottish Parliament (MSP) by the first past the post method of election. Also, however, it is one of eight constituencies in the Highlands and Islands electoral region, which elects seven additional members, in addition to eight constituency MSPs, to produce a form of proportional representation for the region as a whole.
The 1999 Fylde Borough Council election took place on 6 May 1999 to elect member of Fylde District Council in Lancashire, England. The whole council was up for election and the council stayed under no overall control.
The 1999 Arun District Council election took place on 6 May 1999 to elect members of Arun District Council in West Sussex, England. The whole council was up for election and the Conservative Party held overall control of the council.
Derek Mackay is a Scottish National Party politician serving as Finance Secretary of Scotland since 2016, and has served as Member of the Scottish Parliament for Renfrewshire North and West since 2011. Mackay served as Minister for Transport and Islands in the Sturgeon Government, and Minister for Local Government and Planning and Salmond Government.
The 1999 elections to Argyll and Bute Council were held on the 6 May 1999 and were the second for the unitary authority, which was created under the Local Government etc (Scotland) Act 1994 and replaced the previous two-tier system of local government under Strathclyde Regional Council and Dumbarton and Argyll & Bute District Councils. It was held on the same day as the first Scottish Parliament election and resulted in no change to the administration of the council - independent control.
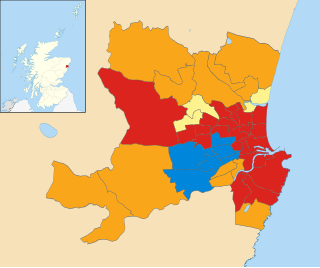
The 1999 Aberdeen City Council election took place on 6 May 1999 to elect members of Aberdeen City Council. This election was held on the same day as other Scottish local government elections and the first Scottish Parliament Election.
An election to Comhairle nan Eilean Siar was held on 6 May 1999 as part of the wider 1999 Scottish local elections.
Elections to Inverclyde Council were held on 1 May 2003, the same day as other Scottish Local Government elections and the Scottish Parliament Election.
Elections to Inverclyde Council were held on 6 May 1999, the same day as other Scottish Local Government elections and the first Scottish Parliament Election.
Elections to Aberdeenshire Council were held on 6 May 1999; the same day as elections to the Scottish Parliament and to the 31 other Scottish local authorities. 68 councillors were elected from 68 wards using First Past The Post (FPTP). This election was conducted under boundary changes with an increased number of seats from the 47 used in the 1995 election. The Liberal Democrats were the largest party, with councillors also being elected representing the SNP, Independents, and Conservatives.
Elections to Perth and Kinross Council were held on 1 May 2003, the same day as other Scottish Local Government elections and the Scottish Parliament Election.