West Wiltshire District Council election, 1999

Last updated

Elections to West Wiltshire District Council were held on 6 May 1999. The whole council was up for election and the Liberal Democrats held their overall control, winning twenty-seven seats while the Conservatives took ten, Independents four and the Labour Party two.

West Wiltshire

West Wiltshire was a local government district in Wiltshire, England, formed on 1 April 1974, further to the Local Government Act 1972, as a merger of the former urban districts of Bradford-on-Avon, Melksham, Trowbridge, Warminster and Westbury, along with Bradford and Melksham Rural District and the Warminster and Westbury Rural District.

Liberal Democrats (UK) Political party in the United Kingdom

The Liberal Democrats are a liberal political party in the United Kingdom. It is currently led by Vince Cable. They have 11 Members of Parliament in the House of Commons, 96 members of the House of Lords, one member of the European Parliament, five Members of the Scottish Parliament and one member in the Welsh Assembly and London Assembly. At the height of its influence, the party formed a coalition government with the Conservative Party from 2010 to 2015 with its leader Nick Clegg serving as Deputy Prime Minister.

Conservative Party (UK) Political party in the United Kingdom

The Conservative Party, officially the Conservative and Unionist Party, is a centre-right political party in the United Kingdom. The governing party since 2010, it is the largest in the House of Commons, with 313 Members of Parliament, and also has 249 members of the House of Lords, 18 members of the European Parliament, 31 Members of the Scottish Parliament, 12 members of the Welsh Assembly, eight members of the London Assembly and 8,916 local councillors.

Contents

Three single-member wards, Ethandune, Melksham Roundpond, and Westbrook, had only one candidate in each case and thus were uncontested.

Results

West Wiltshire Local Election Result 1999
PartySeatsGainsLossesNet gain/lossSeats %Votes %Votes+/−
  Liberal Democrat 27 1 4 -3 62.8 47.9 20,890 -3
  Conservative 10 5 1 +4 23.3 35.6 15,520 +4
  Independent 4 0 0 0 9.3 6.3 2,768 0
  Labour 2 0 -1 -1 4.7 5.2 2,290 -1
  Green 0 0 0 0 0 4.9 2,149 0

Ward results


Blackmore Forest

Blackmore Forest
PartyCandidateVotes%±
Liberal Democrat Nicola Mary Remsik 342
Conservative Andrew George Milton 340
Labour Geoffrey Alan Mitcham 211
Majority 2
Turnout 25.4
Liberal Democrat hold Swing

Bradford-on-Avon North

Bradford-on-Avon North (2)
PartyCandidateVotes%±
Liberal Democrat Janet Lindsay Repton 685
Liberal Democrat Sophie Farkas 677
Conservative David James Blagden 315
Conservative Simon John Birkett 302
Green John Richard Pearce 181
Majority 362
Turnout 38.55
Liberal Democrat hold Swing


Bradford-on-Avon South

Bradford-on-Avon South (2)
PartyCandidateVotes%±
Liberal Democrat Minna Winifred Gillham 955
Liberal Democrat Frances Lewis 819
Conservative Baldev Singh Jathoul 411
Green Vivien Jennifer Talbot 313
Majority 408
Turnout 41.03
Liberal Democrat hold Swing


Corsley

Corsley
PartyCandidateVotes%±
Independent Leonard Frank Osborn 433
Liberal Democrat John Vladimir Landell Mills 77
Majority 356
Turnout 40.49
Independent hold Swing


Dilton Marsh

Dilton Marsh
PartyCandidateVotes%±
Liberal Democrat Alison Mary Irving 338
Green Kevan James Corcoran 158
Majority 180
Turnout 35.02
Liberal Democrat hold Swing

Ethandune

Ethandune
PartyCandidateVotes%±
Independent Michael Elwyn Jones
Majority Uncontested
Independent hold Swing


Holt

Holt
PartyCandidateVotes%±
Liberal Democrat Anthony John Hunter 448
Conservative Gerald Clive Burnan 411
Green Lex Hepenstall 62
Majority 37
Turnout 41.90
Liberal Democrat hold Swing


Manor Vale

Manor Vale (2)
PartyCandidateVotes%±
Conservative William Campbell Viles 624
Liberal Democrat Judith Cunliffe-Jones 597
Conservative Marion Joyce Davis 549
Liberal Democrat Malcolm George Hewson 417
Green Matthew William Griffith 223
Majority 48
Turnout 38.91
Conservative hold Swing
Liberal Democrat hold Swing

Melksham Forest

Melksham Forest
PartyCandidateVotes%±
Labour Sarah Patricia Cardy 389
Liberal Democrat Victoria Christine Scott Landell Mills 91
Majority 298
Turnout 31.75
Labour hold Swing

Melksham Lambourne

Melksham Lambourne
PartyCandidateVotes%±
Labour Davina Margaret Griffin 299
Liberal Democrat Colin Norman Harrison 160
Majority 139
Turnout 28.20
Labour hold Swing

Melksham Roundpond

Melksham Roundpond
PartyCandidateVotes%±
Liberal Democrat Angela Betty Barker
Majority Uncontested
Liberal Democrat hold Swing


Melksham Town

Melksham Town
PartyCandidateVotes%±
Conservative Brian Stanley Mudge 376
Labour Mavis Elcock 344
Liberal Democrat Adrienne Margaret Westbrook 286
Majority 32
Turnout 28.96
Conservative gain from Labour Swing


Melksham Woodrow

Melksham Woodrow
PartyCandidateVotes%±
Liberal Democrat Nicholas Shawne Edney Westbrook 345
Labour Marcus Aurelius 267
Majority 78
Turnout 31.10
Liberal Democrat hold Swing


Mid Wylye Valley

Mid Wylye Valley
PartyCandidateVotes%±
Independent Christopher Newbury 295
Conservative Patrick Andrew Sturges 286
Liberal Democrat Simon Rowland Fisher 52
Majority 9
Turnout 48.58
Independent hold Swing


Paxcroft

Paxcroft
PartyCandidateVotes%±
Liberal Democrat Trevor William Carbin 634
Conservative June Edith Dallimore 342
Majority 292
Turnout 38.32
Liberal Democrat hold Swing

Shearwater

Shearwater
PartyCandidateVotes%±
Conservative Michael Burke Mounde 242
Liberal Democrat Gregory James Doyle 225
Majority 17
Turnout 39.25
Conservative gain from Liberal Democrat Swing


Summerham

Summerham
PartyCandidateVotes%±
Liberal Democrat Adrian George Fox 701
Conservative Roy Leslie Sloper 357
Majority 344
Turnout 49.77
Liberal Democrat hold Swing


Trowbridge Adcroft

Trowbridge Adcroft (2)
PartyCandidateVotes%±
Liberal Democrat Nicholas Blakemore 346
Liberal Democrat Thomas Raymond James 324
Conservative James Martin Haddon Alsop 145
Green Richard Douglas Mills 102
Majority 179
Turnout 23.32
Liberal Democrat hold Swing


Trowbridge College

Trowbridge College (2)
PartyCandidateVotes%±
Liberal Democrat Grace Hill 496
Liberal Democrat Jeffrey Bryan Osborn 382
Conservative James Oliver Powell 245
Conservative Darren James Earley 242
Labour Hazel Marie Sargent 223
Green Nigel John Pratt 99
Majority 137
Turnout 25.63
Liberal Democrat hold Swing


Trowbridge Drynham

Trowbridge Drynham (2)
PartyCandidateVotes%±
Liberal Democrat Marcus Alexander Francis 480
Conservative Graham David Payne 407
Liberal Democrat Helen Bridget Osborn 368
Conservative Anthony John Christopher Pearce 297
Green Jean Ham 90
Majority 39
Turnout 23.28
Liberal Democrat hold Swing
Conservative hold Swing

Trowbridge John of Gaunt

Trowbridge John of Gaunt (2)
PartyCandidateVotes%±
Liberal Democrat Robert John Brice 503
Liberal Democrat Joan Mary Stacey 498
Conservative John Roland Wallace Knight 364
Conservative Richard Adrian Knight 356
Labour Andrew John Hungerford 248
Green David Entwistle 155
Majority 134
Turnout 25.12
Liberal Democrat hold Swing

Trowbridge Park

Trowbridge Park (2)
PartyCandidateVotes%±
Liberal Democrat Stephen John Oldrieve 492
Conservative Peter Fuller 492
Liberal Democrat Andrew James Bryant 491
Conservative Anthony Ivan Moore 440
Green Robert Gledhill 191
Majority 1
Turnout 29.10
Liberal Democrat hold Swing
Conservative gain from Liberal Democrat Swing


Warminster East

Warminster East (3)
PartyCandidateVotes%±
Conservative Christopher March 956
Conservative Andrew Davis 919
Conservative Kay Carol Whatley-Gibbs 902
Liberal Democrat Mark Houghton Brown 569
Liberal Democrat Edward Raymond Beaty 569
Liberal Democrat Peter John Williams 507
Green Roland Peter Noyce 282
Majority 333
Turnout 32.80
Conservative hold Swing


Warminster West

Warminster West (3)
PartyCandidateVotes%±
Liberal Democrat John Edward Syme 976
Liberal Democrat Catherine Jane Day 915
Liberal Democrat David John Lovell 882
Conservative Martin John Baker 829
Conservative Anthony Robert Nixon Jackson 817
Conservative Anthony James Nicklin 568
Majority 53
Turnout 28.82
Liberal Democrat hold Swing


Weavers

Weavers (2)
PartyCandidateVotes%±
Independent Anthony Guy Phillips 851
Liberal Democrat Horace John Prickett 604
Conservative Aubrey Harold Austin 551
Liberal Democrat Richard George Crofts 343
Green Kathryn Jennifer Toyne 176
Majority 53
Turnout 39.76
Independent hold Swing
Liberal Democrat gain from Conservative Swing

Westbrook

Westbrook
PartyCandidateVotes%±
Liberal Democrat Terrence Peter Chivers
Majority Uncontested
Liberal Democrat hold Swing


Westbury with Storridge

Westbury with Storridge (3)
PartyCandidateVotes%±
Liberal Democrat John David Annetts 1,237
Liberal Democrat Gordon Ian King 1,139
Conservative Marion Clegg 875
Labour Elisha Manasseh 787
Liberal Democrat Sally Scott-White 786
Conservative David George Lux 655
Conservative William Scott Shiel Braid 636
Independent William Thomas Miller 437
Green James Oliver Toyne 258
Majority 88
Turnout 34.51
Liberal Democrat hold Swing
Conservative gain from Liberal Democrat Swing

Wylye Valley

Wylye Valley
PartyCandidateVotes%±
Conservative William Daniel Hurd 269
Liberal Democrat Carleton Arden Hulme Beaman 134
Independent Francis Morland 133
Majority 135
Turnout 42.06
Conservative hold Swing

Related Research Articles

Wiltshire County of England

Wiltshire is a county in South West England with an area of 3,485 km2. It is landlocked and borders the counties of Dorset, Somerset, Hampshire, Gloucestershire, Oxfordshire and Berkshire. The county town was originally Wilton, after which the county is named, but Wiltshire Council is now based in the county town of Trowbridge.

Borough of Swindon Place in England

The Borough of Swindon is a local government authority in South West England. It is centred on the town of Swindon and forms part of the ceremonial county of Wiltshire. It was formed in 1974 as the Thamesdown district of Wiltshire, from former areas of the municipal borough of Swindon and Highworth Rural District.

Wiltshire County Council

Wiltshire County Council was the county council of Wiltshire in the South West of England, an elected local Government body responsible for most local government services in the county.

North Wiltshire was a non-metropolitan district in Wiltshire, England. It was abolished on 1 April 2009 and replaced by Wiltshire Council.

West Wiltshire was a non-metropolitan district in Wiltshire, England. It was abolished on 1 April 2009 and replaced by Wiltshire Council.

Elections to West Wiltshire District Council were held on 3 May 2007. The whole council was up for election and the Conservatives took control.

Elections to West Wiltshire District Council were held on 1 May 2003. The whole council was up for election and the Liberal Democrats lost their majority, leaving the council with no overall control.

As a result of the 2009 structural changes to local government in England, the former Wiltshire County Council and the four districts within its geographical area were replaced by the new Wiltshire Council, which is a unitary authority covering the same area, with elections continuing to be held every four years, beginning in June 2009. Previously, Wiltshire County Council had been elected between 1889 and 2005, initially every three years, later every four years.

Wiltshire Council British administrative body

Wiltshire Council is a council for the unitary authority of Wiltshire in South West England, created in 2009. It is the successor authority to Wiltshire County Council (1889–2009) and the four district councils of Kennet, North Wiltshire, Salisbury, and West Wiltshire, all of which were created in 1974 and abolished in 2009.

Kennet was a non-metropolitan district in Wiltshire, England. It was abolished on 1 April 2009 and replaced by Wiltshire Council.

2009 Wiltshire Council election

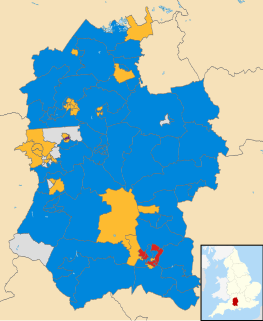
Elections to Wiltshire Council, a new unitary authority, were held on 4 June 2009.

Swindon is a unitary authority in Wiltshire, England. Until 1 April 1998 its area was a non-metropolitan district called Thamesdown Borough Council, with Wiltshire County Council providing the county-level services. In 1998 all such powers were transferred to the new Borough of Swindon.

The Devizes Guardians are a local political party based in Devizes, Wiltshire, England. The party was formed in 2001 and has been successful in winning seats on Kennet District Council and Wiltshire Council, but at present is represented only on Devizes Town Council, which from May 2013 it controls.

2013 Wiltshire Council election

Elections to the Wiltshire Council unitary authority took place on 2 May 2013. All ninety-eight seats were up for election, with each councillor being elected in a single-member electoral division, although in six of the divisions only one candidate was nominated and was thus declared the winner without elections taking place.

Elections to Kennet District Council were held on 3 May 2007. The whole council was up for election, and the Conservatives comfortably retained control, winning thirty-three of the forty-three seats available.

The 1999 Wychavon District Council election took place on 6 May 1999 to elect members of Wychavon District Council in Worcestershire, England. The whole council was up for election and the Conservative party gained overall control of the council from no overall control.

Salisbury was a non-metropolitan district in Wiltshire, England. It was abolished on 1 April 2009 and replaced by Wiltshire Council.

Elections to North Wiltshire District Council were held on 3 May 2007. The whole council was up for election, and the Conservatives gained overall control, winning thirty-nine of the fifty-four seats available.

Elections to Salisbury District Council were held on 3 May 2007. The whole council was up for election, and the Conservatives lost overall control, but were still the largest party winning twenty-two of the fifty-five seats available.

References