The 2002 Swindon Borough Council election took place on 2 May 2002 to elect members of Swindon Unitary Council in Wiltshire, England. One third of the council was up for election and the council stayed under no overall control. [1]
A unitary authority is a type of local authority that has a single tier and is responsible for all local government functions within its area or performs additional functions which elsewhere in the relevant country are usually performed by national government or a higher level of sub-national government.
Wiltshire is a county in South West England with an area of 3,485 km2. It is landlocked and borders the counties of Dorset, Somerset, Hampshire, Gloucestershire, Oxfordshire and Berkshire. The county town was originally Wilton, after which the county is named, but Wiltshire Council is now based in the county town of Trowbridge.
England is a country that is part of the United Kingdom. It shares land borders with Wales to the west and Scotland to the north-northwest. The Irish Sea lies west of England and the Celtic Sea lies to the southwest. England is separated from continental Europe by the North Sea to the east and the English Channel to the south. The country covers five-eighths of the island of Great Britain, which lies in the North Atlantic, and includes over 100 smaller islands, such as the Isles of Scilly and the Isle of Wight.
After the election, the composition of the council was
The election in Swindon was one of thirty that trialed different methods of voting or counting in the 2002 local elections, with Swindon having a trial of voting via the internet. [3] The trial results had 5% of voters using the phone to cast a vote and over 10% voting via the internet. [4] A survey in Swindon found that those who voted via the Internet were more likely to be younger and male than those who voted at a polling station. [5] Overall turnout in the election was 31.33%. [6]
The Internet is the global system of interconnected computer networks that use the Internet protocol suite (TCP/IP) to link devices worldwide. It is a network of networks that consists of private, public, academic, business, and government networks of local to global scope, linked by a broad array of electronic, wireless, and optical networking technologies. The Internet carries a vast range of information resources and services, such as the inter-linked hypertext documents and applications of the World Wide Web (WWW), electronic mail, telephony, and file sharing.
Voter turnout is the percentage of eligible voters who cast a ballot in an election. Eligibility varies by country, and the voting-eligible population should not be confused with the total adult population. Age and citizenship status are often among the criteria used to determine eligibility, but some countries further restrict eligibility based on sex, race, or religion.
Party | Seats | Gains | Losses | Net gain/loss | Seats % | Votes % | Votes | +/− | |
---|---|---|---|---|---|---|---|---|---|
Labour | 9 | 1 | 1 | 0 | 47.4 | 34.2 | 13,539 | ||
Conservative | 7 | 1 | 1 | 0 | 36.8 | 38.6 | 15,250 | ||
Liberal Democrat | 3 | 0 | 0 | 0 | 15.8 | 24.3 | 9,609 | ||
Green | 0 | 0 | 0 | 0 | 0 | 1.8 | 703 | ||
Socialist Alliance | 0 | 0 | 0 | 0 | 0 | 0.4 | 170 | ||
Rock 'n' Roll Loony | 0 | 0 | 0 | 0 | 0 | 0.3 | 138 | ||
Independent | 0 | 0 | 0 | 0 | 0 | 0.3 | 128 |
Party | Candidate | Votes | % | ± | |
---|---|---|---|---|---|
Conservative | Justin Tomlinson | 705 | 70.4 | ||
Labour | Michelle Mahon | 195 | 19.5 | ||
Liberal Democrat | Katherine Pajak | 101 | 10.1 | ||
Majority | 510 | 50.9 | |||
Turnout | 1,001 | 28.9 | |||
Conservative hold | Swing |
Party | Candidate | Votes | % | ± | |
---|---|---|---|---|---|
Conservative | Doreen Dart | 796 | 72.2 | ||
Labour | Lynn Vardy | 160 | 14.5 | ||
Liberal Democrat | Ruth Fitchett | 146 | 13.2 | ||
Majority | 636 | 57.7 | |||
Turnout | 1,102 | 42.1 | |||
Conservative hold | Swing |
Party | Candidate | Votes | % | ± | |
---|---|---|---|---|---|
Labour | David Nash | 758 | 41.9 | ||
Liberal Democrat | Michael Dickinson | 628 | 34.7 | ||
Conservative | Peter Bates | 300 | 16.6 | ||
Green | Simon Smith | 85 | 4.7 | ||
Rock 'n' Roll Loony | John Stuart | 37 | 2.0 | ||
Majority | 130 | 7.2 | |||
Turnout | 1,808 | 25.4 | |||
Labour hold | Swing |
Party | Candidate | Votes | % | ± | |
---|---|---|---|---|---|
Labour | Maureen Dilley | 1,188 | 47.8 | ||
Conservative | Angela Watts | 984 | 39.6 | ||
Liberal Democrat | Adelaide Dudman | 313 | 12.6 | ||
Majority | 204 | 8.2 | |||
Turnout | 2,485 | 35.7 | |||
Labour hold | Swing |
Party | Candidate | Votes | % | ± | |
---|---|---|---|---|---|
Labour | David Wren | 1,056 | 44.5 | ||
Conservative | Garry Perkins | 986 | 41.6 | ||
Liberal Democrat | Mark Wheaver | 275 | 11.6 | ||
Rock 'n' Roll Loony | Bridget Jeffery | 55 | 2.3 | ||
Majority | 70 | 3.0 | |||
Turnout | 2,372 | 34.2 | |||
Labour gain from Conservative | Swing | ||||
Party | Candidate | Votes | % | ± | |
---|---|---|---|---|---|
Liberal Democrat | Michael Evemy | 1,030 | 47.8 | ||
Labour | Richard Young | 571 | 26.5 | ||
Conservative | Russell Holland | 352 | 16.3 | ||
Green | Christine Smith | 155 | 7.2 | ||
Rock 'n' Roll Loony | Roland Gillard | 46 | 2.1 | ||
Majority | 459 | 21.3 | |||
Turnout | 2,154 | 28.1 | |||
Liberal Democrat hold | Swing |
Party | Candidate | Votes | % | ± | |
---|---|---|---|---|---|
Liberal Democrat | Christopher Shepherd | 879 | 40.9 | ||
Conservative | Michael Bray | 746 | 34.7 | ||
Labour | Phil Rashid | 526 | 24.5 | ||
Majority | 133 | 6.2 | |||
Turnout | 2,151 | 28.1 | |||
Liberal Democrat hold | Swing |
Party | Candidate | Votes | % | ± | |
---|---|---|---|---|---|
Labour | Maurice Fanning | 847 | 54.3 | ||
Conservative | Mark Furkins | 376 | 24.1 | ||
Socialist Alliance | Andrew Newman | 170 | 10.9 | ||
Liberal Democrat | Jacob Pajak | 168 | 10.8 | ||
Majority | 471 | 30.2 | |||
Turnout | 1,561 | 22.7 | |||
Labour hold | Swing |
Party | Candidate | Votes | % | ± | |
---|---|---|---|---|---|
Conservative | David Renard | 1,133 | 47.9 | ||
Labour | Fay Howard | 821 | 34.7 | ||
Liberal Democrat | Tel Hudson | 411 | 17.4 | ||
Majority | 312 | 13.2 | |||
Turnout | 2,365 | 30.0 | |||
Conservative gain from Labour | Swing | ||||
Party | Candidate | Votes | % | ± | |
---|---|---|---|---|---|
Conservative | Lisa Hawkes | 1,293 | 50.5 | ||
Labour | Peter Mallinson | 719 | 28.1 | ||
Liberal Democrat | Jenny Shorten | 550 | 21.5 | ||
Majority | 574 | 22.4 | |||
Turnout | 2,562 | 38.7 | |||
Conservative hold | Swing |
Party | Candidate | Votes | % | ± | |
---|---|---|---|---|---|
Labour | Derique Montaut | 843 | 46.4 | ||
Conservative | Kirt Wakefield | 646 | 35.5 | ||
Liberal Democrat | Nigel Bass | 329 | 18.1 | ||
Majority | 197 | 10.8 | |||
Turnout | 1,818 | 24.7 | |||
Labour hold | Swing |
Party | Candidate | Votes | % | ± | |
---|---|---|---|---|---|
Liberal Democrat | Wendy Johnson | 1,933 | 48.9 | ||
Conservative | Colin Lovell | 1,603 | 40.5 | ||
Labour | John Newman | 273 | 6.9 | ||
Green | John Hughes | 147 | 3.7 | ||
Majority | 330 | 8.3 | |||
Turnout | 3,956 | 52.7 | |||
Liberal Democrat hold | Swing |
Party | Candidate | Votes | % | ± | |
---|---|---|---|---|---|
Labour | Barrie Thompson | 973 | 64.4 | ||
Conservative | Natasha Young | 293 | 19.4 | ||
Liberal Democrat | Ellen Aylett | 245 | 16.2 | ||
Majority | 680 | 45.0 | |||
Turnout | 1,511 | 21.8 | |||
Labour hold | Swing |
Party | Candidate | Votes | % | ± | |
---|---|---|---|---|---|
Labour | David Glaholm | 687 | 59.5 | ||
Liberal Democrat | Clive Fitchett | 253 | 21.9 | ||
Conservative | Donald Day | 215 | 18.6 | ||
Majority | 434 | 37.6 | |||
Turnout | 1,155 | 25.7 | |||
Labour hold | Swing |
Party | Candidate | Votes | % | ± | |
---|---|---|---|---|---|
Conservative | Douglas Stewart | 1,000 | 53.2 | ||
Labour | Neil Heavens | 502 | 26.7 | ||
Liberal Democrat | John Phipps | 379 | 20.1 | ||
Majority | 498 | 26.5 | |||
Turnout | 1,881 | 27.2 | |||
Conservative hold | Swing |
Party | Candidate | Votes | % | ± | |
---|---|---|---|---|---|
Conservative | Bernard Baker | 1,069 | 47.2 | ||
Labour | Alison Durrant | 897 | 39.6 | ||
Liberal Democrat | John Newman | 300 | 13.2 | ||
Majority | 172 | 7.6 | |||
Turnout | 2,266 | 30.5 | |||
Conservative hold | Swing |
Party | Candidate | Votes | % | ± | |
---|---|---|---|---|---|
Labour | Philip Steele | 1,006 | 45.4 | ||
Conservative | Raymond Fisher | 882 | 39.8 | ||
Liberal Democrat | Martin Wiltshire | 214 | 9.7 | ||
Green | Raymond Smith | 113 | 5.1 | ||
Majority | 124 | 5.6 | |||
Turnout | 2,215 | 31.2 | |||
Labour hold | Swing |
Party | Candidate | Votes | % | ± | |
---|---|---|---|---|---|
Labour | Kevin Small | 1,068 | 50.2 | ||
Conservative | Paul Saunders | 535 | 25.2 | ||
Liberal Democrat | Elizabeth Clifton-Page | 301 | 14.2 | ||
Independent | Michael Morton | 128 | 6.0 | ||
Green | Robert Heritage | 94 | 4.4 | ||
Majority | 533 | 25.1 | |||
Turnout | 2,126 | 28.5 | |||
Labour hold | Swing |
Party | Candidate | Votes | % | ± | |
---|---|---|---|---|---|
Conservative | Jemima Milton | 1,336 | 43.8 | ||
Liberal Democrat | Clive Hooper | 1,154 | 37.9 | ||
Labour | Andy Harrison | 449 | 14.7 | ||
Green | James Bevan | 109 | 3.6 | ||
Majority | 182 | 6.0 | |||
Turnout | 3,048 | 40.0 | |||
Conservative hold | Swing |
One third of Colchester Borough Council in Essex, England is elected each year, followed by one year without election. Since the last boundary changes at the 2016 election, 51 councillors have been elected from 17 wards.
The 2000 Amber Valley Borough Council election took place on 4 May 2000 to elect members of Amber Valley Borough Council in Derbyshire, England. The whole council was up for election with boundary changes since the last election in 1999 increasing the number of seats by 2. The Conservative party gained control of the council from the Labour party.
The 2002 Tunbridge Wells Council election took place on 2 May 2002 to elect members of Tunbridge Wells Borough Council in Kent, England. The whole council was up for election with boundary changes since the last election in 2000. The Conservative party stayed in overall control of the council.
The 2002 Wandsworth Council election took place on 2 May 2002 to elect members of Wandsworth London Borough Council in London, England. The whole council was up for election with boundary changes since the last election in 1998 reducing the number of seats by 1. The Conservative party stayed in overall control of the council.
The 2002 St Albans City and District Council election took place on 2 May 2002 to elect members of St Albans District Council in Hertfordshire, England. One third of the council was up for election and the council stayed under no overall control.
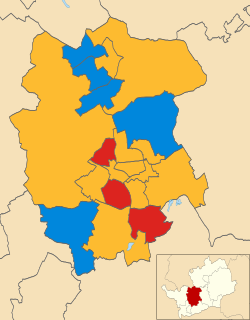
The 2003 St Albans City and District Council election took place on 1 May 2003 to elect members of St Albans District Council in Hertfordshire, England. One third of the council was up for election and the council stayed under no overall control.
The 2002 South Tyneside Metropolitan Borough Council election took place on 2 May 2002 to elect members of South Tyneside Metropolitan Borough Council in Tyne and Wear, England. One third of the council was up for election and the Labour party kept overall control of the council.
The 2003 South Tyneside Metropolitan Borough Council election took place on 1 May 2003 to elect members of South Tyneside Metropolitan Borough Council in Tyne and Wear, England. One third of the council was up for election and the Labour party kept overall control of the council.
The 1999 Southend-on-Sea Council election took place on 6 May 1999 to elect members of Southend-on-Sea Unitary Council in Essex, England. One third of the council was up for election and the council stayed under no overall control.
The 2003 Rushmoor Council election took place on 1 May 2003 to elect members of Rushmoor Borough Council in Hampshire, England. One third of the council was up for election and the Conservative party stayed in overall control of the council.
The 2007 Rushmoor Council election took place on 3 May 2007 to elect members of Rushmoor Borough Council in Hampshire, England. One third of the council was up for election and the Conservative party stayed in overall control of the council.
The 1999 Swindon Borough Council election took place on 6 May 1999 to elect members of Swindon Unitary Council in Wiltshire, England. One third of the council was up for election and the Labour party stayed in overall control of the council.
The 2000 Swindon Borough Council election took place on 6 May 2000 to elect members of Swindon Unitary Council in Wiltshire, England. The whole council was up for election with boundary changes since the last election in 1999 increasing the number of seats by 5. The Labour party lost overall control of the council to no overall control.
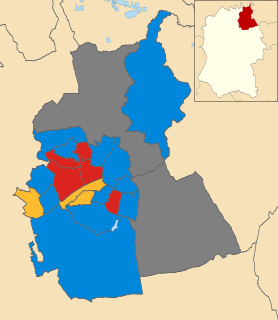
The 2003 Swindon Borough Council election took place on 1 May 2003 to elect members of Swindon Unitary Council in Wiltshire, England. One third of the council was up for election and the council stayed under no overall control.
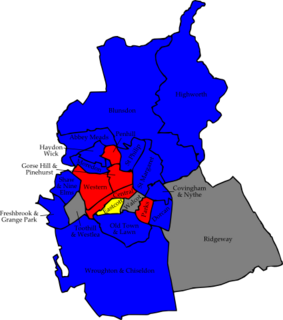
The 2006 Swindon Borough Council election took place on 4 May 2006 to elect members of Swindon Unitary Council in Wiltshire, England. One third of the council was up for election and the Conservative party stayed in overall control of the council.
The 2007 Swindon Borough Council election took place on 4 May 2007 to elect members of Swindon Unitary Council in Wiltshire, England. One third of the council was up for election and the Conservative party stayed in overall control of the council.
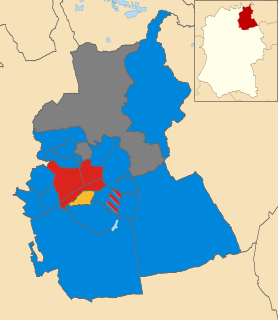
The 2008 Swindon Borough Council election took place on 4 May 2008 to elect members of Swindon Unitary Council in Wiltshire, England. One third of the council was up for election and the Conservative party stayed in overall control of the council.
The 2000 Windsor and Maidenhead Borough Council election took place on 4 May 2000 to elect members of Windsor and Maidenhead Unitary Council in Berkshire, England. The whole council was up for election and the Liberal Democrats lost overall control of the council to no overall control.
The 2003 Windsor and Maidenhead Borough Council election took place on 1 May 2003 to elect members of Windsor and Maidenhead Unitary Council in Berkshire, England. The whole council was up for election with boundary changes since the last election in 2000 reducing the number of seats by 1. The Liberal Democrats gained overall control of the council from no overall control.
The 2011 Swindon Borough Council election took place on 5 May 2011 to elect members of Swindon Unitary Council in Wiltshire, England. One third of the council was up for election and the Conservative party stayed in overall control of the council.