Barnet London Borough Council election, 2002

Last updated

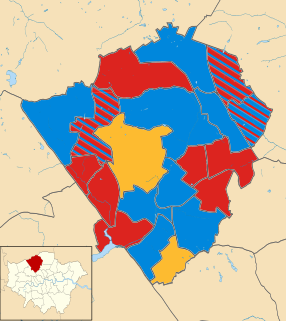
Map of the results of the 2002 Barnet council election. Conservatives in blue, Labour in red and Liberal Democrats in yellow. Barnet UK local election 2002 map.svg
Map of the results of the 2002 Barnet council election. Conservatives in blue, Labour in red and Liberal Democrats in yellow.

The 2002 Barnet Council election took place on 2 May 2002 to elect members of Barnet London Borough Council in London, England. The whole council was up for election and the Conservative party gained overall control of the council.

Barnet London Borough Council local authority for the London Borough of Barnet in Greater London, England

Barnet London Borough Council is the local authority for the London Borough of Barnet in Greater London, England. It is a London borough council, one of 32 within London. Barnet is divided into 21 wards, each electing three councillors.
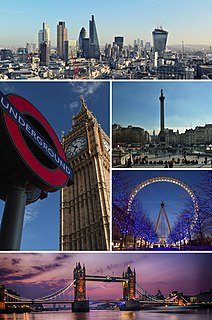
London Capital of the United Kingdom

London is the capital and largest city of both England and the United Kingdom. Standing on the River Thames in the south-east of England, at the head of its 50-mile (80 km) estuary leading to the North Sea, London has been a major settlement for two millennia. Londinium was founded by the Romans. The City of London, London's ancient core − an area of just 1.12 square miles (2.9 km2) and colloquially known as the Square Mile − retains boundaries that follow closely its medieval limits. The City of Westminster is also an Inner London borough holding city status. Greater London is governed by the Mayor of London and the London Assembly.

Conservative Party (UK) Political party in the United Kingdom

The Conservative Party, officially the Conservative and Unionist Party, is a centre-right political party in the United Kingdom. Presently led by Theresa May, it has been the governing party since 2010. It presently has 314 Members of Parliament in the House of Commons, 249 members of the House of Lords, and 18 members of the European Parliament. It also has 31 Members of the Scottish Parliament, 12 members of the Welsh Assembly, eight members of the London Assembly and 9,008 local councillors. One of the major parties of UK politics, it has formed the government on 45 occasions, more than any other party.

Contents

Background

Before the election a Labour-Liberal Democrat coalition ran the council. Since the last election in 1998, the Local Government Commission carried out a periodic electoral review of Barnet under the Local Government Act 1992 and made a number of boundary changes increasing the number of seats by three. [1] [2]

The Labour Party is a centre-left political party in the United Kingdom which has been described as an alliance of social democrats, democratic socialists and trade unionists. The party's platform emphasises greater state intervention, social justice and strengthening workers' rights.

Liberal Democrats (UK) Political party in the United Kingdom

The Liberal Democrats are a liberal political party in the United Kingdom. They presently have 11 Members of Parliament in the House of Commons, 96 members of the House of Lords, and one member of the European Parliament. They also have five Members of the Scottish Parliament and a member each in the Welsh Assembly and London Assembly. The party reached the height of its influence in the early 2010s, forming a junior partner in a coalition government from 2010 to 2015. It is presently led by Vince Cable.

Local Government Commission for England (1992)

The Local Government Commission for England was the body responsible for reviewing the structure of local government in England from 1992 to 2002. It was established under the Local Government Act 1992, replacing the Local Government Boundary Commission for England. The Commission could be ordered by the Secretary of State to undertake "structural reviews" in specified areas and recommend the creation of unitary authorities in the two-tier shire counties of England. The Commission, chaired by John Banham, conducted a review of all the non-metropolitan counties of England from 1993 to 1994, making various recommendations on their future.

Election result

Overall turnout in the election was 34.04%.

Barnet Local Election Result 2002
PartySeatsGainsLossesNet gain/lossSeats %Votes %Votes+/−
  Conservative 33 +5 52.4 42.7 94,692
  Labour 24 -2 38.1 36.0 79,775
  Liberal Democrat 6 0 9.5 17.8 39,470
  Green 0 0 0 3.1 6,822
  Independent 0 0 0 0.4 854
  UKIP 0 0 0 0 0 0.1 148

Ward results

Brunswick Park

Brunswick Park (3 seats) [3]
PartyCandidateVotes%±
Conservative Andreas Tambourides 2,278
Conservative Daniel Hope 2,269
Conservative Lynne Hillan 2,267
Labour Geoffrey Cooke 1,627
Labour Antonakis Vourou 1,494
Labour Kelly Tebb 1,488
Liberal Democrat Peter Finlayson 463
Liberal Democrat Margaret Neil 443
Liberal Democrat Charles Wicksteed 323
Green Dennis Vigay 257
Turnout 12,909 40.8
Conservative win (new seat)

Burnt Oak

Burnt Oak (3 seats) [3]
PartyCandidateVotes%±
Labour Allan Turner 1,675
Labour Alan Williams 1,657
Labour Linda McFadyen 1,496
Conservative Patricia Sparrow 426
Conservative Joanne Williams 412
Conservative Rene Braun 411
Green Audrey Poppy 194
Liberal Democrat Michael Roberts 145
Liberal Democrat Karen Hatchett 144
Liberal Democrat Hewryk Freszczur 82
Turnout 6,642 24.3
Labour win (new seat)

Childs Hill

Childs Hill (3 seats) [3]
PartyCandidateVotes%±
Liberal Democrat Jack Cohen 1,779
Liberal Democrat Monroe Palmer 1,775
Liberal Democrat Susette Palmer 1,703
Conservative Malcolm Harris 856
Conservative Jonathan Herbst 790
Conservative Jagmail Gill 740
Labour David Robinson 717
Labour Claire Farrier 688
Labour Dilip Mitra 607
Green Julie Rosenfield 288
Turnout 9,943 29.4
Liberal Democrat win (new seat)

Colindale

Colindale (3 seats) [3]
PartyCandidateVotes%±
Labour Danish Chopra 1,314
Labour Gillian Sargeant 1,302
Labour Alan Sloam 1,219
Conservative Keith Dyall 376
Conservative Marilyn Manning 376
Conservative Ashton Doherty 374
Liberal Democrat Daniel Estermann 294
Liberal Democrat Philip Reynolds 282
Liberal Democrat Geoffrey Jacobs 238
Green John Incenzo 156
Turnout 5,931 20.7
Labour win (new seat)

Coppetts

Coppetts (3 seats) [3]
PartyCandidateVotes%±
Labour Paul Rogers 1,816
Labour Barry Rawlings 1,742
Labour Soon-Hoe Teh 1,578
Conservative Mukesh Depala 1,119
Conservative Jonathan Shrank 1,086
Conservative Poli Tsoukka 1,026
Liberal Democrat Mark Ashfield 443
Liberal Democrat Kathleen Lamprell 439
Liberal Democrat Nicholas Sullivan 387
Green David Gutmann 381
Turnout 10,017 31.8
Labour win (new seat)

East Barnet

East Barnet (3 seats) [3]
PartyCandidateVotes%±
Conservative Olwen Evans 2,157
Conservative Terence Burton 2,074
Conservative Susan Steinberg 2,069
Labour Anne Jarvis 1,969
Labour Gordon Massey 1,792
Labour Timothy Roberts 1,706
Liberal Democrat Elizabeth Wardle 461
Liberal Democrat Leonard Watkins 441
Liberal Democrat Rosemary Mayes 394
Green Tracey Mason 393
Turnout 13,456 40.6
Conservative win (new seat)

East Finchley

East Finchley (3 seats) [3]
PartyCandidateVotes%±
Labour Alison Moore 2,013
Labour Colin Rogers 1,933
Labour Phil Yeoman 1,900
Conservative Dermott Donnelly 879
Conservative Andrew Berkeley 823
Conservative Manish Depala 798
Green Noel Lynch 626
Liberal Democrat Joyce Arram 547
Liberal Democrat Stephen Barber 489
Liberal Democrat Philip Avery 365
UKIP Stuart Rising 148
Turnout 10,521 35.1
Labour win (new seat)

Edgware

Edgware (3 seats) [3]
PartyCandidateVotes%±
Conservative Helena Hart 1,861
Conservative Malcolm Lester 1,854
Conservative Joan Scannell 1,792
Labour Harold Russell 966
Labour Rajasingham Jayadevan 897
Labour Pierre Jeanmarie 859
Liberal Democrat Elias Abeles 592
Liberal Democrat Mira Levy 468
Independent Colin Leci 331
Liberal Democrat Diana Iwi 292
Green Debra Green 251
Turnout 10,163 32.3
Conservative win (new seat)

Finchley Church End

Finchley Church End (3 seats) [3]
PartyCandidateVotes%±
Conservative Eva Greenspan 2,126
Conservative Leslie Sussman 2,047
Conservative Mike Freer 1,971
Labour Mary McGuirk 930
Labour Nick Guest 919
Labour Lily Mitchell 899
Green Miranda Dunn 396
Liberal Democrat Keith Rodwell 387
Liberal Democrat Millicent Watkins 344
Liberal Democrat Peter Lusher 331
Turnout 10,350 34.3
Conservative win (new seat)

Garden Suburb

Garden Suburb (3 seats) [3]
PartyCandidateVotes%±
Conservative John Marshall 2,262
Conservative Vanessa Gearson 1,913
Conservative Jazmin Naghar 1,815
Liberal Democrat Marjorie Harris 1,343
Liberal Democrat Alison Marshall 1,286
Liberal Democrat Simon Kovar 1,124
Labour Rachel Cashman 549
Labour Fred Tyler 435
Labour Julian Mason 414
Green Andrew Farrer 313
Turnout 11,454 38.8
Conservative win (new seat)

Golders Green

Golders Green (3 seats) [3]
PartyCandidateVotes%±
Conservative Melvin Cohen 2,160
Conservative Aba Dunner 2,154
Conservative Christopher Harris 2,019
Labour Mira Goldberg 1,014
Labour Jean Thorp 945
Labour Bill Thorp 893
Liberal Democrat Leonie Stephen 304
Liberal Democrat Inge Graber 285
Liberal Democrat John Sutcliffe 267
Green Dolores Incenzo 229
Turnout 10,270 37.4
Conservative win (new seat)

Hale

Hale (3 seats) [3]
PartyCandidateVotes%±
Labour Steven Blomer 1,879
Labour Ruth Nyman 1,855
Conservative Brian Gordon 1,801
Labour Zakia Zubairi 1,678
Conservative Caroline Margo 1,618
Conservative Hugh Rayner 1,598
Liberal Democrat Phyllis Fiander 446
Liberal Democrat Sheila Gottsche 433
Liberal Democrat Anthony Rowlands 407
Green David Lake 256
Turnout 11,971 36.5
Labour win (new seat)
Conservative win (new seat)

Hendon

Hendon (3 seats) [3]
PartyCandidateVotes%±
Conservative Tony Finn 1,591
Conservative Maureen Braun 1,492
Conservative Matthew Offord 1,345
Liberal Democrat Jason Moleman 1,122
Liberal Democrat Michael Green 1,084
Liberal Democrat Steven Deller 1,039
Labour Aubrey Ross 827
Labour Anthony Boulton 668
Labour Doreen Neall 662
Green Georgia Theodorou 207
Turnout 10,037 30.5
Conservative win (new seat)

High Barnet

High Barnet (3 seats) [3]
PartyCandidateVotes%±
Conservative Wendy Prentice 2,225
Conservative Katia David 2,129
Conservative Kanti Patel 1,989
Labour Alison Rogers 1,054
Labour Glyn Thomas 954
Labour Liam Cook 937
Liberal Democrat David Nowell 578
Liberal Democrat Matthew Harris 549
Liberal Democrat James Barton 490
Green Tim Riley 478
Independent Chris Johnson 273
Turnout 11,656 37.6
Conservative win (new seat)

Mill Hill

Mill Hill (3 seats) [3]
PartyCandidateVotes%±
Liberal Democrat Wayne Casey 2,434
Liberal Democrat Jeremy Davies 2,344
Liberal Democrat Sean Hooker 2,089
Conservative John Hart 1,081
Conservative Paul Amsterdam 1,061
Conservative Sachin Rajput 960
Labour James Wragg 460
Labour Vinod Sodha 453
Labour Saira Hettiarachchi 439
Green Pablo De Mello 256
Turnout 11,577 36.0
Liberal Democrat win (new seat)

Oakleigh

Oakleigh (3 seats) [3]
PartyCandidateVotes%±
Conservative Brian Salinger 1,889
Conservative Robert Newton 1,860
Conservative Gerard Silverstone 1,828
Labour Kathleen Levine 1,234
Labour David McNulty 1,209
Labour Ross Houston 1,194
Liberal Democrat Neil Ferguson 565
Liberal Democrat Yvonne Wicksteed 528
Liberal Democrat Brigid Povah 456
Green Angela Ryan 335
Turnout 11,098 33.8
Conservative win (new seat)

Totteridge

Totteridge (3 seats) [3]
PartyCandidateVotes%±
Conservative Brian Coleman 2,145
Conservative Victor Lyon 2,120
Conservative Kevin Edson 2,075
Labour Marianne Haylett 766
Labour Jacques Astruc 701
Labour Robert Persad 621
Liberal Democrat Jennifer Keech 497
Liberal Democrat Victor Corney 453
Liberal Democrat David Smith 430
Green Brian Jacobs 367
Turnout 10,175 34.3
Conservative win (new seat)

Underhill

Underhill (3 seats) [3]
PartyCandidateVotes%±
Conservative Fiona Bulmer 1,936
Labour Anita Campbell 1,869
Conservative Peter Davis 1,850
Conservative Joan Levinson 1,780
Labour Pauline Coakley-Webb 1,750
Labour Chris Underwood 1,604
Liberal Democrat David Keech 393
Liberal Democrat Jonathan Davies 370
Liberal Democrat Michael Cole 359
Green Colin Newman 331
Independent James Crawford 147
Independent George Tranda 103
Turnout 12,492 38.2
Conservative win (new seat)
Labour win (new seat)
Conservative win (new seat)

West Finchley

West Finchley (3 seats) [3]
PartyCandidateVotes%±
Labour Kitty Lyons 1,795
Labour Kath McGuirk 1,770
Labour Jim Tierney 1,732
Conservative Patrick Foley 1,234
Conservative Chris Kilmister 1,188
Conservative Syed Meer 1,098
Liberal Democrat Janice Turner 502
Liberal Democrat Malcolm Blount 456
Green Gustav Clarkson 448
Liberal Democrat Malcolm Davis 433
Turnout 10,656 35.5
Labour win (new seat)

West Hendon

Hendon West (3 seats) [3]
PartyCandidateVotes%±
Labour Arun Ghosh 1,614
Labour Agnes Slocombe 1,561
Labour Ansuya Sodha 1,431
Conservative Asher Bornstein 994
Conservative Susan Lee 932
Conservative Michael Grenfell 882
Liberal Democrat Harry Levy 388
Liberal Democrat Richard Coward 330
Liberal Democrat Shirley Rodwell 315
Green Christine Antoniou 228
Turnout 8,675 29.0
Labour win (new seat)

Woodhouse

Woodhouse (3 seats) [3]
PartyCandidateVotes%±
Labour Anne Hutton 1,953
Labour Mark Langton 1,935
Labour Alan Schneiderman 1,717
Conservative Victor Kaye 1,486
Conservative Jolanta Broom 1,483
Conservative Satpal Chadha 1,442
Liberal Democrat Ian Murphy 493
Green Gardi Vaswani 432
Liberal Democrat Rita Druiff 416
Liberal Democrat Rita Landeryou 411
Turnout 11,768 36.3
Labour win (new seat)

By-elections between 2002 and 2006

Burnt Oak

Burnt Oak by-election, 19 June 2003 [4]
PartyCandidateVotes%±
Labour Claire Farrier 1,774 76.0 +7.4
Conservative Sachin Rajput 329 14.1 -3.4
Liberal Democrat Diana C. Iwi 178 7.6 +1.7
Green Edelgard Vaswani 53 2.3 -5.7
Majority 1,445 61.9
Turnout 2,334 23.2 -1.1
Labour hold Swing

The by-election was called following the resignation of Cllr. Alan J. Williams.

Hale

Hale by-election, 5 February 2004 [4]
PartyCandidateVotes%±
Labour David Mencer 1,329 43.7 +0.8
Conservative Lesley G. Evans 1,175 38.7 -2.4
Liberal Democrat Clive S. M. Cohen 423 13.9 +3.7
Green David G. Williams 113 3.7 -2.1
Majority 154 5.0
Turnout 3,040 26.6 -9.9
Labour hold Swing

The by-election was called following the resignation of Cllr. Ruth J. Nyman.

Colindale

Colindale by-election, 7 April 2005 [4]
PartyCandidateVotes%±
Labour Zakia Zubairi 1,154 63.4 +2.0
Conservative Alan R. Maund 299 16.4 -1.2
Liberal Democrat Geoffrey A. Jacobs 220 12.1 -1.6
Green David G. Williams 73 4.0 -3.3
UKIP Melvyn Smallman 45 2.5 +2.5
Independent Mirsad Becirovic 29 1.6 +1.6
Majority 855 47.0
Turnout 1,820 20.1 -0.6
Labour hold Swing

The by-election was called following the disqualification of Cllr. Alan M. Sloam.

Garden Suburb

Garden Suburb by-election, 5 May 2005 [5]
PartyCandidateVotes%±
Conservative Andrew Harper 3,365 50.7 +0.1
Liberal Democrat Marjorie Harris 1,834 27.6 -2.5
Labour Kenneth Murrell 1,154 17.4 +5.1
Green Miranda Dunn 242 3.6 -3.4
UKIP Primrose Chamberlin 42 0.6 +0.6
Majority 1,531 23.1
Turnout 6,637 66.9 +28.1
Conservative hold Swing

The by-election was called following the resignation of Cllr. Vanessa R. Gearson.

High Barnet

High Barnet by-election, 15 December 2005 [6]
PartyCandidateVotes%±
Liberal Democrat Duncan C. McDonald 1,409 44.4 +31.9
Conservative Bridget T. Perry 1,295 40.8 -7.5
Labour Timothy J. K. Roberts 354 11.2 -11.7
Green Audrey Poppy 89 2.8 -7.6
Independent Christopher V. Johnson 26 0.7 -5.2
Majority 114 3.6
Turnout 3,173 30.4
Liberal Democrat gain from Conservative Swing

The by-election was called following the resignation of Cllr. Kantilal S. Patel in October 2005. [7] It was only the third time in the council's history that a seat had changed hands in a by-election. [8]

Related Research Articles

Barking and Dagenham London Borough Council elections

Barking and Dagenham London Borough Council in London, England is elected every four years. Since the last boundary changes in 2002, 51 councillors have been elected from 17 wards.

Barnet London Borough Council elections

Barnet London Borough Council in London, England is elected every four years. Since the last boundary changes in 2002, 63 councillors have been elected from 21 wards.

1998 Barnet London Borough Council election

The 1998 Barnet Council election took place on 7 May 1998 to elect members of Barnet London Borough Council in London, England. The whole council was up for election and the council stayed under no overall control.

Croydon London Borough Council elections

Elections for the Council in the London Borough of Croydon are held every four years to elect 70 councillors. At the last elections, which were held in May 2014, 30 Conservative councillors and 40 Labour councillors, providing a Labour majority of ten seats.

Brent London Borough Council elections

Brent London Borough Council in London, England is elected every four years. Since the last boundary changes in 2002, 63 councillors have been elected from 21 wards.

Bromley London Borough Council elections

Bromley Council is elected every four years.

Camden London Borough Council elections

The Camden London Borough Council in London, England is elected every four years. Since the last boundary changes in 2002, 54 councillors have been elected from 18 wards.

2006 Barnet London Borough Council election

The 2006 Barnet Council election took place on 4 May 2006 to elect members of Barnet London Borough Council in London, England. The whole council was up for election and the Conservative party stayed in overall control of the council.

Enfield London Borough Council elections

Enfield London Borough Council in London, England is elected every four years. Since the last boundary changes in 2002, 63 councillors have been elected from 21 wards.

Lewisham London Borough Council elections

The London Borough of Lewisham is a London borough, in the United Kingdom, established in 1964. Elections are held every four years using a plurality bloc vote electoral system for the councillors and the supplementary vote electoral system for the elected mayor.

Sutton London Borough Council elections

Sutton London Borough Council in London, England is elected every four years.

Havering London Borough Council elections

Havering London Borough Council in London, England is elected every four years. Since the last boundary changes in 2002, 54 councillors have been elected from 18 wards.

Hammersmith and Fulham London Borough Council elections

Hammersmith and Fulham Council in London, England is elected every four years.

Merton London Borough Council elections

Merton London Borough Council in London, England is elected every four years; it has administrative control over the London Borough of Merton.

Westminster City Council elections

Westminster City Council, the local authority of the City of Westminster in London, England, is elected every four years. Since the last boundary changes in 2002, 60 councillors have been elected from 20 wards.

2010 Barnet London Borough Council election

The 2010 Barnet Council election took place on 6 May 2010 to elect members of Barnet London Borough Council in London, England. The whole council was up for election and the Conservative party stayed in overall control of the council.

Greenwich London Borough Council elections

Greenwich London Borough Council in London, England is elected every four years. Since the last boundary changes in 2002, 51 councillors have been elected from 17 wards.

The 1978 Barnet Council election took place on 4 May 1978 to elect members of Barnet London Borough Council in London, England. The whole council was up for election and the Conservative party stayed in overall control of the council.

The 1990 Barnet Council election took place on 3 May 1990 to elect members of Barnet London Borough Council in London, England. The whole council was up for election and the Conservative party stayed in overall control of the council.

The 1994 Barnet Council election took place on 5 May 1994 to elect members of Barnet London Borough Council in London, England. The whole council was up for election and the council went in no overall control.

References

  1. "Barnet". BBC News Online . Retrieved 2009-08-13.
  2. "Final Recommendations On The Future Electoral Arrangements For Barnet" (PDF). LGBCE Records & Resources. Local Government Commission for England. Retrieved 22 February 2015.
  3. 1 2 3 4 5 6 7 8 9 10 11 12 13 14 15 16 17 18 19 20 21 "Local Election 2002". Barnet London Borough. Archived from the original on 7 May 2010. Retrieved 2009-08-13.
  4. 1 2 3 "London Borough Council Elections 4 May 2006" (PDF). Greater London Authority. Archived from the original (PDF) on 17 March 2012. Retrieved 11 June 2011.
  5. "Garden Suburb ward by-election result". Barnet London Borough. Archived from the original on 16 March 2012. Retrieved 11 June 2011.
  6. "By-elections High Barnet 2005". Barnet London Borough. Archived from the original on 2 February 2012. Retrieved 11 June 2011.
  7. Barnet Times 27 October 2005
  8. Barnet Times 16 December 2005 Archived 27 September 2007 at the Wayback Machine .