Waltham Forest London Borough Council election, 2006

Last updated

Waltham Forest London Borough Council election, 2006
County Flag of Greater London.svg
  2002 4 May 2006 2010  

All 60 seats to Waltham Forest London Borough Council
31 seats needed for a majority

  First party Second party Third party
 
Leader Clyde Loakes Keith Rayner Geoffrey Walker
Party Labour Liberal Democrat Conservative
Leader's seat Leytonstone Cann Hall Hatch Lane
Last election 29 seats, 34.9% 13 seats, 29.9% 18 seats, 26.4%
Seats before 27 15 18
Seats won 26 19 15
Seat changeDecrease2.svg1Increase2.svg4Decrease2.svg3
Percentage 33.8% 33.8% 27.7 %

Waltham Forest London UK local election 2006 map.svg

Map of the results of the 2006 Waltham Forest council election. Conservatives in blue, Labour in red and Liberal Democrats in yellow.

Council control before election

No Overall Control

Council control after election

No Overall Control

The Waltham Forest Council elections, were held on 4 May 2006 in Waltham Forest, England. The whole council was up for election for the first time since the 2002 election.

London Borough of Waltham Forest London borough in United Kingdom

The London Borough of Waltham Forest is a London borough in northeast London, England.

England Country in north-west Europe, part of the United Kingdom

England is a country that is part of the United Kingdom. It shares land borders with Wales to the west and Scotland to the north-northwest. The Irish Sea lies west of England and the Celtic Sea lies to the southwest. England is separated from continental Europe by the North Sea to the east and the English Channel to the south. The country covers five-eighths of the island of Great Britain, which lies in the North Atlantic, and includes over 100 smaller islands, such as the Isles of Scilly and the Isle of Wight.

Contents

Waltham Forest local elections are held every four years, with the next due in 2010.

Eligibility

All locally registered electors (British, Irish, Commonwealth and European Union citizens) who were aged 18 or over on Thursday 4 May 2006 were entitled to vote in the local elections. Those who were temporarily away from their ordinary address (for example, away working, on holiday, in student accommodation or in hospital) were also entitled to vote in the local elections, [1] although those who had moved abroad and registered as overseas electors cannot vote in the local elections. It is possible to register to vote at more than one address (such as a university student who had a term-time address and lives at home during holidays) at the discretion of the local Electoral Register Office, but it remains an offence to vote more than once in the same local government election. [2]

In general, a Commonwealth citizen is a citizen of a member state of the Commonwealth of Nations. This designation is given legal effect in the nationality laws of some Commonwealth countries, and Commonwealth citizens may enjoy some privileges in the United Kingdom and, less commonly, other member states. Each Commonwealth country determines what special rights, if any, are accorded to citizens of other Commonwealth countries. The status is most significant in British law and has little effect in many other Commonwealth countries, such as Canada.

European Union Economic and political union of European states

The European Union (EU) is a political and economic union of 28 member states that are located primarily in Europe. It has an area of 4,475,757 km2 (1,728,099 sq mi) and an estimated population of about 513 million. The EU has developed an internal single market through a standardised system of laws that apply in all member states in those matters, and only those matters, where members have agreed to act as one. EU policies aim to ensure the free movement of people, goods, services and capital within the internal market, enact legislation in justice and home affairs and maintain common policies on trade, agriculture, fisheries and regional development. For travel within the Schengen Area, passport controls have been abolished. A monetary union was established in 1999 and came into full force in 2002 and is composed of 19 EU member states which use the euro currency.

The pattern of local government in England is complex, with the distribution of functions varying according to the local arrangements.

Composition before election

Elected in 2002 Before election
Party Seats Party Seats
Labour 29 Labour 27
Conservative 18 Conservative 18
Liberal Democrat 13 Liberal Democrat 15

Election result

Waltham Forest Local Election Result 2006 [3]
PartySeatsGainsLossesNet gain/lossSeats %Votes %Votes+/−
  Labour 26 2 5 -3 43.3 33.8 57,959
  Liberal Democrat 19 8 2 +6 31.7 32.4 55,628
  Conservative 15 0 3 -3 24.0 27.7 46,981
  Green 0 0 0Steady2.svg 4.7 8,094
  Respect 0 0 0Steady2.svg 1.0 1,775
  BNP 0 0 0Steady2.svg 0.3 509
  UKIP 0 0 0Steady2.svg 0.2 270
  Socialist Alternative 0 0 0Steady2.svg 0.1 245
  Independent 0 0 0Steady2.svg 0.1 178

Results by ward

The ward results listed below are based on the changes from the 2002 elections, not taking into account any mid-term by-elections or party defections.

The wards and electoral divisions in the United Kingdom are electoral districts at sub-national level represented by one or more councillors. The ward is the primary unit of English electoral geography for civil parishes and borough and district councils, electoral ward is the unit used by Welsh principal councils, while the electoral division is the unit used by English county councils and some unitary authorities. Each ward/division has an average electorate of about 5,500 people, but ward-population counts can vary substantially. As at the end of 2014 there were 9,456 electoral wards/divisions in the UK.

Cann Hall
PartyCandidateVotes%
Liberal Democrat Liz Phillips 1,345
Liberal Democrat Keith Rayner 1,338
Liberal Democrat Laura Sheppard 1,197
Labour Shah Ahmed 1,003
Labour Victoria Baffour-Awuah 975
Labour Richard Devaney 914
Green Pat Howie 337
Conservative Paul Canal 247
Conservative Kathleen Gosling 201
Conservative Mary Neilson-Hansen 200
Turnout 34.5%
Liberal Democrat hold
Cathall
PartyCandidateVotes%
Labour Milton Martin 1,117
Labour Shameem Highfield 1,072
Labour Terence Wheeler 982
Liberal Democrat Michael Hunt 955
Liberal Democrat Shahid Majid 940
Liberal Democrat Clyde Kitson 933
Green Maureen Measure 270
Conservative Graham Millington 178
Conservative Cajetan Iwunze 159
Conservative Pamela Jovcic 147
Independent Joan Devine 93
Independent Andrew Butler 85
Turnout 34.0%
Labour hold
Labour hold
Labour hold
Chapel End
PartyCandidateVotes%
Liberal Democrat Bob Belam 1,653
Liberal Democrat Bob Carey 1,537
Liberal Democrat John Macklin 1,420
Labour David Blunt 663
Labour Stephen Terry 632
Labour Sabha Akhtar 616
Conservative Brian Clarke 459
Conservative Josephine Gatward 429
Green Richard Burkett 419
Conservative John Phelan 373
Turnout 35.7%
Liberal Democrat hold
Chingford Green
PartyCandidateVotes%
Conservative Derek Arnold 2,288
Conservative Michael Lewis 2,279
Conservative Graham Sinclair 2,199
Liberal Democrat Keith Wendon 622
Liberal Democrat Joan Carder 605
Liberal Democrat Ian Paterson 573
Labour Farah Beg 359
Labour William Bayliss 357
Labour Jeffrey Blay 345
Turnout 43.0%
Conservative hold
Conservative hold
Conservative hold
Endlebury
PartyCandidateVotes%
Conservative Peter Herrington 2,227
Conservative Mladen Jovcic 2,063
Conservative Matthew Davis 2,056
Labour Kenneth Kennedy 425
Green Joan Allen 398
Liberal Democrat Edward Carder 351
Liberal Democrat Kathleen Mudie 350
Liberal Democrat Violet Wells 345
Labour Miles Washbrook 329
Labour Frances Manjra 322
Turnout 40.4%
Conservative hold
Conservative hold
Conservative hold
Forest
PartyCandidateVotes%
Liberal Democrat Farooq Qureshi 1,505
Liberal Democrat Imran Abrahim 1,490
Labour Faiz Yunis 1,289
Liberal Democrat Murle Mitchell 1,268
Labour Kabal Singh Dhillon 1,159
Labour Gerry Lyons 1,029
Green Rosalind Bedlow 534
Conservative Jean Farmer 508
Conservative Sean Phillips 414
Conservative Nial Finlayson 399
Turnout 41.5%
Liberal Democrat gain from Labour
Labour hold
Grove Green
PartyCandidateVotes%
Labour Tarsem Singh Bhogal 1,517
Labour Chris Robbins 1,430
Labour Anna Mbachu 1,356
Liberal Democrat Jennifer Sullivan 1,286
Liberal Democrat Neal Chubb 1,173
Liberal Democrat Paul Olford 1,171
Green William Measure 480
Conservative Nicola Devlin 270
Conservative Alan Gough 265
Conservative Derek Pryor 235
Turnout 38.4%
Labour hold
Labour hold
Labour gain from Liberal Democrat
Hale End and Highams Park
PartyCandidateVotes%
Liberal Democrat John Beanse 1,617
Liberal Democrat Noel Penstone 1,462
Liberal Democrat Sheila Smith-Pryor 1,453
Conservative Lesley Finlayson 1,434
Conservative Andrew Hemsted 1,363
Conservative Julien Foster 1,346
Labour Noel Hayes 437
Labour Ann Molyneux 404
Green Sallie Poppleton 367
Labour Martyn Bellamy 327
Turnout 46.6%
Liberal Democrat gain from Conservative
Hatch Lane
PartyCandidateVotes%
Conservative Marion Fitzgerald 1,651
Conservative Geoffrey Walker 1,548
Conservative Laurie Braham 1,478
Labour Martin Dore 529
Labour Sheila Dore 526
BNP John Pearce 509
Labour Shaheen Rafique 406
Liberal Democrat Marc Jones 404
Green Robert Tatam 380
Liberal Democrat Jeremy Dauncey 360
Liberal Democrat Jane Morgan 337
Turnout 37.8%
Conservative hold
Conservative hold
Conservative hold
High Street
PartyCandidateVotes%
Labour Liaquat Ali 1,472
Liberal Democrat Johar Khan 1,468
Liberal Democrat James O'Rourke 1,453
Liberal Democrat Dave Raval 1,372
Labour Diana Murray 1,349
Labour Narinder Matharoo 1,224
Green Denethor House 604
Conservative Edward Stacey 309
Conservative John Moss 269
Conservative Rachel Wedderburn 268
Socialist Alternative Claire Buddle 245
Turnout 43.1%
Labour hold
Liberal Democrat gain from Labour
Higham Hill
PartyCandidateVotes%
Liberal Democrat Sean Meiszner 1,303
Liberal Democrat Peter Woollcott 1,271
Liberal Democrat Patrick Smith 1,188
Labour Karen Bellamy 1,031
Labour Marcia Douet 883
Labour Peter Woodrow 859
Green Liam Kerr 327
Conservative Jemma Hemsted 309
Conservative Ayhan Kizil 258
Conservative Gerald King 214
Turnout 34.7%
Liberal Democrat hold
Hoe Street
PartyCandidateVotes%
Labour Naz Sarkar 1,351
Labour Saima Mahmud 1,314
Labour Eric Sizer 1,286
Green Stephen Lambert 785
Liberal Democrat Jacqueline Tidmarsh 605
Liberal Democrat Daniel Pond 592
Conservative Sophia Khan 530
Conservative Tara Draper-Stumm 475
Conservative Timothy Croot 469
Liberal Democrat Richard Tidmarsh 399
Turnout 34.7%
Labour hold
Labour hold
Labour hold
Larkswood
PartyCandidateVotes%
Conservative Nicholas Buckmaster 1,653
Conservative John Walter 1,651
Conservative Eric Williams 1,545
Labour Carolyn Brown 476
Labour Anne Garrett 465
Labour John Brown 461
Liberal Democrat Cynthia Wenden 358
Liberal Democrat Graham Woolnough 345
Green Bridget Kerr 294
Liberal Democrat Khizar Khan-Lodhi 290
UKIP Robert Brock 270
Turnout 34.5%
Conservative hold
Conservative hold
Conservative hold
Lea Bridge
PartyCandidateVotes%
Labour Masood Ahmad 1,375
Labour Elizabeth Davies 1,327
Labour Afzal Akram 1,240
Liberal Democrat Nasar Malik 517
Liberal Democrat Maureen Lake 509
Liberal Democrat Frederick Lake 471
Conservative Barbara Miller 451
Green Elen Miles 429
Conservative Mahmood Noman 360
Conservative Ilkay Halabi 320
Turnout 27.1%
Labour hold
Labour hold
Labour hold
Leyton
PartyCandidateVotes%
Liberal Democrat Naheed Qureshi 1,443
Labour Miranda Grell 1,427
Liberal Democrat Bob Sullivan 1,424
Liberal Democrat Barry Smith 1,399
Labour Simon Wright 1,245
Labour Nicholas Russell 1,242
Green Helen Griffith 253
Conservative Paul Braham 216
Conservative Anne Pryor 176
Conservative Colette Gosling 167
Turnout 37.6%
Liberal Democrat hold
Labour gain from Liberal Democrat
Liberal Democrat hold
Leytonstone
PartyCandidateVotes%
Labour Marie Pye 1,431
Labour Clyde Loakes 1,352
Labour Jenny Gray 1,274
Liberal Democrat Nazir Butt 811
Liberal Democrat Mahmood Faiz 802
Liberal Democrat Marie Valery 710
Green Mark Dawes 594
Conservative Helen Johnson 389
Respect Peter Ashan 387
Respect Caroline Coleman 384
Conservative Raymond Luker 370
Conservative Roderick Milroy 338
Turnout 38.8%
Labour hold
Labour hold
Labour hold
Markhouse
PartyCandidateVotes%
Labour Margaret Broadley 1,227
Labour Asim Mahmood 1,199
Labour Mohammad Asghar 1,174
Liberal Democrat Javed Azam 740
Liberal Democrat Munir Hussain 687
Liberal Democrat Frank Blewett 686
Green Judith Stubbings 570
Respect Mahtab Aziz 533
Respect Carole Vincent 471
Conservative Roger Hemsted 442
Conservative Bilal Mahmood 351
Conservative Eylem Kizil 336
Turnout 36.3%
Labour hold
Labour hold
Labour hold
Valley
PartyCandidateVotes%
Conservative John Gover 1,710
Conservative Alan Siggers 1,638
Conservative Laurance Wedderburn 1,539
Liberal Democrat Henry Boyle 608
Labour Sivakumar Chelliah 546
Liberal Democrat Mohammad Malik 540
Labour Aktar Beg 526
Liberal Democrat Shahnaz Rashid 476
Labour Crispin St Hill 457
Turnout 37.1%
Conservative hold
Conservative hold
Conservative hold
William Morris
PartyCandidateVotes%
Labour Geraldine Reardon 1,421
Labour Adam Gladstone 1,409
Liberal Democrat Bob Wheatley 1,288
Labour Khevyn Limbajee 1,253
Liberal Democrat Mohammad Diwan 1,217
Liberal Democrat Simon Jones 1,144
Green Alexandra Rowe 496
Conservative Emily Garrett 322
Conservative Ian Drury 319
Conservative Tim James 293
Turnout 40.4%
Labour hold
Labour hold
Liberal Democrat gain from Labour
Wood Street
PartyCandidateVotes%
Labour Angela Bean 1,471
Labour Peter Barnett 1,383
Labour Richard Sweden 1,289
Conservative Laura McManus-Andrea 999
Conservative Halil Halabi 953
Conservative Aleksander Mazalon 926
Liberal Democrat Peter Hatton 671
Liberal Democrat Mazhar Iqbal 593
Liberal Democrat Mohammad Khan 558
Green Christine Olende 557
Turnout 40.2%
Labour hold
Labour hold
Labour hold

Related Research Articles

2009 Cornwall Council election

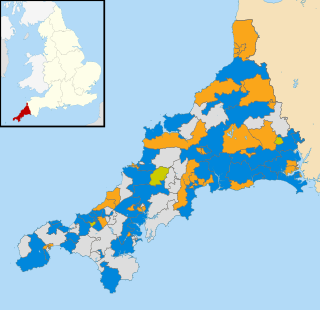
The Cornwall Council election, 2009, was an election for all 123 seats on the council. Cornwall Council is a unitary authority that covers the majority of the ceremonial county of Cornwall, with the exception of the Isles of Scilly which have an independent local authority. The elections took place concurrently with other local elections across England and Wales as well as the UK component of the elections to the European Parliament. Cornwall had seen its district and county councils abolished, replaced by a single 123-member Cornish unitary authority, for which councillors were elected for a full term.

2009 Oxfordshire County Council election

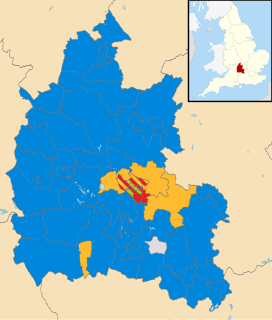
An election to Oxfordshire County Council took place on 4 June 2009 as part of the United Kingdom local elections, 2009, having been delayed from 7 May, to coincide with elections to the European Parliament. 73 councillors were elected from various electoral divisions, which returned either one, two or three county councillors each by first-past-the-post voting for a four-year term of office. The electoral divisions were the same as those used at the previous election in 2005.

2009 Staffordshire County Council election

Elections to Staffordshire County Council took place on 4 June 2009 as part of the United Kingdom local elections, 2009, having been delayed from 7 May, in order to coincide with elections to the European Parliament. 62 councillors were elected from the various electoral divisions, which returned either one or two county councillors each by first-past-the-post voting for a four-year term of office. The electoral divisions were the same as those used at the previous election in 2005. The council continues to be administered on the Leader and Cabinet model.

2009 Devon County Council election

An election to Devon County Council took place on 7 May 2009 as part of the United Kingdom local elections, 2009. The elections had been delayed from 7 May, to coincide with elections to the European Parliament. 62 councillors were elected from various electoral divisions, which returned either one or two county councillors each by first-past-the-post voting for a four-year term of office. The electoral divisions were the same as those used at the previous election in 2009. No elections were held in Plymouth and Torbay, which are unitary authorities outside the area covered by the County Council.

2010 Waltham Forest London Borough Council election

Elections for London Borough of Waltham Forest were held on 6 May 2010. The 2010 General Election and other local elections took place on the same day.

The 2012 City of Lincoln Council election took place on 3 May 2012 to elect one-third of the members of City of Lincoln Council in Lincolnshire, England, for a 4-year term of office. This was on the same day as other United Kingdom local elections, 2012.

2013 Lancashire County Council election

An election to Lancashire County Council took place on 2 May 2013 as part of the United Kingdom local elections, 2013. 84 councillors were elected from single-member electoral divisions by first-past-the-post for a four-year term of office. Electoral divisions were the same as those at the previous election in 2009. Elections were held in all electoral divisions across the present ceremonial county, excepting Blackpool and Blackburn with Darwen which are unitary authorities in a similar way to Greater Manchester and most of Merseyside. The election saw the Conservative Party lose overall control of the council, instead overtaken in number of seats by the Labour Party, without any absolute majority.

2013 North Yorkshire County Council election

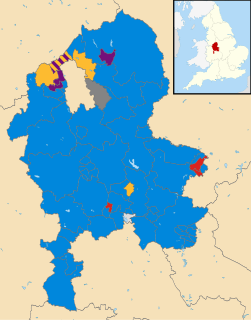
An election to North Yorkshire County Council took place on 2 May 2013 as part of the United Kingdom local elections, 2013. 72 councillors were elected from 68 electoral divisions, which returned either one or two county councillors each by first-past-the-post voting for a four-year term of office. The four divisions which elected two members were Harrogate Bilton & Nidd Gorge, Harrogate Central, Knaresborough, and Selby Barlby. The electoral divisions were the same as those used at the previous election in 2009. The election saw the Conservative Party maintain overall control of the council.

2013 Cumbria County Council election

An election to Cumbria County Council took place on 2 May013 as part of the United Kingdom local elections, 2013. All 84 councillors were elected from electoral divisions which returned one county councillor each by first-past-the-post voting for a four-year term of office. Following an electoral review carried out by the Local Government Boundary Commission for England, newly drawn electoral divisions were used without change in the number of county councillors.

2013 Leicestershire County Council election

An election to Leicestershire County Council took place on 2 May 2013 as part of the United Kingdom local elections, 2013. 55 councillors were elected from 52 electoral divisions, which returned either one or two county councillors each by first-past-the-post voting for a four-year term of office. The Conservatives held control of the council with a reduced majority of 5 seats. Despite a strong challenge from UKIP, the party only gained 2 seats whilst the Liberal Democrats lost one seat and Labour recouped some of their 2009 losses, gaining 6 seats.

2013 Worcestershire County Council election

An election to Worcestershire County Council took place on 2 May 2013 as part of the United Kingdom local elections, 2013. 57 councillors were elected from 53 electoral divisions, which returned either one or two county councillors each by first-past-the-post voting for a four-year term of office. The divisions were the same as those used at the previous election in 2009. The election saw the Conservative Party retain overall control of the council with a significantly reduced majority of just 2 seats.

2013 Lincolnshire County Council election

An election to Lincolnshire County Council took place on 2 May 2013 as part of the United Kingdom local elections, 2013. 77 electoral divisions returned one county councillor each by first-past-the-post voting for a four-year term of office. The electoral divisions were the same as those used at the previous election in 2009. No elections were held in North Lincolnshire or North East Lincolnshire, which are unitary authorities outside the area covered by the County Council.

2013 Essex County Council election

An election to Essex County Council took place on 2 May 2013 as part of the United Kingdom local elections, 2013. 75 councillors were elected from 70 electoral divisions, which returned either one or two county councillors each by first-past-the-post voting for a four-year term of office. The electoral divisions were the same as those used at the previous election in 2009. No elections were held in Thurrock or Southend-on-Sea, which are unitary authorities outside the area covered by the County Council.

2013 Staffordshire County Council election

An election to Staffordshire County Council took place on 2 May 2013 as part of the United Kingdom local elections, 2013. 62 electoral divisions returned one county councillor each by first-past-the-post voting for a four-year term of office. Following a boundary review, new electoral division boundaries were established for this election. No elections were held in Stoke-on-Trent, which is a unitary authority outside the area covered by the County Council. The council continues to be administered on the Leader and Cabinet model.

2013 Suffolk County Council election

Elections to Suffolk County Council took place on 2 May 2013 as part of the United Kingdom local elections, 2013. 75 councillors were elected from 63 electoral divisions, which returned either one or two county councillors each by first-past-the-post voting for a four-year term of office. The electoral divisions were the same as those used at the previous election in 2009.

Council elections for the City of Preston, Lancashire were held on 22 May 2014 as part of the 2014 United Kingdom local elections. The elections have been moved from earlier on in May to coincide with the North West component of the 2014 European Parliament election. Nineteen electoral wards were fought with those councillors elected in the corresponding elections in 2010 defending their seats due to the "in thirds" system employed in Preston local elections. The previous elections to Preston council occurred in 2012 but due to the "in thirds" system employed by Preston council, councillors are elected for four-year terms. This means gains, losses, and vote share comparisons this year are with those fought in 2010.

2014 Harrogate Borough Council election

Elections to Harrogate Borough Council were held on 22 May 2014. A third of the council was up for election, with voting only in the urban wards of Harrogate, Knaresborough and Ripon. The elections were held on the same day as the British local elections and the European Parliament elections. Each ward up for election returned a councillor for a four-year term of office.

2014 Waltham Forest London Borough Council election

The 2014 Waltham Forest Council election took place on 22 May 2014 to elect members of Waltham Forest Council in England. This was on the same day as other local elections.

2017 Derbyshire County Council election

An election to Derbyshire County Council took place on 4 May 2017 as part of the United Kingdom local elections, 2017. 64 councillors were elected from 61 electoral divisions which returned either one or two county councillors each by first-past-the-post voting for a four-year term of office. No elections were held in the City of Derby, which is a unitary authority outside the area covered by the County Council. The Conservative Party won back control of the council, taking thirty-seven of the authority's sixty-four seats.

2017 Gloucestershire County Council election

The 2017 Gloucestershire County Council election took place on 4 May 2017 as part of the 2017 local elections in the United Kingdom. All 53 councillors were elected from electoral divisions which returned one county councillor each by first-past-the-post voting for a four-year term of office. Control of the council went from a Conservative Party minority to a majority administration.

References

  1. "The Representation of the People (Form of Canvass) (England and Wales) Regulations 2006, Schedule Part 1". Legislation.gov.uk. 13 October 2011. Retrieved 18 April 2012.
  2. "I have two homes. Can I register at both addresses?". The Electoral Commission. Retrieved 5 January 2011.
  3. "Election Results". London Councils. 8 May 2010. Retrieved 27 May 2010.