Welwyn Hatfield District Council election, 2006

Last updated

The 2006 Welwyn Hatfield District Council election took place on 4 May 2006 to elect members of Welwyn Hatfield District Council in Hertfordshire, England. One third of the council was up for election and the Conservative party stayed in overall control of the council. [1]

Welwyn Hatfield Borough & Non-metropolitan district in England

The Borough of Welwyn Hatfield is a local government district in southern Hertfordshire, England.

Hertfordshire County of England

Hertfordshire is one of the home counties in England. It is bordered by Bedfordshire and Cambridgeshire to the north, Essex to the east, Greater London to the south, and Buckinghamshire to the west. For government statistical purposes, it is placed in the East of England region.

England Country in north-west Europe, part of the United Kingdom

England is a country that is part of the United Kingdom. It shares land borders with Wales to the west and Scotland to the north-northwest. The Irish Sea lies west of England and the Celtic Sea lies to the southwest. England is separated from continental Europe by the North Sea to the east and the English Channel to the south. The country covers five-eighths of the island of Great Britain, which lies in the North Atlantic, and includes over 100 smaller islands, such as the Isles of Scilly and the Isle of Wight.

Contents

After the election, the composition of the council was

Conservative Party (UK) Political party in the United Kingdom

The Conservative Party, officially the Conservative and Unionist Party, is a centre-right political party in the United Kingdom. The governing party since 2010, it is the largest in the House of Commons, with 313 Members of Parliament, and also has 249 members of the House of Lords, 18 members of the European Parliament, 31 Members of the Scottish Parliament, 12 members of the Welsh Assembly, eight members of the London Assembly and 8,916 local councillors.

The Labour Party is a centre-left political party in the United Kingdom that has been described as an alliance of social democrats, democratic socialists and trade unionists. The party's platform emphasises greater state intervention, social justice and strengthening workers' rights.

Liberal Democrats (UK) Political party in the United Kingdom

The Liberal Democrats are a liberal political party in the United Kingdom. It is currently led by Vince Cable. They have 11 Members of Parliament in the House of Commons, 96 members of the House of Lords, one member of the European Parliament, five Members of the Scottish Parliament and one member in the Welsh Assembly and London Assembly. At the height of its influence, the party formed a coalition government with the Conservative Party from 2010 to 2015 with its leader Nick Clegg serving as Deputy Prime Minister.

Election result

The results saw the Conservatives increase their majority on the council to 16 seats after gaining 2 seats from Labour. [3] The Conservative gains came in Haldens and Howlands wards, but they did lose one seat to the Liberal Democrats. [3] The Liberal Democrats won Handside and came within 6 votes of taking Peartree from Labour after 4 recounts. [3] Overall turnout in the election was 38.11%. [4]

Voter turnout percentage of eligible voters who cast a ballot in an election

Voter turnout is the percentage of eligible voters who cast a ballot in an election. Eligibility varies by country, and the voting-eligible population should not be confused with the total adult population. Age and citizenship status are often among the criteria used to determine eligibility, but some countries further restrict eligibility based on sex, race, or religion.

Welwyn Hatfield Local Election Result 2006 [2] [4]
PartySeatsGainsLossesNet gain/lossSeats %Votes %Votes+/−
  Conservative 1321+176.555.815,617+8.4%
  Labour 302-217.622.56,309-4.0%
  Liberal Democrat 110+15.921.15,898-2.9%
  Green 000000.6174+0.1%

Ward results

Brookmans Park and Little Heath [3] [4]
PartyCandidateVotes%±
Conservative John Dean1,63080.4+6.5
Liberal Democrat Jennifer Blumsom28614.1-3.1
Labour Margaret White1115.5-3.4
Majority1,34466.3+9.6
Turnout 2,02745.5-2.0
Conservative hold Swing
Haldens [3] [4]
PartyCandidateVotes%±
Conservative Martyn Levitt64141.7+6.9
Labour Bhavna Joshi52033.8-4.6
Liberal Democrat Win Smith37724.5-2.3
Majority1217.9
Turnout 1,53835.5-1.1
Conservative gain from Labour Swing
Handside [3] [4]
PartyCandidateVotes%±
Liberal Democrat Nigel Quinton1,12745.0-0.5
Conservative Sue Collins1,10344.1+0.5
Labour Sarah Carthew27310.9+0.0
Majority240.9-1.0
Turnout 2,50350.0-5.0
Liberal Democrat gain from Conservative Swing
Hatfield Central [3] [4]
PartyCandidateVotes%±
Labour Colin Croft52141.1+6.6
Conservative Douglas Berry42533.5+5.3
Liberal Democrat Lis Meyland-Smith32225.4-11.9
Majority967.6
Turnout 1,26831.4-1.3
Labour hold Swing
Hatfield East [3] [4]
PartyCandidateVotes%±
Conservative Nicola Dorrington82656.1+4.9
Liberal Democrat Roger Cashmore32422.0+2.9
Labour Constance Elliott32221.9+0.1
Majority50234.1+4.7
Turnout 1,47237.1-3.3
Conservative hold Swing
Hatfield North [3] [4]
PartyCandidateVotes%±
Conservative Clare Berry1,08155.1+11.4
Labour Anthony Wilder53527.3-10.0
Liberal Democrat Richard Griffiths34517.6-1.4
Majority54627.8+21.4
Turnout 1,96132.4-4.2
Conservative hold Swing
Hatfield West [3] [4]
PartyCandidateVotes%±
Conservative Nicholas Atkinson75749.7+4.5
Labour Dean Archer53134.9+2.8
Liberal Democrat Simon Archer23515.4-7.4
Majority22614.8+1.7
Turnout 1,52337.7-1.5
Conservative hold Swing
Hollybush [3] [4]
PartyCandidateVotes%±
Labour Margarita Birleson61744.8-1.5
Conservative Stephen Battaglia52137.8+3.8
Liberal Democrat Hazel Jacquemain23917.4-2.4
Majority967.0-5.3
Turnout 1,37730.7-4.5
Labour hold Swing
Howlands [3] [4]
PartyCandidateVotes%±
Conservative Warren Davies82145.7+6.9
Labour Alan Chesterman63435.3-2.8
Green Mark Knight1749.7+9.7
Liberal Democrat Jonathan Arch1679.3-13.7
Majority18710.4+9.7
Turnout 1,79641.1+0.9
Conservative gain from Labour Swing
Northaw [3] [4]
PartyCandidateVotes%±
Conservative John Nicholls1,45582.2+20.8
Liberal Democrat Nigel Bain20311.5+2.7
Labour Alex Breed1116.3+0.6
Majority1,25270.7+33.4
Turnout 1,76942.4-1.1
Conservative hold Swing
Panshanger [3] [4]
PartyCandidateVotes%±
Conservative Sara Johnston90456.8+10.2
Labour William Longbottom40925.7-1.1
Liberal Democrat Marcel Naseby27917.5-9.2
Majority49531.1+11.3
Turnout 1,59233.5-2.2
Conservative hold Swing
Peartree [3] [4]
PartyCandidateVotes%±
Labour Jacqueline Russell45336.5-8.8
Liberal Democrat Frank Marsh44736.0+5.8
Conservative Bernard Rosewall34127.5+3.0
Majority60.5-14.6
Turnout 1,24127.3-3.1
Labour hold Swing
Sherrards [3] [4]
PartyCandidateVotes%±
Conservative Christine Wheeler1,10054.5+10.2
Labour Margaret Hurst57128.3-8.8
Liberal Democrat Louise Lotz34617.2-1.4
Majority52926.2-25.4
Turnout 2,01747.3-4.3
Conservative hold Swing
Welham Green [3] [4]
PartyCandidateVotes%±
Conservative Peter O'Brien70766.6+0.0
Labour Bridgit Croft19818.7+1.3
Liberal Democrat Sheila Archer15614.7-1.3
Majority50947.9-1.3
Turnout 1,06138.1-3.0
Conservative hold Swing
Welwyn North [3] [4]
PartyCandidateVotes%±
Conservative Steven Markiewicz98772.3+7.6
Liberal Democrat Helen Bassett24117.6-4.1
Labour Anthony Crump13810.1-3.5
Majority74654.7+11.7
Turnout 1,36639.5-3.7
Conservative hold Swing
Welwyn South (2) [3] [4]
PartyCandidateVotes%±
Conservative Mandy Perkins1,183
Conservative Carl Storer1,135
Liberal Democrat John Blackburn408
Liberal Democrat Ian Skidmore396
Labour Sheila Jones191
Labour Sheila Wilder174
Turnout 3,48742.0-5.4
Conservative hold Swing

Related Research Articles

2006 St Albans City and District Council election

The 2006 St Albans City and District Council election took place on 4 May 2006 to elect members of St Albans District Council in Hertfordshire, England. One third of the council was up for election and the Liberal Democrats gained overall control of the council from no overall control.

2006 Wyre Forest District Council election

The 2006 Wyre Forest District Council election took place on 4 May 2006 to elect members of Wyre Forest District Council in Worcestershire, England. One third of the council was up for election and the council stayed under no overall control.

2008 Wyre Forest District Council election

The 2008 Wyre Forest District Council election took place on 1 May 2008 to elect members of Wyre Forest District Council in Worcestershire, England. One third of the council was up for election and the Conservative party gained overall control of the council from no overall control.

The 2002 Worcester City Council election took place on 2 May 2002 to elect members of Worcester District Council in Worcestershire, England. One third of the council was up for election and the council stayed under no overall control.

The 2010 Winchester Council election took place on 6 May 2010 to elect members of Winchester District Council in Hampshire, England. One third of the council was up for election and the Liberal Democrats gained overall control of the council from the Conservative party.

2006 Winchester City Council election

The 2006 Winchester Council election took place on 4 May 2006 to elect members of Winchester District Council in Hampshire, England. One third of the council was up for election and the Conservative party gained overall control of the council from no overall control.

The 1999 Welwyn Hatfield District Council election took place on 6 May 1999 to elect members of Welwyn Hatfield District Council in Hertfordshire, England. The whole council was up for election with boundary changes since the last election in 1998 increasing the number of seats by one. The Conservative party gained overall control of the council from the Labour party. Overall turnout in the election was 33.09%.

The 2000 Welwyn Hatfield District Council election took place on 6 May 2000 to elect members of Welwyn Hatfield District Council in Hertfordshire, England. One third of the council was up for election and the Labour party gained overall control of the council from no overall control. Overall turnout in the election was 31.71%, down from 33.09% in the 1999 election.

The 2002 Welwyn Hatfield District Council election took place on 2 May 2002 to elect members of Welwyn Hatfield District Council in Hertfordshire, England. One third of the council was up for election and the Conservative party gained overall control of the council from the Labour party.

The 2003 Welwyn Hatfield District Council election took place on 1 May 2003 to elect members of Welwyn Hatfield District Council in Hertfordshire, England. One third of the council was up for election and the Conservative party stayed in overall control of the council.

The 2004 Welwyn Hatfield District Council election took place on 10 June 2004 to elect members of Welwyn Hatfield District Council in Hertfordshire, England. One third of the council was up for election and the Conservative party stayed in overall control of the council.

The 2007 Welwyn Hatfield Borough Council election took place on 3 May 2007 to elect members of Welwyn Hatfield Borough Council in Hertfordshire, England. One third of the council was up for election and the Conservative party stayed in overall control of the council.

The 2008 Welwyn Hatfield Borough Council election took place on 1 May 2008 to elect members of Welwyn Hatfield Borough Council in Hertfordshire, England. The whole council was up for election with boundary changes since the last election in 2007. The Conservative party stayed in overall control of the council.

The 1999 Stratford-on-Avon District Council election took place on 6 May 1999 to elect members of Stratford-on-Avon District Council in Warwickshire, England. One third of the council was up for election and the council stayed under no overall control.

2006 Stratford-on-Avon District Council election

The 2006 Stratford-on-Avon District Council election took place on 4 May 2006 to elect members of Stratford-on-Avon District Council in Warwickshire, England. One third of the council was up for election and the Conservative party stayed in overall control of the council.

1979 United Kingdom local elections

Local elections were held in the United Kingdom on 3 May 1979. The results provided some source of comfort to the Labour Party (UK), who recovered some lost ground from local election reversals in previous years, despite losing the general election to the Conservative Party on the same day.

The 2003 Rushmoor Council election took place on 1 May 2003 to elect members of Rushmoor Borough Council in Hampshire, England. One third of the council was up for election and the Conservative party stayed in overall control of the council.

2006 Swindon Borough Council election

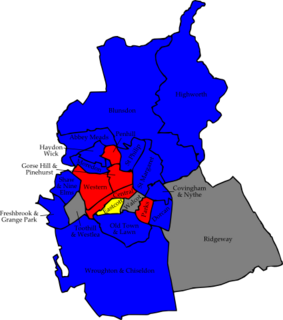
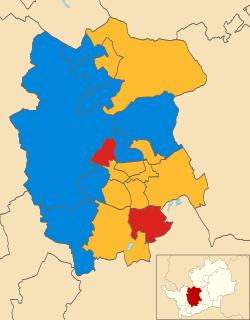
The 2006 Swindon Borough Council election took place on 4 May 2006 to elect members of Swindon Unitary Council in Wiltshire, England. One third of the council was up for election and the Conservative party stayed in overall control of the council.

2003 Solihull Metropolitan Borough Council election

The 2003 Solihull Metropolitan Borough Council election took place on 1 May 2003 to elect members of Solihull Metropolitan Borough Council in the West Midlands, England. One third of the council was up for election and the Conservative party stayed in overall control of the council.

2010 Sunderland City Council election

The 2010 Sunderland Council election took place on 6 May 2010 to elect members of Sunderland Metropolitan Borough Council in Tyne and Wear, England. One third of the council was up for election and the Labour party stayed in overall control of the council. The election took place on the same day as the 2010 General Election.

References

  1. "Local elections: Welwyn Hatfield". BBC News Online . Retrieved 2010-03-08.
  2. 1 2 "Local elections". The Times. 2006-05-05. p. 9.
  3. 1 2 3 4 5 6 7 8 9 10 11 12 13 14 15 16 17 18 19 "Welwyn Hatfield: Tories tighten grip". This is Local London . 2006-05-05. Retrieved 2010-03-09.
  4. 1 2 3 4 5 6 7 8 9 10 11 12 13 14 15 16 17 18 "Election Results - 4 May 2006". Welwyn Hatfield Borough Council. Retrieved 2010-03-08.