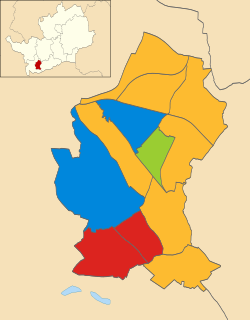
Elections to Watford Borough Council were held on 3 May 2012. Three years in every four, a third of the council (12 councillors) retires and elections are held (in the fourth year, elections are held for county councillors).
Watford is a town and borough in Hertfordshire, England, 15 miles (24 km) northwest of central London.
In this council election, the Labour Party gained two seats from the Liberal Democrats; the Liberal Democrats gained one from the Conservatives. However, the Liberal Democrats remained firmly in control of the council. Four parties, Liberal Democrats, Labour, Conservative and Green, all put up candidates in every seat. There were also three UKIP candidates.
The Liberal Democrats are a liberal political party in the United Kingdom. It is currently led by Vince Cable. They have 11 Members of Parliament in the House of Commons, 96 members of the House of Lords, one member of the European Parliament, five Members of the Scottish Parliament and one member in the Welsh Assembly and London Assembly. At the height of its influence, the party formed a coalition government with the Conservative Party from 2010 to 2015 with its leader Nick Clegg serving as Deputy Prime Minister.
In the year following this election there will not be elections to the Borough Council (apart from by-elections) and Hertfordshire County elections will be held in May 2013. In the years 2010 to 2012, although the Labour Party recovered from its worst position, in 2010, it has only won seats in its three strongest wards and has yet to challenge the Liberal Democrats grip on votes and power. Labour has, however, supplanted the Conservatives as the main opposition party (albeit still 15 seats short of the Liberal Democrats) and the Greens continue to hold their own in Callowland ward, pushing the Conservatives into the smallest party position.
After the election, the composition of the council was: [1]
The Labour Party is a centre-left political party in the United Kingdom that has been described as an alliance of social democrats, democratic socialists and trade unionists. The party's platform emphasises greater state intervention, social justice and strengthening workers' rights.
The Green Party of England and Wales is a green, left-wing political party in England and Wales. Headquartered in London, since September 2018, its co-leaders are Siân Berry and Jonathan Bartley. The Green Party has one representative in the House of Commons, one in the House of Lords, and three in the European Parliament. In addition, it has various councillors in UK local government and two members of the London Assembly.
The Conservative Party, officially the Conservative and Unionist Party, is a centre-right political party in the United Kingdom. The governing party since 2010, it is the largest in the House of Commons, with 313 Members of Parliament, and also has 249 members of the House of Lords, 18 members of the European Parliament, 31 Members of the Scottish Parliament, 12 members of the Welsh Assembly, eight members of the London Assembly and 8,916 local councillors.
Party | Seats | Gains | Losses | Net gain/loss | Seats % | Votes % | Votes | +/− | |
---|---|---|---|---|---|---|---|---|---|
Liberal Democrat | 8 | 1 | 2 | -1 | 66.7 | 41.3 | 8378 | ||
Labour | 3 | 2 | - | +2 | 25.0 | 28.6 | 5799 | ||
Conservative | 0 | - | -1 | -1 | 18.2 | 3699 | |||
Green | 1 | - | - | - | 8.3 | 10.2 | 2073 | ||
UKIP | 1.8 | 358 |
Party | Candidate | Votes | % | ± | |
---|---|---|---|---|---|
Green | Ian Brandon | 793 | 53.7 | -4.9 | |
Labour | Guru Awasthi | 415 | 28.1 | +5.6 | |
Conservative | Sally Anne Punter | 147 | 10.0 | -2.1 | |
Liberal Democrat | Patricia Gollop | 121 | 8.2 | +1.4 | |
Majority | 378 | 25.6 | |||
Turnout | 1476 | 26.50 | |||
Green hold | Swing |
Party | Candidate | Votes | % | ± | |
---|---|---|---|---|---|
Liberal Democrat | Rabi Martins | 816 | 47.6 | +5.5 | |
Labour | Fred Grindrod | 532 | 31.0 | -5.1 | |
Conservative | Carole Ann Bamford | 186 | 10.8 | -2.2 | |
Green | Su Murray | 106 | 6.2 | +0.7 | |
UKIP | Renie Price | 76 | 4.4 | +1.1 | |
Majority | 284 | 16.6 | |||
Turnout | 1716 | 27.15 | |||
Liberal Democrat hold | Swing |
Party | Candidate | Votes | % | ± | |
---|---|---|---|---|---|
Labour | Matt Turmaine | 1016 | 62.9 | -5.5 | |
Liberal Democrat | Mohammed Umar | 306 | 19.0 | +3.1 | |
Conservative | Neil John Punter | 165 | 10.2 | -1.5 | |
Green | Nigel Anthony Filer | 127 | 7.9 | +3.9 | |
Majority | 710 | 44.0 | |||
Turnout | 1614 | 26.15 | |||
Labour gain from Liberal Democrat | Swing | ||||
Party | Candidate | Votes | % | ± | |
---|---|---|---|---|---|
Labour | Anne Joynes | 784 | 45.1 | +9.8 | |
Liberal Democrat | Dennis Wharton | 536 | 30.8 | +11.0 | |
Green | Alison Jane Wiesner | 239 | 13.8 | -1.0 | |
Conservative | Youseffe Fahmy | 179 | 10.3 | -19.8 | |
Majority | 248 | 14.3 | |||
Turnout | 1738 | 31.76 | |||
Labour gain from Liberal Democrat | Swing | ||||
Party | Candidate | Votes | % | ± | |
---|---|---|---|---|---|
Liberal Democrat | Jan Brown | 690 | 43.0 | -0.6 | |
Labour | Seamus Williams | 445 | 27.7 | -0.8 | |
UKIP | Nicholas Richard Lincoln | 198 | 12.3 | +12.3 | |
Conservative | Penelope Anne Mortimer | 196 | 12.2 | -10.7 | |
Green | Paula Mary Evelyn Brodhurst | 75 | 4.7 | -0.2 | |
Majority | 245 | 15.3 | |||
Turnout | 1604 | 27.51 | |||
Liberal Democrat hold | Swing |
Party | Candidate | Votes | % | ± | |
---|---|---|---|---|---|
Liberal Democrat | Mark John Hofman | 983 | 42.8 | -2.6 | |
Conservative | Andrew Graham Mortimer | 931 | 40.5 | +4.2 | |
Labour | Michael Harry Barnes | 217 | 9.4 | -2.3 | |
Green | Sally Rose Ivins | 168 | 7.3 | +0.7 | |
Majority | 52 | 2.3 | |||
Turnout | 2299 | 37.74 | |||
Liberal Democrat gain from Conservative | Swing | ||||
Party | Candidate | Votes | % | ± | |
---|---|---|---|---|---|
Liberal Democrat | Peter Taylor | 1058 | 63.2 | +8.0 | |
Conservative | Dick Bamford | 301 | 18.0 | -4.7 | |
Labour | Sue Sleeman | 244 | 14.6 | -1.7 | |
Green | Eric Weatherly | 72 | 4.3 | -1.6 | |
Majority | 757 | 45.2 | |||
Turnout | 1675 | 32.01 | |||
Liberal Democrat hold | Swing |
Party | Candidate | Votes | % | ± | |
---|---|---|---|---|---|
Liberal Democrat | George Derbyshire | 1168 | 47.7 | +4.4 | |
Conservative | Linda Ann Topping | 863 | 35.3 | -3.4 | |
Labour | David Corbet Connal | 234 | 9.6 | -1.4 | |
Green | Dorothy Mary Nixon | 99 | 4.0 | -0.4 | |
UKIP | David Penn | 84 | 3.4 | +0.9 | |
Majority | 305 | 12.5 | |||
Turnout | 2448 | 40.47 | |||
Liberal Democrat hold | Swing |
Party | Candidate | Votes | % | ± | |
---|---|---|---|---|---|
Liberal Democrat | Tim Williams | 885 | 58.6 | +5.9 | |
Labour | Mark John Nicholas | 289 | 19.1 | +2.0 | |
Conservative | Chris Hawes | 259 | 17.1 | -8.0 | |
Green | George Mathew Ryan | 78 | 5.2 | +0.1 | |
Majority | 596 | 39.4 | |||
Turnout | 1511 | 28.03 | |||
Liberal Democrat hold | Swing |
Party | Candidate | Votes | % | ± | |
---|---|---|---|---|---|
Liberal Democrat | Darren Walford | 709 | 48.6 | +6.9 | |
Labour | Geoffrey Pearce | 326 | 22.3 | +0.4 | |
Conservative | Richard Lloyd Vaughan Southern | 323 | 22.1 | -0.9 | |
Green | Clare Victoria Pitkin | 101 | 6.9 | -0.8 | |
Majority | 383 | 26.3 | |||
Turnout | 1459 | 30.71 | |||
Liberal Democrat hold | Swing |
Party | Candidate | Votes | % | ± | |
---|---|---|---|---|---|
Labour | Mo Mills | 1044 | 59.4 | +9.3 | |
Liberal Democrat | Mehran Nawabi | 438 | 24.9 | -2.6 | |
Conservative | Dave Ealey | 171 | 9.7 | +0.5 | |
Green | Helen Elizabeth Wynne | 105 | 6.0 | +0.9 | |
Majority | 606 | 34.5 | |||
Turnout | 1758 | 29.95 | |||
Labour hold | Swing |
Party | Candidate | Votes | % | ± | |
---|---|---|---|---|---|
Liberal Democrat | Ian Gordon Brown | 668 | 44.6 | +3.8 | |
Conservative | Tony Rogers | 466 | 31.1 | +2.1 | |
Labour | Omar Ismail | 253 | 16.9 | -6.5 | |
Green | Christina Patricia Murphy | 110 | 7.3 | +0.6 | |
Majority | 202 | 13.5 | |||
Turnout | 1497 | 27.80 | |||
Liberal Democrat hold | Swing |
Guildford Council in Surrey, England is elected every four years.
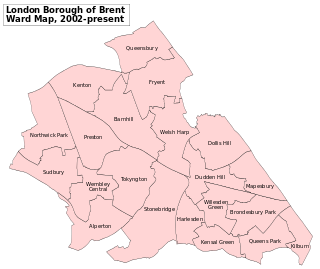
Brent London Borough Council in London, England is elected every four years. Since the last boundary changes in 2002, 63 councillors have been elected from 21 wards.
Elections to Slough Borough Council were held on 4 May 2006. One third of the council was up for election. This was the 121st Slough general local authority election since Slough became a local government unit in 1863.
Sefton Council is the governing body for the Metropolitan Borough of Sefton in Merseyside, north-western England. The council was under no overall control from the 1980s until 2012 when the Labour Party took control. It is a constituent council of Liverpool City Region Combined Authority.
Elections to the Borough Council in Slough, England, were held on 3 May 2007. One third of the council was up for election. This was the 122nd Slough general local authority election since Slough became a local government unit in 1863.
The 2007 council elections in Guildford saw the Conservatives retain control over Guildford Borough Council. Full results for each ward can be found at Guildford Council election, full results, 2007.
The 2007 Welwyn Hatfield Borough Council election took place on 3 May 2007 to elect members of Welwyn Hatfield Borough Council in Hertfordshire, England. One third of the council was up for election and the Conservative party stayed in overall control of the council.
The 2010 Barnet Council election took place on 6 May 2010 to elect members of Barnet London Borough Council in London, England. The whole council was up for election and the Conservative party stayed in overall control of the council.
The 1999 Sandwell Metropolitan Borough Council election took place on 6 May 1999 to elect members of Sandwell Metropolitan Borough Council in the West Midlands, England. One third of the council was up for election and the Labour party stayed in overall control of the council.
The eighth full elections for Guildford Borough Council took place on 6 May 1999.
The 2011 council elections in Guildford saw the Conservatives retain control over Guildford Borough Council with an increased majority of 20 seats. Full results for each ward can be found at Guildford Council election, full results, 2011.
The 2011 Sunderland Council election took place on 5 May 2011 to elect members of Sunderland Metropolitan Borough Council in Tyne and Wear, England. One third of the council was up for election and the Labour party stayed in overall control of the council.
Elections to Watford Borough Council were held on 6 May 2010. Three years in every four, a third of the council retires and elections are held. The council election was held on the same day as the national General Election, when the Labour Party government lost power and the Watford parliamentary constituency was won by the Conservative Party.
Elections to Watford Borough Council in England were held on 5 May 2011. Three years in every four, a third of the council retires and elections are held.
The 2012 Pendle Borough Council election took place on 3 May 2012 to elect members of Pendle Borough Council in Lancashire, England. One third of the council was up for election and the council stayed under no overall control.
The 2014 Havant Borough Council election took place on 22 May 2014 to elect members of Havant Borough Council in Hampshire, England. One third of the council was up for election and the Conservative party stayed in overall control of the council.
The 2014 Brent London Borough Council election took place on 22 May 2014 to elect members of Brent London Borough Council in London, England. The whole council was up for election and the Labour Party stayed in overall control of the council.
The 2012 St Helens Metropolitan Borough Council election took place on 3 May 2012 to elect members of St Helens Metropolitan Borough Council in Merseyside, England. One third of the council was up for election and the Labour party stayed in overall control of the council.
The 2015 Guildford Borough Council election took place on 7 May 2015 to elect members of Guildford Borough Council in England as one of the 2015 local elections, held simultaneously with the General Election.
The 2012 West Oxfordshire District Council election took place on 3 May 2012 to elect members of West Oxfordshire District Council in Oxfordshire, England. One third of the council was up for election and the Conservative party stayed in overall control of the council.