The 2008 Welwyn Hatfield Borough Council election took place on 1 May 2008 to elect members of Welwyn Hatfield Borough Council in Hertfordshire, England. The whole council was up for election with boundary changes since the last election in 2007. [1] The Conservative party stayed in overall control of the council. [2]
The Borough of Welwyn Hatfield is a local government district in southern Hertfordshire, England.
Borough status in the United Kingdom is granted by royal charter to local government districts in England, Wales and Northern Ireland. The status is purely honorary, and does not give any additional powers to the council or inhabitants of the district. In Scotland, similarly chartered communities were known as royal burghs, although the status is no longer granted.
Hertfordshire is one of the home counties in England. It is bordered by Bedfordshire and Cambridgeshire to the north, Essex to the east, Greater London to the south, and Buckinghamshire to the west. For government statistical purposes, it is placed in the East of England region.
The results saw the Conservatives hold on to control of the council with 40 seats, as compared to 5 for Labour and 3 for the Liberal Democrats. [2] Overall turnout in the election was 36.32%. [3]
The Labour Party is a centre-left political party in the United Kingdom that has been described as an alliance of social democrats, democratic socialists and trade unionists. The party's platform emphasises greater state intervention, social justice and strengthening workers' rights.
The Liberal Democrats are a liberal political party in the United Kingdom. It is currently led by Vince Cable. They have 11 Members of Parliament in the House of Commons, 96 members of the House of Lords, one member of the European Parliament, five Members of the Scottish Parliament and one member in the Welsh Assembly and London Assembly. At the height of its influence, the party formed a coalition government with the Conservative Party from 2010 to 2015 with its leader Nick Clegg serving as Deputy Prime Minister.
Voter turnout is the percentage of eligible voters who cast a ballot in an election. Eligibility varies by country, and the voting-eligible population should not be confused with the total adult population. Age and citizenship status are often among the criteria used to determine eligibility, but some countries further restrict eligibility based on sex, race, or religion.
A few days after the election the new Conservative councillor for Hatfield Central, Darren Gilbert, was forced to resign after it was alleged that he had made up a claim that he had had cancer, meaning that a by-election had to be held. [4] [5]
A Councillor is a member of a local government council.
Hatfield is a town and civil parish in Hertfordshire, England, in the borough of Welwyn Hatfield. It had a population of 29,616 in 2001, and 39,201 at the 2011 Census. The settlement is of Saxon origin. Hatfield House, home of the Marquess of Salisbury, forms the nucleus of the old town. From the 1930s when de Havilland opened a factory until the 1990s when British Aerospace closed it, aircraft design and manufacture employed more people there than any other industry. Hatfield was one of the post-war New Towns built around London and has much modernist architecture from the period. The University of Hertfordshire is based there.
By-elections, also spelled bye-elections, are used to fill elected offices that have become vacant between general elections.
Party | Seats | Gains | Losses | Net gain/loss | Seats % | Votes % | Votes | +/− | |
---|---|---|---|---|---|---|---|---|---|
Conservative | 40 | +5 | 83.3 | 59.7 | 42,477 | +5.1% | |||
Labour | 5 | -5 | 10.4 | 19.4 | 13,810 | -5.7% | |||
Liberal Democrat | 3 | 0 | 6.3 | 18.2 | 12,930 | +1.5% | |||
Green | 0 | 0 | 0 | 2.6 | 1,851 | -1.0% | |||
BNP | 0 | 0 | 0 | 0.2 | 131 | +0.2% |
Party | Candidate | Votes | % | ± | |
---|---|---|---|---|---|
Conservative | Stephen Boulton | 1,708 | |||
Conservative | Irene Dean | 1,499 | |||
Conservative | John Dean | 1,476 | |||
Liberal Democrat | Jenny Blumson | 304 | |||
Labour | James Croft | 197 | |||
Turnout | 5,194 | 45.4 |
Party | Candidate | Votes | % | ± | |
---|---|---|---|---|---|
Conservative | Lauren Brown | 836 | |||
Conservative | Howard Hughes | 781 | |||
Conservative | Martyn Levitt | 778 | |||
Labour | Mike Larkins | 600 | |||
Labour | Mark Biddle | 582 | |||
Labour | Margaret Hurst | 573 | |||
Liberal Democrat | Edward Walkington | 220 | |||
Liberal Democrat | Rhoda Brutey | 219 | |||
Turnout | 4,589 | 34.1 |
Party | Candidate | Votes | % | ± | |
---|---|---|---|---|---|
Conservative | Helen Bromley | 1,385 | |||
Conservative | Fiona Thomson | 1,370 | |||
Liberal Democrat | Tony Skottowe | 1,338 | |||
Liberal Democrat | Adam Neal | 1,283 | |||
Liberal Democrat | Nigel Quinton | 1,278 | |||
Conservative | Tony Kingsbury | 1,221 | |||
Labour | Peter Heyman | 167 | |||
Labour | John Pomroy | 159 | |||
Turnout | 8,201 | 55.9 |
Party | Candidate | Votes | % | ± | |
---|---|---|---|---|---|
Conservative | Darren Gilbert | 535 | |||
Labour | Mike Alder | 512 | |||
Labour | Colin Croft | 501 | |||
Conservative | David Falco | 484 | |||
Labour | Margaret White | 473 | |||
Conservative | Bukky Olawoyin | 463 | |||
Liberal Democrat | Adam Edwards | 211 | |||
Liberal Democrat | Heather Richardson | 188 | |||
Liberal Democrat | Karen Richardson | 177 | |||
Turnout | 3,544 | 28.5 |
Party | Candidate | Votes | % | ± | |
---|---|---|---|---|---|
Conservative | Mick Long | 934 | |||
Conservative | Bernard Sarson | 906 | |||
Conservative | Paul Smith | 889 | |||
Labour | Constance Elliott | 376 | |||
Labour | Sheila Jones | 358 | |||
Liberal Democrat | Lis Meyland-Smith | 348 | |||
Liberal Democrat | Jacqueline Brennan | 336 | |||
Labour | Susana Tinsley | 298 | |||
Turnout | 4,445 | 33.5 |
Party | Candidate | Votes | % | ± | |
---|---|---|---|---|---|
Conservative | Richard Hedges | 514 | |||
Conservative | David Hughes | 483 | |||
Labour | Linda Mendez | 409 | |||
Labour | Andrew Tinsley | 344 | |||
Liberal Democrat | Sheila Archer | 157 | |||
Liberal Democrat | Richard Griffiths | 121 | |||
Turnout | 2,028 | 28.2 |
Party | Candidate | Votes | % | ± | |
---|---|---|---|---|---|
Conservative | Clare Berry | 629 | |||
Conservative | Mark Gilding | 577 | |||
Conservative | Howard Morgan | 544 | |||
Labour | Mel Jones | 245 | |||
Labour | Susan Archer | 200 | |||
Labour | Ian Scammell | 197 | |||
Liberal Democrat | Alex Benakis | 129 | |||
Liberal Democrat | Maurice Richardson | 126 | |||
Turnout | 2,647 | 25.7 |
Party | Candidate | Votes | % | ± | |
---|---|---|---|---|---|
Conservative | Nick Atkinson | 976 | |||
Conservative | Kim Morris | 944 | |||
Conservative | Carol Juggins | 938 | |||
Labour | Maureen Cook | 669 | |||
Labour | Dee Ferner | 588 | |||
Labour | Cathy Watson | 525 | |||
Liberal Democrat | Hazel Laming | 381 | |||
Liberal Democrat | James Finlay | 298 | |||
Liberal Democrat | Sheila Tidy | 272 | |||
Turnout | 5,591 | 33.5 |
Party | Candidate | Votes | % | ± | |
---|---|---|---|---|---|
Labour | Lynn Chesterman | 610 | |||
Conservative | Sarah Atkinson | 607 | |||
Labour | Margaret Birleson | 594 | |||
Conservative | Ronald Smith | 560 | |||
Labour | Sue Jones | 513 | |||
Conservative | Stuart Pile | 480 | |||
Liberal Democrat | Win Smith | 240 | |||
Turnout | 3,604 | 28.2 |
Party | Candidate | Votes | % | ± | |
---|---|---|---|---|---|
Conservative | Hannah Berry | 795 | |||
Conservative | Les Page | 725 | |||
Conservative | George Michaelides | 678 | |||
Green | Jill Weston | 596 | |||
Labour | Alan Chesterman | 443 | |||
Labour | Zacha Hennessey | 384 | |||
Labour | Brian Payne | 365 | |||
Green | Susan Groom | 325 | |||
Green | Ian Nendrick | 325 | |||
Liberal Democrat | Lynda Cowan | 168 | |||
Turnout | 4,804 | 39.2 |
Party | Candidate | Votes | % | ± | |
---|---|---|---|---|---|
Conservative | Colin Couch | 1,235 | |||
Conservative | John Mansfield | 1,144 | |||
Conservative | John Nicholls | 1,143 | |||
Liberal Democrat | Nigel Bain | 329 | |||
Turnout | 3,851 | 36.3 |
Party | Candidate | Votes | % | ± | |
---|---|---|---|---|---|
Conservative | Sara Johnston | 916 | |||
Conservative | Darren Bennett | 884 | |||
Conservative | Roger Trigg | 844 | |||
Labour | Brian Edwards | 346 | |||
Green | Hollyann Holdsworth | 258 | |||
Liberal Democrat | Shirley Shaw | 247 | |||
Liberal Democrat | Jonquil Basch | 213 | |||
Turnout | 3,708 | 32.1 |
Party | Candidate | Votes | % | ± | |
---|---|---|---|---|---|
Liberal Democrat | Malcolm Cowan | 516 | |||
Liberal Democrat | Louise Lotz | 470 | |||
Labour | Steve Roberts | 453 | |||
Labour | Dean Milliken | 452 | |||
Liberal Democrat | Frank Marsh | 443 | |||
Labour | Jacqui Russell | 399 | |||
Conservative | Christopher Hay | 397 | |||
Conservative | Stanley Laver-Walton | 321 | |||
Conservative | Sandra Benjamin | 310 | |||
Turnout | 3,761 | 26.9 |
Party | Candidate | Votes | % | ± | |
---|---|---|---|---|---|
Conservative | Alan Franey | 1,015 | |||
Conservative | Jonathan Beckerman | 993 | |||
Conservative | Patricia Mabbott | 993 | |||
Labour | Bill Couzens | 470 | |||
Liberal Democrat | Jonathan Arch | 393 | |||
Labour | Tony Crump | 384 | |||
Liberal Democrat | Valerie Skottowe | 368 | |||
Green | Bernice Dowlen | 347 | |||
Turnout | 4,963 | 43.7 |
Party | Candidate | Votes | % | ± | |
---|---|---|---|---|---|
Conservative | Doug Berry | 754 | |||
Conservative | Keith Pieri | 752 | |||
Liberal Democrat | Simon Archer | 510 | |||
Liberal Democrat | Paul Zukowskyj | 411 | |||
BNP | Mark Fuller | 131 | |||
Labour | Bridgit Croft | 83 | |||
Turnout | 2,641 | 49.7 |
Party | Candidate | Votes | % | ± | |
---|---|---|---|---|---|
Conservative | Julie Cragg | 1,513 | |||
Conservative | Carl Storer | 1,457 | |||
Conservative | Steven Markiewicz | 1,425 | |||
Liberal Democrat | Janice Skidmore | 265 | |||
Liberal Democrat | June Burnham | 250 | |||
Labour | Julia Henderson | 226 | |||
Liberal Democrat | Jack Burnham | 215 | |||
Turnout | 5,351 | 41.7 |
Party | Candidate | Votes | % | ± | |
---|---|---|---|---|---|
Conservative | Andrew Canter | 840 | |||
Conservative | Mandy Perkins | 826 | |||
Liberal Democrat | John Blackburn | 269 | |||
Liberal Democrat | Ian Skidmore | 237 | |||
Labour | Mbizo Mpofu | 115 | |||
Turnout | 2,287 | 39.4 |
One third of Welwyn Hatfield Borough Council in Hertfordshire, England is elected each year, followed by one year without election. Since the last boundary changes in 2008, 48 councillors have been elected from 17 wards.
The 2008 Worcester City Council election took place on 1 May 2008 to elect members of Worcester District Council in Worcestershire, England. One third of the council was up for election and the council stayed under no overall control.
The 2008 Wokingham Borough Council election took place on 1 May 2008 to elect members of Wokingham Unitary Council in Berkshire, England. One third of the council was up for election and the Conservative party stayed in overall control of the council.
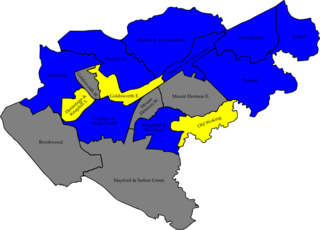
The 2007 Woking Council election took place on 3 May 2007 to elect members of Woking Borough Council in Surrey, England. One third of the council was up for election and the Conservative party gained overall control of the council from no overall control.
The 1999 Welwyn Hatfield District Council election took place on 6 May 1999 to elect members of Welwyn Hatfield District Council in Hertfordshire, England. The whole council was up for election with boundary changes since the last election in 1998 increasing the number of seats by one. The Conservative party gained overall control of the council from the Labour party. Overall turnout in the election was 33.09%.
The 2000 Welwyn Hatfield District Council election took place on 6 May 2000 to elect members of Welwyn Hatfield District Council in Hertfordshire, England. One third of the council was up for election and the Labour party gained overall control of the council from no overall control. Overall turnout in the election was 31.71%, down from 33.09% in the 1999 election.
The 2002 Welwyn Hatfield District Council election took place on 2 May 2002 to elect members of Welwyn Hatfield District Council in Hertfordshire, England. One third of the council was up for election and the Conservative party gained overall control of the council from the Labour party.
The 2003 Welwyn Hatfield District Council election took place on 1 May 2003 to elect members of Welwyn Hatfield District Council in Hertfordshire, England. One third of the council was up for election and the Conservative party stayed in overall control of the council.
The 2004 Welwyn Hatfield District Council election took place on 10 June 2004 to elect members of Welwyn Hatfield District Council in Hertfordshire, England. One third of the council was up for election and the Conservative party stayed in overall control of the council.
The 2006 Welwyn Hatfield District Council election took place on 4 May 2006 to elect members of Welwyn Hatfield District Council in Hertfordshire, England. One third of the council was up for election and the Conservative party stayed in overall control of the council.
The 2007 Welwyn Hatfield Borough Council election took place on 3 May 2007 to elect members of Welwyn Hatfield Borough Council in Hertfordshire, England. One third of the council was up for election and the Conservative party stayed in overall control of the council.
The 2007 Rushmoor Council election took place on 3 May 2007 to elect members of Rushmoor Borough Council in Hampshire, England. One third of the council was up for election and the Conservative party stayed in overall control of the council.
The 2008 Rushmoor Council election took place on 1 May 2008 to elect members of Rushmoor Borough Council in Hampshire, England. One third of the council was up for election and the Conservative party stayed in overall control of the council.
The 2010 Rushmoor Council election took place on 6 May 2010 to elect members of Rushmoor Borough Council in Hampshire, England. One third of the council was up for election and the Conservative party stayed in overall control of the council.
The 2008 Sunderland Council election took place on 1 May 2008 to elect members of Sunderland Metropolitan Borough Council in Tyne and Wear, England. One third of the council was up for election and the Labour party stayed in overall control of the council.
The 2008 Harrogate Council election took place on 1 May 2008 to elect members of Harrogate Borough Council in North Yorkshire, England. One third of the council was up for election and the council stayed under no overall control.
The 2010 Woking Council election took place on 1 May 2010, on the same day as the 2010 general election, to elect members of Woking Borough Council in Surrey, England. One third of the council was up for election and the council stayed under no overall control.
The 2010 Maidstone Borough Council election took place on 6 May 2010 to elect members of Maidstone Borough Council in Kent, England. One third of the council was up for election and the Conservative party stayed in overall control of the council.
The 2010 Brent London Borough Council election took place on 6 May 2010 to elect members of Brent London Borough Council in London, England. The whole council was up for election and the Labour party gained overall control of the council from no overall control.
The 2010 Swale Borough Council election took place on 6 May 2010 to elect members of Swale Borough Council in Kent, England. One third of the council was up for election and the Conservative party stayed in overall control of the council.