Monmouthshire County Council election, 2008

Last updated

Elections to Monmouthshire County Council were held on 1 May 2008. The whole council was up for election and the Conservative party held overall control of the council.

Monmouthshire County Council

Monmouthshire County Council is the governing body for the Monmouthshire principal area – one of the unitary authorities of Wales.

Conservative Party (UK) Political party in the United Kingdom

The Conservative Party, officially the Conservative and Unionist Party, is a centre-right political party in the United Kingdom. The governing party since 2010, it is the largest in the House of Commons, with 313 Members of Parliament, and also has 249 members of the House of Lords, 18 members of the European Parliament, 31 Members of the Scottish Parliament, 12 members of the Welsh Assembly, eight members of the London Assembly and 8,916 local councillors.

Contents

Election results: overview

Monmouthshire Local Election Result 2008
PartySeatsGainsLossesNet gain/lossSeats %Votes %Votes+/−
  Conservative 29 5 0 +5 67.44 47.15 12,879 +3.55%
  Liberal Democrat 5 2 0 +2 11.63 22.20 6,061 +4.03%
  Labour 7 2 4 -2 16.28 17.51 4,782 -2.43%
  Independent 1 0 4 -4 2.36 7.73 2,110 -6.59%
  Plaid Cymru 1 0 1 -1 2.36 4.75 1,296 +1.74%
  Green 0 0 0 = 0.00 0.64 175 +0.46%
  UKIP 0 0 0 = - - - -0.80%
Monmouthshire Local Election Result 2008 (wards in Monmouth constituency )
PartySeatsGainsLossesNet gain/lossSeats %Votes %Votes+/−
  Conservative 28 3 0 +3 80.00 52.50 11,746 +4.93%
  Liberal Democrat 4 1 0 +1 14.29 23.14 5,177 +1.47%
  Labour 3 0 1 -1 8.57 13.93 3,116 -2.79%
  Independent 1 0 3 -3 2.86 7.77 1,738 -5.32%
  Plaid Cymru 0 0 0 = 0.00 1.88 423 +1.15%
  Green 0 0 0 = 0.00 0.78 175 +0.56%
Monmouthshire Local Election Result 2008 (wards in Newport East constituency )
PartySeatsGainsLossesNet gain/lossSeats %Votes %Votes+/−
  Labour 4 2 2 = 50.00 33.81 1,666 -2.65%
  Conservative 2 1 0 +1 25.00 22.99 1,133 -0.80%
  Liberal Democrat 1 1 0 +1 12.50 17.94 884 +17.94%
  Plaid Cymru 1 0 1 -1 12.50 17.72 873 +2.90%
  Independent 0 0 1 -1 0.00 7.54 372 -13.14%
  Green 0 0 0 = 0.00 - - -
  UKIP 0 0 0 = - - - -4.97%

Electoral division (ward) results


Abergavenny, Cantref
PartyCandidateVotes%±
Conservative Paul Richard Jordan [1] 453 52.98 -4.22
Labour Margaret Harris 243 28.42 +12.47
Plaid Cymru John Walters 86 10.06 +10.06
Liberal Democrat Patricia (Pat) Morris 73 8.54 +8.54
Majority 210 24.56 -5.78
Turnout 855 51.01 -6.86
Conservative hold Swing -8.38

Abergavenny, Castle
PartyCandidateVotes%±
Conservative Maureen Powell [2] 370 45.48 -1.54
Independent Anthony (Tony) O'Donovan 283 33.61 +11.43
Labour Margaret E. Phillips 129 15.32 -1.48
Liberal Democrat Tony R. Potts 60 7.13 -3.46
Majority 87 10.33 -12.67
Turnout 842 53.35 -0.51
Conservative hold Swing -6.47

Abergavenny, Grofield
PartyCandidateVotes%±
Liberal Democrat Douglas L. Edwards [3] 431 70.89 +26.87
Conservative Nigel C. Beaven 122 20.07 -4.79
Plaid Cymru Mary Harris 55 9.05 +9.05
Majority 309 50.82 +31.66
Turnout 612 48.15 -8.80
Liberal Democrat hold Swing +15.83

Abergavenny, Lansdown
PartyCandidateVotes%±
Liberal Democrat James George [4] 359 53.03 +48.43
Labour Robin A. Griffiths 164 24.22 -16.50
Conservative Martin J. Hickman 112 16.54 -3.33
Independent Norma C. Watkins 30 4.43 -24.30
Plaid Cymru Laurie Jones 12 1.77 -4.31
Majority 195 28.81 +16.82
Turnout 677 43.63 +6.26
Liberal Democrat gain from Labour Swing +32.29

Abergavenny, Priory
PartyCandidateVotes%±
Conservative Jane P. Foulser [5] 423 67.04 +20.75
Liberal Democrat Caroline Duchet 208 32.96 +24.07
Majority 215 34.08 +16.16
Turnout 631 42.54 -3.4
Conservative hold Swing

Caerwent
PartyCandidateVotes%±
Conservative Philip (Phil) Murphy [6] 458 71.56 +16.15
Labour Julie Roberts 118 18.15 -17.81
Liberal Democrat Thomas (Tom) Sullivan 64 9.85 +1.66
Majority 430 34.08 +16.16
Turnout 640 46.14 -4.37
Conservative hold Swing +16.98

Chepstow, Larkfield
PartyCandidateVotes%±
Liberal Democrat Phylip (Phil) A. D. Hobson [7] 417 51.74 -1.82
Conservative Martin Brady 305 37.84 -8.60
Labour David Roman 84 10.42 +10.42
Majority 112 13.09 +6.78
Turnout 806 53.47 +0.80
Liberal Democrat hold Swing +3.89

Chepstow, St. Christopher's
PartyCandidateVotes%±
Conservative Stephanie M. Dovey [8] 205 35.10 +6.46
Liberal Democrat Henry Ashby 203 34.76 +22.03
Labour Pamela (Pam) Birchall 176 30.14 -10.06
Majority 2 0.34 n/a
Turnout 584 35.74 +1.04
Conservative gain from Labour Swing +8.26

Chepstow, St. Kingsmark
PartyCandidateVotes%±
Conservative David L. S. Dovey [9] 474 55.50 +8.30
Liberal Democrat Henry Hodges 270 31.62 -11.45
Labour Hilary M. Beach 110 12.88 +3.15
Majority 204 23.88 +19.75
Turnout 854 40.44 -4.91
Conservative hold Swing +9.88

Chepstow, St. Mary's
PartyCandidateVotes%±
Liberal Democrat Jacqueline (Jacqui) Sullivan [10] 362 58.96 +9.70
Conservative Benjamin (Ben) Smith 166 27.04 -4.69
Labour Thomas (Tom) P. Kirton 86 14.01 -5.00
Majority 196 31.92 +14.39
Turnout 614 45.09 +4.65
Liberal Democrat hold Swing +7.20

Chepstow, Thornwell
PartyCandidateVotes%±
Labour Armand C. Watts [11] 396 54.17 +0.03
Conservative Marian J. Lewis 234 32.01 -1.66
Liberal Democrat Anthony (Tony) Redhead 101 13.82 +1.63
Majority 162 22.16 +1.69
Turnout 731 39.74 +2.39
Labour hold Swing +0.85

Croesonen
PartyCandidateVotes%±
Labour Roger G. Harris [12] 308 51.94 +11.78
Conservative Laura L. Pike 219 36.93 +5.71
Liberal Democrat Charlotte Jones 66 11.13 +5.76
Majority 89 15.01 +6.07
Turnout 593 39.63 +0.00
Labour hold Swing +3.04

Crucorney
PartyCandidateVotes%±
Conservative Andrew C. James 469 -
Independent Robert (Bob) J. B. Wilcox 381 -
Liberal Democrat Nicholas (Nick) Tatam 65 -
Majority -
Turnout 917 57.89
Conservative gain from Independent Swing

Devauden
PartyCandidateVotes%±
Conservative Robert J. W. Greenland uncontested -
Majority - - -
Turnout - - -
Conservative hold Swing -

Goetre Fawr
PartyCandidateVotes%±
Conservative Bryan Jones 623 -
Plaid Cymru Edward H. Evans 235 -
Majority -
Turnout 871 47.00 -12.94
Conservative hold Swing

Llanbadoc
PartyCandidateVotes%±
Conservative Valerie (Val) E. Smith uncontested -
Conservative hold Swing -

Llanelly Hill (2)
PartyCandidateVotes%±
Independent Simon G. M. Howarth 887 -
Conservative Giles Howard 624 -
Independent Adrian Edwards 545 6.55 -
Independent Anthony (Tony) R. Carrington 458 -
Independent Martin L. Thomas 310 -
Turnout 52.17 +4.81
Independent hold Swing -
Conservative gain from Independent Swing

Llanfoist Fawr
PartyCandidateVotes%±
Conservative Eric Saxon 345 56.84 -13.22
Liberal Democrat Jan Shivel 261 43.16 +30.31
Majority 84 13.68 -39.29
Turnout 607 48.72 -6.96
Conservative hold Swing -21.77

Llangybi Fawr
PartyCandidateVotes%±
Conservative Peter R. Clarke Uncontested -
Conservative hold Swing -

Llanover
PartyCandidateVotes%±
Conservative Brian R. Hood 655 66.70 -9.01
Labour Margaret E. Willcock 205 20.88 +7.85
Liberal Democrat Tim Willott 118 12.02 +0.76
Majority 450 45.82 -16.86
Turnout 982 54.40 -1.92
Conservative hold Swing -8.43

Llantilio Crossenny
PartyCandidateVotes%±
Conservative Ruth Edwards 530 74.54 +32.73
Liberal Democrat Patrick Tandy 181 25.46 +17.57
Majority 349 49.08 +41.88
Turnout 711 51.82 -11.16
Conservative hold Swing +7.58

Llanwenarth Ultra
PartyCandidateVotes%±
Labour Christine Walby 276 50.27 +8.58
Conservative Owen W. M. Marsh 273 49.73 +23.55
Majority 3 9.56 -9.02
Turnout 562 51.28 56.32 -5.04
Labour hold Swing -7.49

Magor with Undy, Mill
PartyCandidateVotes%±
Conservative John Major 513 61.27 -3.55
Labour Neeta S. Baicher 206 24.58 -10.60
Liberal Democrat Paul Rutter 119 14.15 +14.15
Majority 307 36.69 +7.05
Turnout 838 39.59 -1.03
Conservative hold Swing +3.53


Magor with Undy, The Elms
PartyCandidateVotes%±
Conservative James Harris 334 42.82 +20.37
Independent Olive Evans 209 26.80 +26.80
Independent Brian A. Burt 159 20.39 +20.39
Liberal Democrat Ben Robbins 78 9.99 +9.99
Majority 125 16.02 +15.33
Turnout 782 33.00 -3.68
Conservative gain from Labour Swing +3.22

Mardy
PartyCandidateVotes%±
Conservative John Prosser 234 39.13 +2.95
Independent Ralph F. Chapman 175 29.26 +1.64
Labour Adrian J. G. Nelmes 120 20.07 -2.79
Plaid Cymru Stuart K. Neale 35 5.85 -0.61
Liberal Democrat Emily Robbins 34 5.69 -2.41
Majority 59 9.87 +1.31
Turnout 598 44.59 -2.23
Conservative hold Swing +0.66

Mitchel Troy
PartyCandidateVotes%±
Conservative Geoffrey (Geoff) C. Burrows 350 63.99 +10.39
Liberal Democrat Alison Willott 197 36.01 -10.39
Majority 153 27.98 +20.78
Turnout 548 58.54 +5.03
Conservative hold Swing +10.39

Monmouth, Dixton with Osbaston
PartyCandidateVotes%±
Conservative Bob Hayward 549 64.14 +16.70
Liberal Democrat Anthea M. Dewhurst 307 35.86 -16.70
Majority 242 28.28 +23.16
Turnout 861 47.54 -10.82
Conservative gain from Liberal Democrat Swing +16.70

Monmouth, Drybridge
PartyCandidateVotes%±
Conservative Alan M. Wintle 488 49.24 +2.58
Liberal Democrat Richard Bond 330 33.30 -6.43
Labour Maureen Roach 173 17.46 +17.46
Majority 158 15.94 +9.01
Turnout 1000 41.88 -1.55
Conservative hold Swing +4.51

Related Research Articles

English Democrats

The English Democrats is an English nationalist political party in England.

Guildford Council in Surrey, England is elected every four years.

Hertfordshire County Council in England is elected every four years. Since the last boundary changes, that took effect for the 2001 election, 77 councillors are elected for single member districts.

Elections to Monmouthshire County Council were held on 10 June 2004 on the same day of the European Elections.

The Broxbourne Council election, 2010 was held to elect council members of the Broxbourne Borough Council, a local government authority in Hertfordshire, England.

2008 Calderdale Metropolitan Borough Council election

Elections to Calderdale Metropolitan Borough Council were held on 1 May 2008. One third of the council was up for election and the council stayed under no overall control with a minority Conservative administration.

The 2007 council elections in Guildford saw the Conservatives retain control over Guildford Borough Council. Full results for each ward can be found at Guildford Council election, full results, 2007.
2010 Watford Borough Council election

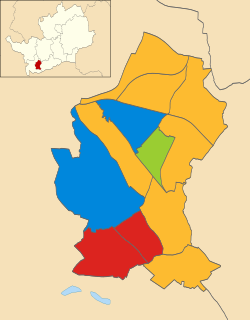
Elections to Watford Borough Council were held on 6 May 2010. Three years in every four, a third of the council retires and elections are held. The council election was held on the same day as the national General Election, when the Labour Party government lost power and the Watford parliamentary constituency was won by the Conservative Party.

2011 Watford Borough Council election

Elections to Watford Borough Council in England were held on 5 May 2011. Three years in every four, a third of the council retires and elections are held.

2013 Norfolk County Council election

The Norfolk County Council election took place across Norfolk on 2 May 2013, coinciding with local elections for all county councils in England. The results were announced the following day, Friday 3 May 2013. The result brought to an end 12 years of Conservative administration, who finished three seats short of a majority after losing 20 seats, leaving the Council in no overall control (NOC). UKIP and the Labour Party both made gains of 14 and 11 seats respectively. The Liberal Democrats and the Green Party both lost three seats each, whilst an independent won a single seat in North Norfolk.


The 2015 Ashfield District Council election took place on 7 May 2015, to elect members of Ashfield District Council in England. This was on the same day as other local elections.

2017 United Kingdom local elections

The 2017 United Kingdom local elections were held on Thursday 4 May 2017. Local elections were held across Great Britain, with elections to 35 English local authorities and all councils in Scotland and Wales.

2017 Norfolk County Council election

The 2017 Norfolk County Council election took place on 4 May 2017 as part of the 2017 local elections in the United Kingdom.

2017 Tees Valley mayoral election

The inaugural Tees Valley mayoral election was held on 4 May 2017 to elect the mayor of the Tees Valley Combined Authority. The mayor was elected by the supplementary vote system. Subsequent elections will be held in May 2020 and every four years after.

2017 Welsh local elections

Local elections were held in Wales on Thursday 4 May 2017 to elect members of all 22 local authorities, including the Isle of Anglesey, which was last up for election in 2013 due to having its elections delayed for a year. These local elections were held alongside local elections in Scotland and parts of England.
2018 Plymouth City Council election

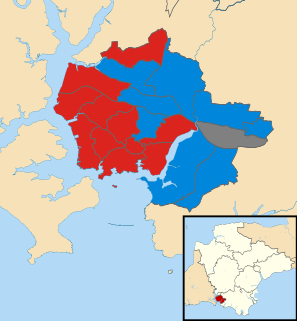
The 2018 Plymouth City Council election took place on 3 May 2018 to elect members of Plymouth City Council in England. The election was won by the Labour Party, who gained enough seats to achieve an overall majority and took control of the council.

2018 Wokingham Borough Council election

The 2018 Wokingham Borough Council election took place on Thursday 3 May 2018. That was the same day as other United Kingdom local elections in order to elect members of Wokingham Unitary Council in Berkshire, England. One third of the council was up for election and the Conservative party stayed comfortably in overall control of the council.

Drybridge (Monmouth ward)

Drybridge is an electoral ward in the town of Monmouth, Monmouthshire, Wales. The ward elects councillors to Monmouth Town Council and Monmouthshire County Council.

References

  1. http://www.monmouthshire.gov.uk/Monmouth/English/yourcouncil/Councillors_Meetings/Political_Groups/Conservative+Party/RPJordan.htm
  2. http://www.monmouthshire.gov.uk/Monmouth/English/yourcouncil/Councillors_Meetings/Political_Groups/Conservative+Party/MPowell.htm
  3. http://www.monmouthshire.gov.uk/Monmouth/English/yourcouncil/Councillors_Meetings/Political_Groups/Liberal+Democrat+Party/DLEdwards.htm
  4. http://www.monmouthshire.gov.uk/Monmouth/English/yourcouncil/Councillors_Meetings/Political_Groups/Liberal+Democrat+Party/JGeorge.htm
  5. http://www.monmouthshire.gov.uk/Monmouth/English/yourcouncil/Councillors_Meetings/Political_Groups/Conservative+Party/JPFoulser.htm
  6. http://www.monmouthshire.gov.uk/Monmouth/English/yourcouncil/Councillors_Meetings/Political_Groups/Conservative+Party/PMurphy.htm
  7. http://www.monmouthshire.gov.uk/Monmouth/English/yourcouncil/Councillors_Meetings/Political_Groups/Liberal+Democrat+Party/PADHobson.htm
  8. http://www.monmouthshire.gov.uk/Monmouth/English/yourcouncil/Councillors_Meetings/Political_Groups/Conservative+Party/SMDovey.htm
  9. http://www.monmouthshire.gov.uk/Monmouth/English/yourcouncil/Councillors_Meetings/Political_Groups/Conservative+Party/DLSDovey.htm
  10. http://www.monmouthshire.gov.uk/Monmouth/English/yourcouncil/Councillors_Meetings/Political_Groups/Liberal+Democrat+Party/JacquiSullivan.htm
  11. http://www.monmouthshire.gov.uk/Monmouth/English/yourcouncil/Councillors_Meetings/Political_Groups/Labour+Party/ACWatts.htm
  12. http://www.monmouthshire.gov.uk/Monmouth/English/yourcouncil/Councillors_Meetings/Political_Groups/Labour+Party/RGHarris.htm