Monmouthshire County Council election, 2004

Last updated

Elections to Monmouthshire County Council were held on 10 June 2004 on the same day of the European Elections.

Monmouthshire County Council

Monmouthshire County Council is the governing body for the Monmouthshire principal area – one of the unitary authorities of Wales.

Contents

The whole council was up for election and following boundary changes the number of seats was increased to 43. The Conservatives gained overall control of the council from a previous minority Labour administration.

Conservative Party (UK) Political party in the United Kingdom

The Conservative Party, officially the Conservative and Unionist Party, is a centre-right political party in the United Kingdom. The governing party since 2010, it is the largest in the House of Commons, with 313 Members of Parliament, and also has 249 members of the House of Lords, 18 members of the European Parliament, 31 Members of the Scottish Parliament, 12 members of the Welsh Assembly, eight members of the London Assembly and 8,916 local councillors.

The Labour Party is a centre-left political party in the United Kingdom which has been described as an alliance of social democrats, democratic socialists and trade unionists. The party's platform emphasises greater state intervention, social justice and strengthening workers' rights.

The Conservatives formed a minority administration from the previous county council election in May 1999, being largest group on the council by one seat.

Following two by-elections in 2002 (the Conservatives losing one seat to the Liberal Democrats and Labour taking a seat from an Independent), the Labour party became the largest group by one seat.

Liberal Democrats (UK) Political party in the United Kingdom

The Liberal Democrats are a liberal political party in the United Kingdom. It is currently led by Vince Cable. They have 11 Members of Parliament in the House of Commons, 96 members of the House of Lords, one member of the European Parliament, five Members of the Scottish Parliament and one member in the Welsh Assembly and London Assembly. At the height of its influence, the party formed a coalition government with the Conservative Party from 2010 to 2015 with its leader Nick Clegg serving as Deputy Prime Minister.

Having secured the support of Independent and Liberal Democrat councillors, Labour formed a minority administration from July 2002 until the election in June 2004.

After the election, the composition of the council was:

Plaid Cymru is a social-democratic political party in Wales advocating Welsh independence from the United Kingdom within the European Union.

The election results were noticeable seeing two Plaid Cymru councillors elected in Caldicot, a first for the Welsh nationalists in heavily anglicised Monmouthshire, and the election of a 21-year-old student, Matthew Jones , for the Liberal Democrats in Chepstow.
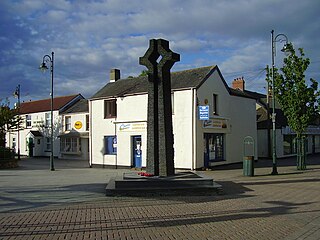
Caldicot, Monmouthshire town in Monmouthshire, southeast Wales

Caldicot is a town and community in Monmouthshire, southeast Wales, located between Chepstow and Newport on the Gloucester to Newport Line served primarily by Caldicot station, whilst by road it is just off the busy M4 / M48 motorway corridor. The site adjoins the Caldicot Levels, on the north side of the Severn Estuary. Caldicot has easy access on the railway west to Newport, Cardiff Central and east to Chepstow, Lydney, and Gloucester, as well as one stop west to Severn Tunnel Junction and then east via the Severn Tunnel to Filton Abbeywood and Bristol Temple Meads and further afield. Generally good road access to Cardiff and across the Second Severn Crossing, old Severn Bridge to Bristol. The population of the town is around 11,000. It has a large school, Caldicot Comprehensive School, and is known for its medieval castle.

Chepstow town in Wales

Chepstow is a town and community in Monmouthshire, Wales, adjoining the border with Gloucestershire, England. It is located on the River Wye, about 2 miles (3.2 km) above its confluence with the River Severn, and adjoining the western end of the Severn Bridge. It is 16 miles (26 km) east of Newport, 28 miles (45 km) east-northeast of Cardiff, 18 miles (29 km) northwest of Bristol and 110 miles (180 km) west of London.

The Labour party suffered heavy losses to the Conservatives, the Liberal Democrats, Plaid Cymru and Independents.

The election result saw a fragmentation of the non-conservative vote; the emergence of the Liberal Democrats and Plaid Cymru onto the council. Of note was the number of close races in individual wards, as well as several individual contests where the winning candidate polled far less than a majority of the votes cast.

Election results: overview

Monmouthshire Local Election Result 2004
PartySeatsGainsLossesNet gain/lossSeats %Votes %Votes+/−
  Conservative 23 7 2 +5 53.49 43.60 13,888 -
  Labour 9 1 11 -10 20.93 19.92 6,345 -
  Liberal Democrat 4 3 1 +3 9.30 18.17 5,786 -
  Independent 5 3 1 +2 11.63 14.32 4,560 -
  Plaid Cymru 2 2 0 +2 4.65 3.01 958 -
  UKIP 0 0 0 = 0.00 0.80 256 -
  Green 0 0 0 = 0.00 0.18 58 -
Monmouthshire Local Election Result 2004 (wards in Monmouth constituency )
PartySeatsGainsLossesNet gain/lossSeats %Votes %Votes+/−
  Conservative 22 7 2 +5 65.71 47.57 12,699 -
  Liberal Democrat 4 4 1 +3 11.43 21.67 5,786 -
  Labour 4 0 8 -8 11.43 16.72 4,466 -
  Independent 4 2 0 +2 11.43 13.09 3,494 -
  Plaid Cymru 0 0 0 = 0.00 0.73 194 -
  Green 0 0 0 = 0.00 0.22 58 -
  UKIP 0 0 0 = 0.00 0.00 - -
Monmouthshire Local Election Result 2004 (wards in Newport East constituency )
PartySeatsGainsLossesNet gain/lossSeats %Votes %Votes+/−
  Labour 4 1 3 -2 37.50 36.46 1,879 -
  Conservative 2 0 0 = 25.00 23.07 1,189 -
  Independent 1 1 1 = 12.50 20.68 1,066 -
  Plaid Cymru 2 2 0 +2 25.00 14.82 764 -
  UKIP 0 0 0 = 0.00 4.97 256 +4.97
  Liberal Democrat 0 0 0 = 0.00 - - -
  Green 0 0 0 = 0.00 - - -

Electoral division (ward) results


Abergavenny, Cantref
PartyCandidateVotes%±
Conservative Christopher D. Woodhouse 560 57.20 -
Independent Lawrence R. Jones 263 26.86 -
Labour Paul M. Nicholson 156 15.94 -
Majority 297 30.34 -
Turnout 979 57.88
Conservative hold Swing

Abergavenny, Castle
PartyCandidateVotes%±
Conservative Alan W. Breeze 352 45.48 -
Independent Anthony (Tony) O'Donovan 174 22.48 -
Labour Margaret E. Phillips 130 16.80 -
Liberal Democrat Christopher (Chris) P. Lines 82 10.59 -
Plaid Cymru Ceri L. Thomas 36 4.65 -
Majority 178 23.00 -
Turnout 774 54.04
Conservative hold Swing


Abergavenny, Grofield
PartyCandidateVotes%±
Liberal Democrat Douglas L. Edwards 324 44.02 -
Conservative Maureen Powell 183 24.86 -
Labour Andre J. Arkell 182 24.73 -
Independent Graham D. Preece 47 6.39 -
Majority 141 19.16 -
Turnout 736 56.95
Liberal Democrat gain from Labour Swing


Abergavenny, Lansdown
PartyCandidateVotes%±
Labour Robin A. Griffiths 248 40.72 -
Independent Raymond Hill 175 28.73 -
Conservative Victor Barrett 121 19.87 -
Plaid Cymru Richard F. Olding 37 6.08 -
Liberal Democrat Vera M. Grice 28 4.60 -
Majority 73 11.99 -
Turnout 609 37.37
Labour hold Swing


Abergavenny, Priory
PartyCandidateVotes%±
Conservative Jane P. Foulser 375 46.29 -
Labour Christine M. Walby 198 28.37 -
Plaid Cymru John R. Walters 63 9.03 -
Liberal Democrat Rosemary (Rose) E. Carr 62 8.89 -
Majority 177 17.92 -
Turnout 698 45.94
Conservative hold Swing


Caerwent
PartyCandidateVotes%±
Conservative Philip (Phil) Murphy 384 55.41 +5.73
Labour Brian W. Counsell 249 35.93 -6.97
Liberal Democrat Peter Butcher 60 8.66 +1.24
Majority 135 19.48 +51
Turnout 693 50.51
Conservative hold Swing +6.35


Caldicot Castle
PartyCandidateVotes%±
Plaid Cymru Ronald (Ron) G. Stewart 228 35.73 -
Conservative Richard J. Harries 213 33.39 -
Labour Gareth J. Jenkins 197 30.88 -
Majority 15 2.34 -
Turnout 638 45.29
Plaid Cymru gain from Labour Swing


Caldicot, Dewstow
PartyCandidateVotes%±
Labour William (Bill) Edwards 238 42.34 -
Independent Julie A. Fry 142 25.27 -
Plaid Cymru John I. Marshall 133 23.67 -
Conservative Nicholas W. L. Hackett-Pain 49 8.72 -
Majority 96 17.07 -
Turnout 562 37.18
Labour hold Swing


Caldicot, Green Lane
PartyCandidateVotes%±
Plaid Cymru David J. Ashwin 219 34.71 -
Labour David J. Evans 165 26.15 -
Independent Paul D. Tidmarsh 108 17.12 -
Independent Colin Babb 79 12.51 -
Conservative Leslie R. Harries 60 9.51 -
Majority 54 8.56 -
Turnout 631 38.69
Plaid Cymru gain from Labour Swing


Caldicot, Severn
PartyCandidateVotes%±
Labour Ronald J. Higginson 201 39.19 -
Plaid Cymru Joanne S. Daniels 136 26.51 -
Independent Graham Powell 100 19.49 -
Conservative Penelope Howe 76 14.81 -
Majority 65 12.68 -
Turnout 513 38.81
Labour hold Swing


Caldicot, West End
PartyCandidateVotes%±
Independent James D. Harris 329 65.93 -
Labour Elaine G. Davies 170 34.07 -
Majority 159 31.86 -
Turnout 499 35.01
Independent gain from Labour Swing


Chepstow, Larkfield
PartyCandidateVotes%±
Liberal Democrat Phylip (Phil) Hobson 436 53.56 +41.70
Conservative Clifford (Cliff) Meredith 378 46.44 -0.51
Labour DNS 0 -41.19
Majority 58 7.12 n/a
Turnout 814 52.67
Liberal Democrat gain from Conservative Swing +20.60


Chepstow, St. Christopher’s
PartyCandidateVotes%±
Labour Pamela (Pam) Birchall 240 40.20 -17.57
Conservative David Dovey 171 28.64 +4.56
Independent Andrew Huntley 110 18.43 +8.66
Liberal Democrat Anthony (Tony) Redhead 76 12.73 +4.35
Majority 69 11.52 -22.13
Turnout 597 34.70
Labour hold Swing -11.07


Chepstow, St. Kingsmark
PartyCandidateVotes%±
Conservative Theodore (Ted) Dorel 422 47.20 -10.26
Liberal Democrat Henry W. Hodges 385 43.07 +24.31
Labour Eric Taylor 87 9.73 -14.05
Majority 37 4.13 -29.56
Turnout 894 45.35
Conservative hold Swing -17.29


Chepstow, St. Mary’s
PartyCandidateVotes%±
Liberal Democrat Matthew A. Jones 337 49.26 +34.87
Conservative Gethyn J. Davies 217 31.73 -1.31
Labour Gwyneth Eburne 130 19.01 -33.57
Majority 120 17.53 n/a
Turnout 684 47.24
Liberal Democrat gain from Labour Swing 34.22 L to LD


Chepstow, Thornwell
PartyCandidateVotes%±
Labour Armand C. Watts 373 54.14 +12.83
Conservative James M. Brady 232 33.67 +17.46
Liberal Democrat Lynda Pitt Mitchell 84 12.19 +3.57
Independent DNS -33.86
Majority 141 20.47 +13.20
Turnout 689 37.35
Labour hold Swing +15.15


Croesonen
PartyCandidateVotes%±
Labour Roger G. Harris 247 40.16 -
Conservative John L. Prosser 192 31.22 -
Independent Norma C. Watkins 99 16.10 -
Plaid Cymru Edward H. O. Evans 44 7.15 -
Liberal Democrat Anthea M. Dewhurst 33 5.37 -
Majority 55 8.94 -
Turnout 615 39.63
Labour hold Swing


Crucorney
PartyCandidateVotes%±
Independent Robert (Bob) J. B. Wilcox 585 70.65 -
Conservative Jean E. Laws 143 17.27 -
Liberal Democrat David John Williams 100 12.08 -
Majority 442 53.38 -
Turnout 828 53.49
Independent hold Swing


Devauden
PartyCandidateVotes%±
Conservative Robert J. W. Greenland 509 76.20 -
Liberal Democrat David Stevens 159 23.80 -
Majority 350 52.40 -
Turnout 668 57.57
Conservative hold Swing


Goetre Fawr
PartyCandidateVotes%±
Conservative Sidney Brian Jones 509 45.65 -
Liberal Democrat Sylvia E. Heighton 497 44.57 -
Labour Dorothy M. McLeod 109 9.78 -
Majority 12 1.08 -
Turnout 1,115 59.94
Conservative hold Swing


Llanbadoc
PartyCandidateVotes%±
Conservative Valerie (Val) E. Smith uncontested -
Conservative hold Swing -


Llanelly Hill (2)
PartyCandidateVotes%±
Independent Simon G. M. Howarth 695 21.98 -
Independent Anthony (Tony) R. Carrington 609 19.26 -
Labour Giles Howard 521 16.48 -
Conservative Barrie O'Keefe 475 15.02 -
Labour Martin L. Thomas 412 13.03 -
Conservative Jennifer Swattridge 207 6.55 -
Liberal Democrat Browen R. A. Jones 136 4.30 -
Liberal Democrat Sarah L. James 107 3.38 -
Turnout 3,162 47.36
Independent gain from Labour Swing


Llanfoist Fawr
PartyCandidateVotes%±
Conservative Eric Saxon 496 70.06 -
Labour Roger P. Howells 121 17.09 -
Liberal Democrat Vivien Mitchell 91 12.85 -
Majority 375 52.97 -
Turnout 708 55.68
Conservative hold Swing


Llangybi Fawr
PartyCandidateVotes%±
Conservative Peter R. Clarke 537 74.48 -
Liberal Democrat Martin Sutherland 184 25.52 -
Majority 353 48.96 -
Turnout 721 53.51
Conservative hold Swing


Llanover
PartyCandidateVotes%±
Conservative Brian R. Hood 773 75.71 -
Labour Margaret M. R. Harris 133 13.03 -
Liberal Democrat Stephen R. Poole 115 11.26 -
Majority 640 62.68 -
Turnout 1,021 56.32
Conservative hold Swing


Llantilio Crossenny
PartyCandidateVotes%±
Conservative Ruth Edwards 350 41.81 -
Independent Christopher D. Lewis 290 34.64 -
Liberal Democrat Drewe W. Lacey 66 7.89 -
Independent Avice C. Field 66 7.89 -
Independent Benjamin C. Herbet 65 7.77 -
Majority 60 7.20 -
Turnout 837 62.98
Conservative hold Swing


Llanwenarth Ultra
PartyCandidateVotes%±
Labour Verona M. R. Nelmes 266 41.69 -
Liberal Democrat Peter A. Jones 205 32.13 -
Conservative John G. Jones 167 26.18 -
Majority 61 9.56 -
Turnout 1,021 56.32
Labour hold Swing


Magor with Undy, Mill
PartyCandidateVotes%±
Conservative John Major 551 64.82 -
Labour Nita S. Baicher 299 35.18 -
Majority 252 29.64 -
Turnout 850 40.62
Conservative hold Swing


Magor with Undy, The Elms
PartyCandidateVotes%±
Labour Olive G. Evans 262 30.32 -
UKIP Victor G. Bashford 256 29.63 -
Conservative Paul F. Cawley 194 22.45 -
Independent Brian A. Burt 104 12.04 -
Plaid Cymru Peter Howells-Meadowcroft 48 5.56 -
Majority 6 0.69 -
Turnout 864 36.68
Labour hold Swing


Mardy
PartyCandidateVotes%±
Conservative Nicholas (Nick) H. Ramsay 228 36.18 +7.82
Independent Ralph F. Chapman 174 27.62 -1.96
Labour Hazel E. Bennett 144 22.86 -7.21
Liberal Democrat Charlotte Jones 51 8.10 -3.88
Plaid Cymru Stuart K. Neale 33 5.24 +5.24
Majority 54 8.56 n/a
Turnout 630 46.82
Conservative gain from Labour Swing -4.89


Mitchel Troy
PartyCandidateVotes%±
Conservative Geoffrey (Geoff) C. Burrows 313 53.60 +17.69
Liberal Democrat Lesley M. Williams 271 46.40 -17.69
Majority 42 7.20 n/a
Turnout 721 53.51
Conservative gain from Liberal Democrat Swing -8.85


Monmouth, Dixton with Osbaston
PartyCandidateVotes%±
Liberal Democrat Eileen J. Goodrich 554 52.56 -
Conservative Richard (Dick) Le Gros Cass 500 47.44 -
Majority 54 5.12 -
Turnout 1054 57.82
Liberal Democrat gain from Conservative Swing


Monmouth, Drybridge
PartyCandidateVotes%±
Conservative Alan M. Wintle 384 46.66 -
Liberal Democrat Lloyd Williams 327 39.73 -
Independent Gary Witcombe 112 13.61 -
Majority 57 6.93 -
Turnout 823 43.43
Conservative hold Swing


Monmouth, Overmonnow
PartyCandidateVotes%±
Conservative Susan (Sue) White 282 39.72 -
Labour Maureen Roach 235 33.10 -
Liberal Democrat Richard J. Bond 135 19.01 -
Green Ann Were 58 8.17 -
Majority 47 6.62 -
Turnout 710 40.15
Conservative gain from Labour Swing


Monmouth, Wyesham
PartyCandidateVotes%±
Conservative Elizabeth (Liz) J. Hacket-Pain 334 45.66 -
Labour Marcus J. Roach 242 32.79 -
Liberal Democrat Selwyn Roberts 118 15.99 -
Plaid Cymru David J. Taylor 44 5.96 -
Majority 92 12.87 -
Turnout 738 45.20
Conservative gain from Labour Swing


Portskewett
PartyCandidateVotes%±
Conservative Peter A. Fox 505 66.71 -
Labour Paul T. Wall 177 23.38 -
Liberal Democrat Janet Ellard 75 9.91 -
Majority 328 43.33 -
Turnout 757 48.00
Conservative hold Swing
Raglan
PartyCandidateVotes%±
Conservative William A. L. Crump 621 74.02 -
Liberal Democrat Martin Blakebrough 218 25.98 -
Majority 403 48.04 -
Turnout 839 55.72
Conservative hold Swing


Rogiet
PartyCandidateVotes%±
Labour Michael (Mike) R. Smith 347 58.11 -
Independent Gerald P. Robbins 204 34.18 -
Conservative Margaret Lawrence 46 7.71 -
Majority 143 23.93 -
Turnout 597 46.95
Labour gain from Independent Swing


Shirenewton
PartyCandidateVotes%±
Conservative Graham L. Down 655 68.51 -
Liberal Democrat Pamela (Pam) A. Johnston 173 18.10 -
Labour Phyllis R. Higginson 128 13.39 -
Majority 482 50.41 -
Turnout 956 57.30
Conservative hold Swing


St. Arvans
PartyCandidateVotes%±
Conservative Ann E. Webb 378 61.87 -
Independent Anthony (Tony) J. Newman 131 21.44 -
Liberal Democrat Jane M. J. Robbins 102 16.69 -
Majority 247 40.43 -
Turnout 611 52.52
Conservative hold Swing


Trellech United
PartyCandidateVotes%±
Independent Ashley Thomas 551 51.54 +1.67
Conservative Duncan N. Armstrong 418 36.76 -1.44
Liberal Democrat Linda Campbell 168 14.78 +2.85
Majority 133 14.78 +3.11
Turnout 1,137 54.03
Independent hold Swing +1.56


Usk
PartyCandidateVotes%±
Conservative Edmund J. Harrhy 669 65.52 +0.90
Labour Sandrina Gay 204 19.98 -5.90
Liberal Democrat Alison L. Willott 148 14.50 +5.00
Majority 465 45.54 +6.8
Turnout 1,021 58.87
Conservative hold Swing +3.4

Related Research Articles

Sketty (electoral ward) human settlement in United Kingdom

Sketty is the name of an electoral ward in the City and County of Swansea, Wales, UK. The electoral ward is coterminous with the community.

2007 United Kingdom local elections

The 2007 UK local government elections were held on 3 May 2007. These elections took place in most of England and all of Scotland. There were no local government elections in Wales though the Welsh Assembly had a general election on the same day. There were no local government elections in Northern Ireland. Just over half of English councils and almost all the Scottish councils began the counts on Friday, rather than Thursday night, because of more complex arrangements regarding postal votes.

City of Cardiff Council

The County Council of the City and County of Cardiff is the governing body for Cardiff, one of the Principal Areas of Wales. The council consists of 75 councillors, representing 29 electoral wards. The authority is properly styled as The County Council of the City and County of Cardiff or in common use Cardiff Council. No other style is sanctioned for use on Council Documents although it does occasionally appear wrongly as Cardiff County Council on documents and signage. The City & County itself is usually simply referred to as Cardiff.

Gwynedd Council

Gwynedd Council is the governing body for the principal area of Gwynedd, one of the subdivisions of Wales within the United Kingdom. The Council administrates internally through the medium of Welsh.

Welsh Labour is the part of the United Kingdom Labour Party that operates in Wales. Labour is the largest and most successful political party in modern Welsh politics, having won the largest share of the vote at every UK General Election since 1922, every Welsh Assembly election since 1999, and each European Parliament election from 1979 until 2004, as well as the 2014 one.

The Welsh Conservative Party is the part of the Conservative Party that operates in Wales. At general elections, it is the second-most popular political party in Wales, having obtained the second largest share of the vote at every general election since 1931. At Welsh Assembly elections, the Conservatives are the third-most supported party. They hold one of the four Welsh seats in the European Parliament, eight of the forty Welsh seats in the UK Parliament, and twelve of the sixty seats in the National Assembly for Wales.

2011 National Assembly for Wales election election for the National Assembly in 2011

The National Assembly for Wales election 2011 was an election for the National Assembly. The poll was held on Thursday, 5 May 2011 and decided the incumbency for all the assembly's seats. It was the fourth election for seats in the National Assembly for Wales, and the second election taken under the rules of the Government of Wales Act 2006.

An election to Ceredigion County Council was held on 10 June 2004 on the same day of the European Elections. It was preceded by the 1999 election and followed by the 2008 election.

The elections to Ceredigion County Council were held on 1 May 2008 along with elections to other Welsh councils, plus the London Mayor and Assembly Elections, Metropolitan English councils and Non Metropolitan English councils elections. All 42 council seats are up for election. It was preceded by the 2004 election and followed by the 2012 election.

2007 National Assembly for Wales election election

The 2007 National Assembly election was held on Thursday 3 May 2007 to elect members to the National Assembly for Wales. It was the third general election. On the same day local elections in England and Scotland, and the Scottish Parliament election took place. This election was preceded by the previous Assembly election in 2003.

2008 City of Cardiff Council election

The Cardiff Council election in 2008 was held on 1 May, along with other local elections in the UK. All 75 seats of Cardiff Council were contested, with it remaining in no overall control. It was preceded by the 2004 election and followed by the 2012 election

2012 Ceredigion County Council election

An election to Ceredigion County Council was held on 3 May 2012 along with elections to 20 of the other 21 local authorities in Wales, community council elections in Wales and other elections elsewhere in the United Kingdom. It was followed by the 2017 election.

2017 Scottish local elections

The 2017 Scottish local elections were held on Thursday 4 May, in all 32 local authorities. The SNP retained its position as the largest party in terms of votes and councillors, despite suffering minor losses. The Conservatives made gains and displaced Labour as the second largest party, while the Liberal Democrats suffered a net loss of councillors despite increasing their share of the vote. Minor parties and independents polled well; and independent councillors retained majority control over the 3 island councils. For the first time since the local government reforms in 1995, all councils fell under no overall control.

The fifth election to the Carmarthenshire County Council was held on 1 May 2012. It was preceded by the 2008 election and was followed by the 2017 election. Plaid Cymru won 28 seats whilst Labour and the Independents won 23 each. The main feature of the election was a Labour recovery in the Llanelli area, and to some extent in the Gwendraeth and Ammanford area also, mainly at the expense of Independent candidates. Plaid Cymru lost ground to Labour in the Llanelli area but gained seats elsewhere, becoming the largest party. An Independent-Labour coalition was again formed, but with Labour as the leading partner. As a result, Kevin Madge replaced Meryl Gravell as the leader of the council.

2014 Calderdale Metropolitan Borough Council election

The 2014 Calderdale Metropolitan Borough Council election took place on 22 May 2014 to elect members of Calderdale Metropolitan Borough Council in England. This was on the same day as local elections across the United Kingdom and a European election. One councillor was elected in each of the 17 wards for a four-year term. There are three councillors representing each ward elected on a staggered basis so one third of the councillor seats were up for re-election. The seats had previously been contested in 2010 which was held in conjunction with a general election. The turnout was significantly lower in 2014 than in 2010 which is not unusual when comparing local elections that coincide with general elections to ones that do not. Prior to the election Labour was the largest party in the council with 21 out of 51 seats, 5 seats short of an overall majority. After the election there was no overall control of the council. Labour had 25 seats, only one short of a majority and so Labour continued to operate a minority administration.

2017 United Kingdom local elections

The 2017 United Kingdom local elections were held on Thursday 4 May 2017. Local elections were held across Great Britain, with elections to 35 English local authorities and all councils in Scotland and Wales.

2017 Welsh local elections

Local elections were held in Wales on Thursday 4 May 2017 to elect members of all 22 local authorities, including the Isle of Anglesey, which was last up for election in 2013 due to having its elections delayed for a year. These local elections were held alongside local elections in Scotland and parts of England.

An election to Ceredigion County Council were held on 4 May 2017 as part of wider local elections across Wales. It was preceded by the 2012 election and the next election is scheduled to take place in 2022.

2008 Conwy County Borough Council election

The 2008 Conwy Council election took place on 1 May 2008 to elect members of Conwy County Borough Council in Wales.It was on the same day as other United Kingdom local elections, 2008. The previous elections took place on 10 June 2004 and the following election took place on 3 May 2012.

References