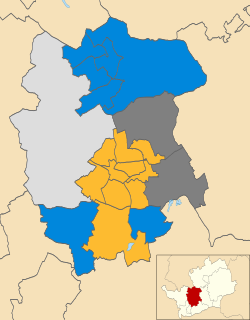
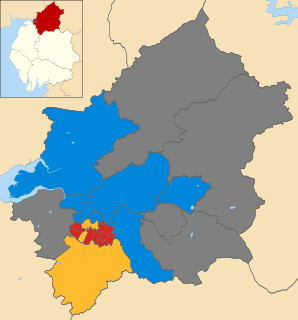
The 2004 Carlisle City Council election took place on 10 June 2004 to elect members of Carlisle District Council in Cumbria, England. One third of the council was up for election and the council stayed under no overall control. [1]
The City of Carlisle is a local government district of Cumbria, England, with the status of a city and non-metropolitan district. It is named after its largest settlement, Carlisle, but covers a far larger area which includes the towns of Brampton and Longtown, as well as outlying villages including Dalston, Scotby and Wetheral. The city has a population of 107,524. and an area of 1,039.97 square kilometres (402 sq mi), making it the largest city in England by area.
Non-metropolitan districts, or colloquially "shire districts", are a type of local government district in England. As created, they are sub-divisions of non-metropolitan counties in a two-tier arrangement.
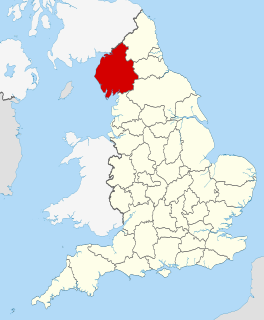
Cumbria is a ceremonial and non-metropolitan county in North West England. The county and Cumbria County Council, its local government, came into existence in 1974 after the passage of the Local Government Act 1972. Cumbria's county town is Carlisle, in the north of the county, and the only other major urban area is Barrow-in-Furness on the southwestern tip of the county.
After the election, the composition of the council was
The Labour Party is a centre-left political party in the United Kingdom which has been described as an alliance of social democrats, democratic socialists and trade unionists. The party's platform emphasises greater state intervention, social justice and strengthening workers' rights.
The Conservative Party, officially the Conservative and Unionist Party, is a centre-right political party in the United Kingdom. Presently led by Theresa May, it has been the governing party since 2010. It presently has 314 Members of Parliament in the House of Commons, 249 members of the House of Lords, and 18 members of the European Parliament. It also has 31 Members of the Scottish Parliament, 12 members of the Welsh Assembly, eight members of the London Assembly and 9,008 local councillors. One of the major parties of UK politics, it has formed the government on 45 occasions, more than any other party.
The Liberal Democrats are a liberal political party in the United Kingdom. They presently have 11 Members of Parliament in the House of Commons, 96 members of the House of Lords, and one member of the European Parliament. They also have five Members of the Scottish Parliament and a member each in the Welsh Assembly and London Assembly. The party reached the height of its influence in the early 2010s, forming a junior partner in a coalition government from 2010 to 2015. It is presently led by Vince Cable.
Labour became the largest party on the council with 24 councillors, but without a majority, after gaining 3 seats from the Conservatives in Belle Vue, St Aidans and Yewdale. [3] [4] However Labour did lose one seat to the Liberal Democrats in Castle, with the Liberal Democrats also gaining a seat from the Conservatives in Dalston by 1 vote. [3] [4] This meant the Conservatives dropped to 20 seats, while the Liberal Democrats went up to 7 and there remained 1 independent. [4] Overall turnout at the election was 42.6%, up from 31.4% in 2003. [5]
A Councillor is a member of a local government council.
Belle Vue is a suburb of Carlisle, Cumbria, United Kingdom. The ward population taken at the 2011 census was 6,491.
Dalston is a large village and civil parish within the Carlisle district of Cumbria, England. It is situated on the B5299 road about four miles (6 km) south-south-west of Carlisle city centre, and approximately five miles (8 km) from Junction 42 of the M6 motorway.
Following the election the Liberal Democrats continued to back the Conservatives to run the council, with Mike Mitchelson remaining as leader of the council. [6]
Party | Seats | Gains | Losses | Net gain/loss | Seats % | Votes % | Votes | +/− | |
---|---|---|---|---|---|---|---|---|---|
Labour | 8 | 3 | 1 | +2 | 47.1 | 38.0 | 10,957 | -6.1% | |
Conservative | 5 | 0 | 4 | -4 | 29.4 | 41.1 | 11,844 | +0.0% | |
Liberal Democrat | 3 | 2 | 0 | +2 | 17.6 | 15.7 | 4,526 | +1.1% | |
Independent | 1 | 0 | 0 | 0 | 5.9 | 4.5 | 1,293 | +4.2% | |
Green | 0 | 0 | 0 | 0 | 0 | 0.8 | 220 | +0.8% | |
Party | Candidate | Votes | % | ± | |
---|---|---|---|---|---|
Conservative | David Morton | 1,538 | 70.6 | +11.3 | |
Labour | Mohammed Harid | 642 | 29.4 | -11.3 | |
Majority | 896 | 41.1 | +22.5 | ||
Turnout | 2,180 | 46.9 | +12.6 | ||
Conservative hold | Swing | ||||
Party | Candidate | Votes | % | ± | |
---|---|---|---|---|---|
Labour | Ian Stockdale | 740 | 42.5 | -4.7 | |
Conservative | George Bain | 710 | 40.8 | +5.6 | |
Liberal Democrat | William Wyllie | 291 | 16.7 | +4.0 | |
Majority | 30 | 1.7 | -10.3 | ||
Turnout | 1,741 | 42.1 | +12.9 | ||
Labour gain from Conservative | Swing | ||||
Party | Candidate | Votes | % | ± | |
---|---|---|---|---|---|
Labour | Michael Boaden | 813 | 57.5 | -3.2 | |
Conservative | Gareth Ellis | 602 | 42.5 | +3.2 | |
Majority | 211 | 14.9 | -6.5 | ||
Turnout | 1,415 | 32.7 | +6.7 | ||
Labour hold | Swing | ||||
Party | Candidate | Votes | % | ± | |
---|---|---|---|---|---|
Conservative | Judith Prest | 919 | 62.3 | -8.8 | |
Labour | John Hale | 315 | 21.4 | -7.5 | |
Liberal Democrat | Steven Tweedie | 241 | 16.3 | +16.3 | |
Majority | 604 | 40.9 | -1.4 | ||
Turnout | 1,475 | 43.2 | |||
Conservative hold | Swing | ||||
Party | Candidate | Votes | % | ± | |
---|---|---|---|---|---|
Liberal Democrat | James Tootle | 917 | 62.9 | +5.3 | |
Labour | Steven Bowditch | 541 | 37.1 | -5.3 | |
Majority | 376 | 25.8 | +10.5 | ||
Turnout | 1,458 | 35.7 | +11.0 | ||
Liberal Democrat gain from Labour | Swing | ||||
Party | Candidate | Votes | % | ± | |
---|---|---|---|---|---|
Labour | Colin Glover | 865 | 57.5 | -15.1 | |
Conservative | James Bainbridge | 400 | 26.6 | -0.8 | |
Liberal Democrat | Eileen Aldersey | 240 | 15.9 | +15.9 | |
Majority | 465 | 30.9 | -14.2 | ||
Turnout | 1,505 | 34.6 | +11.5 | ||
Labour hold | Swing | ||||
Party | Candidate | Votes | % | ± | |
---|---|---|---|---|---|
Liberal Democrat | Trevor Allison | 1,048 | 43.6 | +5.5 | |
Conservative | Ann McKerrell | 1,047 | 43.5 | -2.0 | |
Labour | Ann Warwick | 310 | 12.9 | -3.5 | |
Majority | 1 | 0.0 | |||
Turnout | 2,405 | 54.1 | +13.7 | ||
Liberal Democrat gain from Conservative | Swing | ||||
Party | Candidate | Votes | % | ± | |
---|---|---|---|---|---|
Labour | Joan Southward | 1,044 | 65.2 | -5.7 | |
Conservative | Henry Stordy | 558 | 34.8 | +15.1 | |
Majority | 486 | 30.3 | -20.8 | ||
Turnout | 1,602 | 35.5 | +8.6 | ||
Labour hold | Swing | ||||
Party | Candidate | Votes | % | ± | |
---|---|---|---|---|---|
Conservative | Doreen Parsons | 523 | 61.2 | ||
Independent | Robert Wickings | 331 | 38.8 | ||
Majority | 192 | 22.5 | |||
Turnout | 854 | 52.2 | |||
Conservative hold | Swing | ||||
Party | Candidate | Votes | % | ± | |
---|---|---|---|---|---|
Labour | Carole Rutherford | 792 | 47.6 | -19.7 | |
Conservative | Michele Gwillim | 590 | 35.5 | +10.9 | |
Liberal Democrat | Olwyn Luckley | 282 | 16.9 | +8.8 | |
Majority | 202 | 12.1 | -30.6 | ||
Turnout | 1,664 | 37.6 | +9.3 | ||
Labour hold | Swing | ||||
Party | Candidate | Votes | % | ± | |
---|---|---|---|---|---|
Independent | William Graham | 778 | 83.5 | ||
Conservative | Teresa Cartner | 154 | 16.5 | ||
Majority | 624 | 67.0 | |||
Turnout | 932 | 57.4 | |||
Independent hold | Swing | ||||
Party | Candidate | Votes | % | ± | |
---|---|---|---|---|---|
Liberal Democrat | Hannah Farmer | 1,245 | 55.6 | +5.3 | |
Labour | John Bell | 995 | 44.4 | -5.3 | |
Majority | 250 | 11.2 | +10.6 | ||
Turnout | 2,240 | 47.0 | +7.3 | ||
Liberal Democrat hold | Swing | ||||
Party | Candidate | Votes | % | ± | |
---|---|---|---|---|---|
Labour | Lucy Patrick | 842 | 48.9 | -0.1 | |
Conservative | Lawrence Fisher | 659 | 38.3 | -0.8 | |
Green | Colin Paisley | 220 | 12.8 | +12.8 | |
Majority | 183 | 10.6 | +0.7 | ||
Turnout | 1,721 | 38.7 | +7.9 | ||
Labour gain from Conservative | Swing | ||||
Party | Candidate | Votes | % | ± | |
---|---|---|---|---|---|
Conservative | Andrew Stevenson | 1,470 | 62.7 | +6.1 | |
Labour | Thomas Johnson | 873 | 37.3 | +8.1 | |
Majority | 597 | 25.5 | -1.9 | ||
Turnout | 2,343 | 50.9 | +15.6 | ||
Conservative hold | Swing | ||||
Party | Candidate | Votes | % | ± | |
---|---|---|---|---|---|
Labour | Caroline Watson | 706 | 45.6 | -18.2 | |
Conservative | Nicola Clarke | 397 | 25.6 | +3.1 | |
Liberal Democrat | James Osler | 262 | 16.9 | +3.1 | |
Independent | Denis Devlin | 184 | 11.9 | +11.9 | |
Majority | 309 | 19.9 | -21.4 | ||
Turnout | 1,549 | 38.6 | +8.4 | ||
Labour hold | Swing | ||||
Party | Candidate | Votes | % | ± | |
---|---|---|---|---|---|
Conservative | Barry Earp | 1,295 | 73.7 | -3.2 | |
Labour | Roger Horne | 463 | 26.3 | +3.2 | |
Majority | 832 | 47.3 | -6.5 | ||
Turnout | 1,758 | 50.0 | +12.6 | ||
Conservative hold | Swing | ||||
Party | Candidate | Votes | % | ± | |
---|---|---|---|---|---|
Labour | Raymond Warwick | 1,016 | 50.9 | -0.4 | |
Conservative | Neville Lishman | 982 | 49.1 | +10.6 | |
Majority | 34 | 1.7 | -11.1 | ||
Turnout | 1,998 | 42.6 | +8.6 | ||
Labour gain from Conservative | Swing | ||||
A by-election was held on 24 November 2005 in Castle ward after the death of the Liberal Democrat group leader John Guest. [7] Olwyn Luckley held the seat for the Liberal Democrats, who continued to hold the balance of power on the council. [7]
By-elections, also spelled bye-elections, are used to fill elected offices that have become vacant between general elections.
Party | Candidate | Votes | % | ± | |
---|---|---|---|---|---|
Liberal Democrat | Olwyn Luckley | 538 | 59.3 | -3.6 | |
Labour | Jessica Riddle | 370 | 40.7 | +3.6 | |
Majority | 168 | 18.6 | -7.2 | ||
Turnout | 908 | 22.0 | -13.7 | ||
Liberal Democrat hold | Swing | ||||
The 2006 South Lakeland District Council election took place on 4 May 2006 to elect members of South Lakeland District Council in Cumbria, England. One third of the council was up for election and the Liberal Democrats gained overall control of the council from no overall control.
Cumbria County Council is the county council of Cumbria, a county in the North West of England. Established in 1974, following its first elections held a year before that, it is an elected local government body responsible for the most significant local services in the county, including county schools, county roads, and social services.
The 2008 St Albans City and District Council election took place on 1 May 2008 to elect members of St Albans District Council in Hertfordshire, England. One third of the council was up for election and the Liberal Democrats gained overall control of the council from no overall control.
The 2007 Hull City Council election took place on 3 May 2007 to elect members of Hull City Council in England. One third of the council was up for election and the Liberal Democrats gained overall control of the council from no overall control. Overall turnout was 27%.
The 2004 St Albans City and District Council election took place on 10 June 2004 to elect members of St Albans District Council in Hertfordshire, England. One third of the council was up for election and the council stayed under no overall control.
The 2006 St Albans City and District Council election took place on 4 May 2006 to elect members of St Albans District Council in Hertfordshire, England. One third of the council was up for election and the Liberal Democrats gained overall control of the council from no overall control.
The 2007 St Albans City and District Council election took place on 3 May 2007 to elect members of St Albans District Council in Hertfordshire, England. One third of the council was up for election and the Liberal Democrats lost overall control of the council to no overall control.
The 2004 Southampton Council election took place on 10 June 2004 to elect members of Southampton Unitary Council in Hampshire, England. One third of the council was up for election and the council stayed under no overall control.
The 2011 Southampton Council election took place on 6 May 2011 to elect members of Southampton Unitary Council in Hampshire, England. One third of the council was up for election. Labour won a majority of the seats being contested and the Conservatives stayed in overall control of the council.
The 2011 South Lakeland District Council election took place on 5 May 2011 to elect members of South Lakeland District Council in Cumbria, England. One third of the council was up for election and the Liberal Democrats stayed in overall control of the council.
The 2006 Carlisle City Council election took place on 4 May 2006 to elect members of Carlisle District Council in Cumbria, England. One third of the council was up for election and the council stayed under no overall control.
The 2007 Carlisle City Council election took place on 3 May 2007 to elect members of Carlisle District Council in Cumbria, England. One third of the council was up for election and the council stayed under no overall control.
The 2008 Carlisle City Council election took place on 1 May 2008 to elect members of Carlisle District Council in Cumbria, England. One third of the council was up for election and the council stayed under no overall control.
The 2010 Carlisle City Council election took place on 6 May 2010 to elect members of Carlisle District Council in Cumbria, England. One third of the council was up for election and the council stayed under no overall control.
The 2011 Carlisle City Council election took place on 5 May 2011 to elect members of Carlisle District Council in Cumbria, England. One third of the council was up for election and the council stayed under no overall control.
The 2011 Wealden District Council election took place on 5 May 2011 to elect members of Wealden District Council in East Sussex, England. The whole council was up for election and the Conservative party stayed in overall control of the council.
The 2004 Havant Borough Council election took place on 10 June 2004 to elect members of Havant Borough Council in Hampshire, England. One third of the council was up for election and the Conservative party stayed in overall control of the council.
The 2012 Carlisle City Council election took place on 3 May 2012 to elect members of Carlisle District Council in Cumbria, England. One third of the council was up for election and the Labour party gained overall control of the council from no overall control.
The 2014 Carlisle City Council election took place on 22 May 2014 to elect members of Carlisle District Council in Cumbria, England. One third of the council was up for election and the Labour party stayed in overall control of the council.
The 2011 Wychavon District Council election took place on 5 May 2011 to elect members of Wychavon District Council in Worcestershire, England. The whole council was up for election and the Conservative party stayed in overall control of the council.