Elections to Barrow-in-Furness Borough Council was held on 1 May 2008. The whole of the council was up for election, with the number of councillors falling from 38 to 36, as a result of ward boundary changes enacted in February 2008. [1] Councillors were elected for terms ranging between two and four years; where more than one councillor was elected in a ward, the councillor with the highest number of votes was granted the longer term. [1]
The election results were both tight and dramatic, with well-known local councillors failing to be re-elected and recounts in certain wards delaying the announcement of votes. [2] No party gained control of the council, and local news sources claimed that the biggest winners from the election were the local People's Party, who quadrupled their number of councillors, [3] and independent candidates campaigning against plans to open an Academy school in the town. [4] Mirroring the results in other local elections across England and Wales held on the same day, the Conservative Party ended as the largest group on the council with the Labour Party's representation dropping heavily. [4]
The People's Party or Socialist People's Party was a minor political party in the Furness region of England.
The Conservative Party, officially the Conservative and Unionist Party, is a centre-right political party in the United Kingdom. Presently led by Theresa May, it has been the governing party since 2010. It presently has 314 Members of Parliament in the House of Commons, 249 members of the House of Lords, and 18 members of the European Parliament. It also has 31 Members of the Scottish Parliament, 12 members of the Welsh Assembly, eight members of the London Assembly and 9,008 local councillors. One of the major parties of UK politics, it has formed the government on 45 occasions, more than any other party.
Following the 2007 election and the defection of two Conservative Party councillors to the Liberal Democrats in October 2007, [5] the composition of the council entering the election was:
The Liberal Democrats are a liberal political party in the United Kingdom. They presently have 11 Members of Parliament in the House of Commons, 96 members of the House of Lords, and one member of the European Parliament. They also have five Members of the Scottish Parliament and a member each in the Welsh Assembly and London Assembly. The party reached the height of its influence in the early 2010s, forming a junior partner in a coalition government from 2010 to 2015. It is presently led by Vince Cable.
Affiliation | Members | |
Conservative Party | 17 | |
Labour Party | 16 | |
Liberal Democrats | 2 | |
Independent | 2 | |
People's Party | 1 |
Party | Seats | Gains | Losses | Net gain/loss | Seats % | Votes % | Votes | +/− | |
---|---|---|---|---|---|---|---|---|---|
Conservative | 17 | 3 | 3 | 0 | 47.2 | 42.6 | 15 756 | -3.5% | |
Labour | 8 | 0 | 8 | -8 | 22.0 | 34.4 | 12 724 | -3.7% | |
Independent | 6 | 5 | 1 | 4 | 16.7 | 14.1 | 5 211 | +5.0% | |
Socialist People's Party | 4 | 3 | 0 | 3 | 11.0 | 4.9 | 1 828 | -0.3% | |
Liberal Democrat | 1 | 1 | 2 | -1 | 2.8 | 3.2 | 1 173 | +3.2% | |
BNP | 0 | 0 | 0 | 0 | 0.0 | 0.9 | 321 | +0.2% | |
The breakdown of councillor terms as a result of the election is shown below. The seats of the ten councillors with two year terms were contested in the 2010 council election.
Affiliation | Term Length | |||
2 Years | 3 Years | 4 Years | ||
Conservative Party | 4 | 6 | 6 | |
Labour Party | 2 | 3 | 3 | |
Independent | 2 | 1 | 3 | |
People's Party | 1 | 2 | 1 | |
Liberal Democrats | 1 | 0 | 0 |
Party | Candidate | Votes | % | ± | |
---|---|---|---|---|---|
Independent | Eric Wood | 381 | 80.9 | ||
Labour | Trevor Biggins | 90 | 19.1 | ||
Majority | 291 | 61.8 | |||
Turnout | 471 | 25.2 | |||
Party | Candidate | Votes | % | ± | |
---|---|---|---|---|---|
Labour | Mary Irwin | 232 | |||
Socialist People's Party | Rosmerie Hamezeian | 224 | |||
Independent | Norman Hill | 176 | |||
Labour | Margaret Thomson | 174 | |||
Socialist People's Party | Sarah Martinez | 158 | |||
Turnout | 964 | 20.3 | |||
Party | Candidate | Votes | % | ± | |
---|---|---|---|---|---|
Conservative | Jill Heath | 870 | |||
Conservative | Kath Unwin | 812 | |||
Conservative | Bill Bleasdale | 730 | |||
Labour | Dennis Bell | 502 | |||
Labour | Jayne Phizacklea | 432 | |||
Labour | Dermot O'Connor | 386 | |||
Liberal Democrat | Lynn Murray | 376 | |||
Turnout | 4,108 | 32.0 | |||
Party | Candidate | Votes | % | ± | |
---|---|---|---|---|---|
Conservative | Timothy Bell | 689 | |||
Conservative | Dorothy James | 623 | |||
Independent | John Millar | 577 | |||
Conservative | David Gill | 576 | |||
Liberal Democrat | Frank Murray | 377 | |||
Labour | Wendy Maddox | 369 | |||
Labour | Barry Doughty | 347 | |||
Labour | Graham Chester | 329 | |||
Turnout | 3,887 | 31.1 | |||
Party | Candidate | Votes | % | ± | |
---|---|---|---|---|---|
Independent | Michael Stephenson | 922 | |||
Conservative | Dave Roberts | 779 | |||
Conservative | Jack Richardson | 720 | |||
Independent | Chloe Lancaster | 719 | |||
Conservative | Bill Joughin | 705 | |||
Labour | Rebbecca Melling | 290 | |||
Turnout | 4,135 | 42.2 | |||
Party | Candidate | Votes | % | ± | |
---|---|---|---|---|---|
Labour | David Pidduck | 445 | |||
Labour | Michelle Roberts | 441 | |||
Conservative | Phil Murray | 359 | |||
Labour | Kenneth Beeres | 335 | |||
Turnout | 1,580 | 20.4 | |||
Party | Candidate | Votes | % | ± | |
---|---|---|---|---|---|
Conservative | Dorothy Dawes | 609 | |||
Conservative | Colin Liversedge | 516 | |||
Independent | Philip Solloway | 511 | |||
Conservative | Bob Maltman | 486 | |||
Labour | Charles Elliot | 299 | |||
Labour | Lorraine Biggins | 243 | |||
Labour | Allison Johnston | 216 | |||
Turnout | 2,880 | 29.9 | |||
Party | Candidate | Votes | % | ± | |
---|---|---|---|---|---|
Socialist People's Party | Jim Hamezeian | 632 | |||
Socialist People's Party | Sheila Begley | 407 | |||
Socialist People's Party | William McEwan | 407 | |||
Labour | Stephen Forbes | 360 | |||
Conservative | Alison Giles | 341 | |||
Labour | Stephen Groundwater | 295 | |||
Labour | Ernest Wilson | 280 | |||
Independent | Margie Arts | 235 | |||
Independent | James Tongue | 226 | |||
BNP | Mike Ashburner | 185 | |||
BNP | Eion McPoland | 136 | |||
Turnout | 3,504 | 31.4 | |||
Party | Candidate | Votes | % | ± | |
---|---|---|---|---|---|
Independent | Jim Jefferson | 495 | |||
Independent | Lisa Hammond | 476 | |||
Liberal Democrat | Dominic McCavish | 420 | |||
Labour | David McCormack | 403 | |||
Labour | Marie Derbyshire | 390 | |||
Labour | Tricia Kegg | 375 | |||
Conservative | Linda Last | 371 | |||
Conservative | Tina Macur | 300 | |||
Conservative | Shirley Richardson | 299 | |||
Turnout | 3,529 | 32.0 | |||
Party | Candidate | Votes | % | ± | |
---|---|---|---|---|---|
Conservative | Des English | 461 | |||
Labour | Jean Waiting | 427 | |||
Labour | Jeffery Garnett | 395 | |||
Labour | Debra Seward | 387 | |||
Turnout | 1,670 | 21.6 | |||
Party | Candidate | Votes | % | ± | |
---|---|---|---|---|---|
Conservative | Ray Guselli | 805 | |||
Conservative | Ken Williams | 761 | |||
Conservative | Rory McClure | 743 | |||
Independent | Wayne Butler | 493 | |||
Labour | Kenneth Thomson | 290 | |||
Labour | Lovinia Williams | 241 | |||
Turnout | 3,333 | 36.4 | |||
Party | Candidate | Votes | % | ± | |
---|---|---|---|---|---|
Labour | Des Barlow | 746 | |||
Labour | Anita Husband | 680 | |||
Labour | Anthony Callister | 614 | |||
Conservative | Steve Smart | 518 | |||
Conservative | Shahnaz Asghar | 436 | |||
Conservative | Mike Macur | 424 | |||
Turnout | 3,418 | 30.1 | |||
Party | Candidate | Votes | % | ± | |
---|---|---|---|---|---|
Conservative | David Marcus | 637 | |||
Conservative | Ollie Flitcroft | 594 | |||
Conservative | Alan Pemberton | 592 | |||
Labour | Colin Thomson | 528 | |||
Labour | John Murphy | 525 | |||
Labour | Robert Pointer | 506 | |||
Turnout | 3,382 | 29.8 | |||
The 2008 Barnsley Metropolitan Borough Council election took place on 1 May 2008 to elect members of Barnsley Metropolitan Borough Council in South Yorkshire, England. One third of the council, alongside an additional vacancy in Old Town was up for election. Prior to the election the defending councillor in Penistone West, having earlier defected from Conservative to the Barnsley Independent Group, fought the election as an Independent. The Labour party stayed in overall control of the council.
An election to Cumbria County Council took place on 2 May 2013 as part of the United Kingdom local elections, 2009. All 84 councillors were elected from various electoral divisions, which returned one or two county councillors each by first-past-the-post voting for a four-year term of office. They coincided with an election for the European Parliament. All 84 seats in the Council were up for election, and a total of 301 candidates stood. The total number of people registered to vote was 392,931. Prior to the election local Conservatives were leading a coalition with the Liberal Democrats with the Labour party as the council's official opposition.
The 2008 Worthing Borough Council election took place on 1 May 2008 to elect members of Worthing Borough Council in West Sussex, England. One third of the council was up for election and the Conservative party stayed in overall control of the council. Overall turnout was 35%.
The 2000 Burnley Borough Council election took place on 4 May 2000 to elect members of Burnley Borough Council in Lancashire, England. One third of the council was up for election and the Labour party lost overall control of the council to no overall control.
The 2008 Woking Council election took place on 1 May 2008 to elect members of Woking Borough Council in Surrey, England. One third of the council was up for election and the Conservative party stayed in overall control of the council.
The 2004 South Tyneside Metropolitan Borough Council election took place on 10 June 2004 to elect members of South Tyneside Metropolitan Borough Council in Tyne and Wear, England. The whole council was up for election with boundary changes since the last election in 2003 reducing the number of seats by 6. The Labour party stayed in overall control of the council.
The 2000 Halton Borough Council election took place on 4 May 2000 to elect members of Halton Unitary Council in Cheshire, England. One third of the council was up for election and the Labour party stayed in overall control of the council.
An election for the Borough Council in Slough, England, was held on 6 May 2010. This was the 124th Slough general local authority election since Slough became a local government unit in 1863.
The 2008 Cheltenham Council election took place on 1 May 2008 to elect members of Cheltenham Borough Council in Gloucestershire, England. Half of the council was up for election and the council stayed under no overall control.
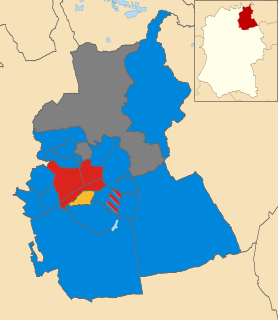
The 2008 Swindon Borough Council election took place on 4 May 2008 to elect members of Swindon Unitary Council in Wiltshire, England. One third of the council was up for election and the Conservative party stayed in overall control of the council.
The 1999 Solihull Metropolitan Borough Council election took place on 6 May 1999 to elect members of Solihull Metropolitan Borough Council in the West Midlands, England. One third of the council was up for election and the council stayed under no overall control.
The 2003 Solihull Metropolitan Borough Council election took place on 1 May 2003 to elect members of Solihull Metropolitan Borough Council in the West Midlands, England. One third of the council was up for election and the Conservative party stayed in overall control of the council.
The 2007 Solihull Metropolitan Borough Council election took place on 4 May 2007 to elect members of Solihull Metropolitan Borough Council in the West Midlands, England. One third of the council was up for election and the Conservative party lost overall control of the council to no overall control.
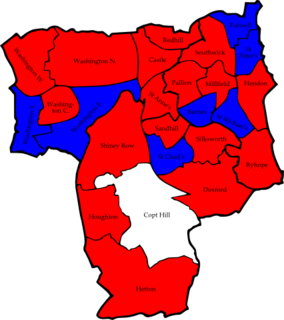
The 2007 Sunderland Council election took place on 3 May 2007 to elect members of Sunderland Metropolitan Borough Council in Tyne and Wear, England. One third of the council was up for election and the Labour party stayed in overall control of the council.
The 2008 Sunderland Council election took place on 1 May 2008 to elect members of Sunderland Metropolitan Borough Council in Tyne and Wear, England. One third of the council was up for election and the Labour party stayed in overall control of the council.
The 2002 Harrogate Council election took place on 2 May 2002 to elect members of Harrogate Borough Council in North Yorkshire, England. The whole council was up for election with boundary changes since the last election in 2000 reducing the number of seats by 5. The Liberal Democrats lost overall control of the council to no overall control.
The 2008 Harrogate Council election took place on 1 May 2008 to elect members of Harrogate Borough Council in North Yorkshire, England. One third of the council was up for election and the council stayed under no overall control.
The 2010 Woking Council election took place on 1 May 2010, on the same day as the 2010 general election, to elect members of Woking Borough Council in Surrey, England. One third of the council was up for election and the council stayed under no overall control.
The 2010 Barrow-in-Furness Borough Council election took place on 6 May 2010 to elect members of Barrow-in-Furness Borough Council in Cumbria, England. One third of the council was up for election and the council stayed under no overall control.
Elections to Preston City Council took place on 3 May 2012, the same day as other United Kingdom local elections, 2012.