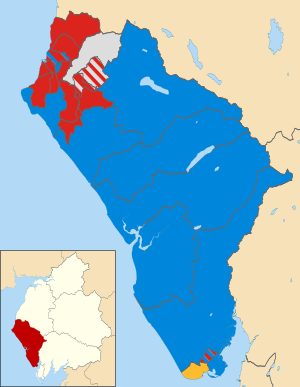
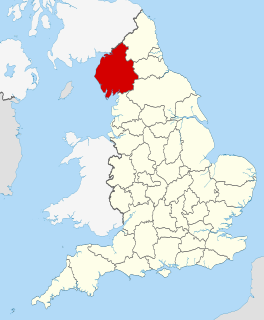
The 2003 Copeland Borough Council election took place on 1 May 2003 to elect members of Copeland Borough Council in Cumbria, England. The whole council was up for election and the Labour party stayed in overall control of the council. [1]
Borough status in the United Kingdom is granted by royal charter to local government districts in England, Wales and Northern Ireland. The status is purely honorary, and does not give any additional powers to the council or inhabitants of the district. In Scotland, similarly chartered communities were known as royal burghs, although the status is no longer granted.
Cumbria is a ceremonial and non-metropolitan county in North West England. The county and Cumbria County Council, its local government, came into existence in 1974 after the passage of the Local Government Act 1972. Cumbria's county town is Carlisle, in the north of the county, and the only other major urban area is Barrow-in-Furness on the southwestern tip of the county.
England is a country that is part of the United Kingdom. It shares land borders with Wales to the west and Scotland to the north-northwest. The Irish Sea lies west of England and the Celtic Sea lies to the southwest. England is separated from continental Europe by the North Sea to the east and the English Channel to the south. The country covers five-eighths of the island of Great Britain, which lies in the North Atlantic, and includes over 100 smaller islands, such as the Isles of Scilly and the Isle of Wight.
Party | Seats | Gains | Losses | Net gain/loss | Seats % | Votes % | Votes | +/− | |
---|---|---|---|---|---|---|---|---|---|
Labour | 31 | +1 | 60.8 | 57.7 | 30,433 | ||||
Conservative | 16 | -1 | 31.4 | 35.0 | 18,438 | ||||
Independent | 3 | 0 | 5.9 | 3.7 | 1,962 | ||||
Liberal Democrat | 1 | 0 | 2.0 | 3.6 | 1,906 | ||||
3 Conservative candidates were unopposed.
Party | Candidate | Votes | % | ± | |
---|---|---|---|---|---|
Independent | Joseph Sunderland | 463 | 71.0 | ||
Labour | Simon Leyton | 189 | 29.0 | ||
Majority | 274 | 42.0 | |||
Turnout | 652 | ||||
Party | Candidate | Votes | % | ± | |
---|---|---|---|---|---|
Conservative | Yvonne Clarkson | unopposed | |||
Conservative | John Jackson | unopposed | |||
Party | Candidate | Votes | % | ± | |
---|---|---|---|---|---|
Conservative | Keith Hitchen | 502 | 68.6 | ||
Liberal Democrat | Roger Putnam | 230 | 31.4 | ||
Majority | 272 | 37.2 | |||
Turnout | 732 | ||||
Party | Candidate | Votes | % | ± | |
---|---|---|---|---|---|
Conservative | Dorothy Wonnacott | 924 | |||
Labour | James Hewitson | 839 | |||
Labour | Anthony Johnston | 829 | |||
Conservative | Mark Mallard | 812 | |||
Labour | Edward Brenan | 798 | |||
Conservative | Allan Mossop | 752 | |||
Turnout | 4,954 | ||||
Party | Candidate | Votes | % | ± | |
---|---|---|---|---|---|
Independent | Anthony Wells | 616 | |||
Labour | Joan Hully | 538 | |||
Labour | William Southward | 511 | |||
Labour | John Henney | 445 | |||
Turnout | 2,110 | ||||
Party | Candidate | Votes | % | ± | |
---|---|---|---|---|---|
Labour | Catherine Giel | 679 | |||
Labour | David Banks | 652 | |||
Conservative | Hilda Morris | 194 | |||
Liberal Democrat | Mike Minogue | 192 | |||
Liberal Democrat | Stuart Bowers | 180 | |||
Turnout | 1,897 | ||||
Party | Candidate | Votes | % | ± | |
---|---|---|---|---|---|
Labour | Willis Metherell | 992 | |||
Labour | Brian Dixon | 963 | |||
Labour | Kevin Young | 952 | |||
Liberal Democrat | Frank Hollowell | 441 | |||
Liberal Democrat | Mary Lancaster | 349 | |||
Conservative | Joyce Toft | 231 | |||
Liberal Democrat | Stephen Litt | 197 | |||
Turnout | 4,125 | ||||
Party | Candidate | Votes | % | ± | |
---|---|---|---|---|---|
Labour | Samuel Meteer | 975 | |||
Labour | Elaine Woodburn | 936 | |||
Labour | Margaret Woodburn | 933 | |||
Conservative | Steven Hill | 536 | |||
Conservative | Alfred Bailey | 402 | |||
Conservative | Elizabeth Hutson | 402 | |||
Turnout | 4,184 | ||||
Party | Candidate | Votes | % | ± | |
---|---|---|---|---|---|
Labour | Michael McVeigh | 1,184 | |||
Labour | Peter Watson | 1,043 | |||
Labour | Constance Watson | 1,005 | |||
Conservative | John Holmes | 592 | |||
Conservative | Jean Lewthwaite | 572 | |||
Conservative | Frederick Blinco | 537 | |||
Turnout | 4,933 | ||||
Party | Candidate | Votes | % | ± | |
---|---|---|---|---|---|
Conservative | Robert Salkeld | 327 | 68.7 | ||
Labour | Mary Ross | 149 | 31.3 | ||
Majority | 178 | 37.4 | |||
Turnout | 476 | ||||
Party | Candidate | Votes | % | ± | |
---|---|---|---|---|---|
Labour | Peter Connolly | 616 | |||
Independent | James Close | 592 | |||
Labour | Timothy Knowles | 425 | |||
Turnout | 1,633 | ||||
Party | Candidate | Votes | % | ± | |
---|---|---|---|---|---|
Conservative | David Gray | 563 | 71.9 | ||
Labour | Christina Cornall | 220 | 28.1 | ||
Majority | 343 | 43.8 | |||
Turnout | 783 | ||||
Party | Candidate | Votes | % | ± | |
---|---|---|---|---|---|
Labour | Janet Johnston | 987 | |||
Labour | Henry Wormstrup | 944 | |||
Labour | Paul Whalley | 901 | |||
Conservative | Marcus Swift | 589 | |||
Conservative | David Hall | 572 | |||
Turnout | 3,993 | ||||
Party | Candidate | Votes | % | ± | |
---|---|---|---|---|---|
Liberal Democrat | Margaret Barnes | 317 | 50.6 | ||
Conservative | Francis Cairns | 309 | 49.4 | ||
Majority | 8 | 1.3 | |||
Turnout | 626 | ||||
Party | Candidate | Votes | % | ± | |
---|---|---|---|---|---|
Labour | Norman Williams | 1,104 | |||
Labour | Jamieson Reed | 970 | |||
Labour | Margarita Docherty | 859 | |||
Conservative | Gareth Maley | 436 | |||
Turnout | 3,369 | ||||
Party | Candidate | Votes | % | ± | |
---|---|---|---|---|---|
Conservative | Alistair Norwood | 828 | |||
Conservative | Andrew Wonnacott | 728 | |||
Labour | John Woolley | 415 | |||
Turnout | 1,971 | ||||
Party | Candidate | Votes | % | ± | |
---|---|---|---|---|---|
Labour | John Park | 683 | 38.9 | ||
Conservative | Frederick Gleaves | 665 | 37.9 | ||
Conservative | Alan Altree | 407 | 23.2 | ||
Turnout | 1,755 | ||||
Party | Candidate | Votes | % | ± | |
---|---|---|---|---|---|
Labour | George Clements | 791 | |||
Labour | Alan Holliday | 661 | |||
Conservative | Leah Higgins | 262 | |||
Turnout | 1,714 | ||||
Party | Candidate | Votes | % | ± | |
---|---|---|---|---|---|
Conservative | Gilbert Scurrah | unopposed | |||
Party | Candidate | Votes | % | ± | |
---|---|---|---|---|---|
Labour | Dorothy Faichney | 1,320 | |||
Labour | Robert Docherty | 1,132 | |||
Labour | Michael Ashbrook | 875 | |||
Conservative | George Higgins | 305 | |||
Conservative | Dorothy Gray | 204 | |||
Turnout | 3,836 | ||||
Party | Candidate | Votes | % | ± | |
---|---|---|---|---|---|
Labour | Geoffrey Blackwell | 343 | 54.9 | ||
Conservative | Edward Fox | 282 | 45.1 | ||
Majority | 61 | 9.8 | |||
Turnout | 625 | ||||
Party | Candidate | Votes | % | ± | |
---|---|---|---|---|---|
Conservative | Francis McPhillips | 905 | |||
Conservative | Francis Heathcote | 898 | |||
Conservative | Raymond Cole | 872 | |||
Labour | Gavin Towers | 591 | |||
Labour | Keith Crellin | 502 | |||
Turnout | 3,768 | ||||
Party | Candidate | Votes | % | ± | |
---|---|---|---|---|---|
Conservative | Norman Clarkson | 575 | 74.6 | ||
Labour | Archibald Ross | 196 | 25.4 | ||
Majority | 379 | 49.2 | |||
Turnout | 771 | ||||
Party | Candidate | Votes | % | ± | |
---|---|---|---|---|---|
Labour | Peter Tyson | 536 | |||
Labour | James Prince | 360 | |||
Independent | Gordon Brown | 291 | |||
Conservative | Sheena Gray | 146 | |||
Turnout | 1,333 | ||||
Party | Candidate | Votes | % | ± | |
---|---|---|---|---|---|
Conservative | David Moore | 1,147 | |||
Conservative | Eileen Eastwood | 962 | |||
Labour | Charles Tuley | 390 | |||
Turnout | 2,499 | ||||
The Metropolitan Borough of Wirral is a metropolitan borough of Merseyside, in North West England. It has a population of 321,238, and encompasses 60 square miles (160 km2) of the northern part of the Wirral Peninsula. Major settlements include Birkenhead, Wallasey, Bebington, Heswall, Hoylake and West Kirby. The city of Liverpool over the Mersey, faces the northeastern side of Wirral. Bordering is the River Mersey to the east, the Irish Sea to the north and the River Dee to the west; the borough of Cheshire West and Chester occupies the remainder of the Wirral Peninsula and borders the borough of Wirral to the south. The borough of Wirral has greater proportions of rural areas than the Liverpool part of Merseyside.
The Borough of Copeland is a local government district and borough in western Cumbria, England. Its council is based in Whitehaven. It was formed on 1 April 1974 by the merger of the Borough of Whitehaven, Ennerdale Rural District and Millom Rural District. The population of the Non-Metropolitan district at the 2011 Census was 70,603.
Allerdale is a non-metropolitan district of Cumbria, England, with borough status. Its council is based in Workington and the borough has a population of 93,492 according to the 2001 census, increasing to 96,422 at the 2011 Census.
One third of Colchester Borough Council in Essex, England is elected each year, followed by one year without election. Since the last boundary changes at the 2016 election, 51 councillors have been elected from 17 wards.
Copeland Borough Council in Cumbria, England is elected every four years. Since the last boundary changes in 1999, 51 councillors have been elected from 25 wards.
Stockton-on-Tees is a unitary authority in County Durham and North Yorkshire, England. Until 1 April 1996 it was a non-metropolitan district in Cleveland.
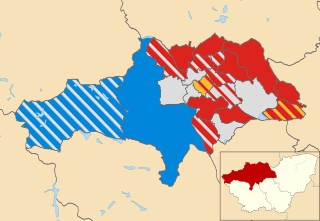
The 2004 Barnsley Metropolitan Borough Council election took place on 10 June 2004 to elect members of Barnsley Metropolitan Borough Council in South Yorkshire, England. The whole council was up for election with boundary changes since the last election in 2003 reducing the number of seats by 3. The Labour party stayed in overall control of the council.
One third of Walsall Metropolitan Borough Council in the West Midlands, England is elected each year, followed by one year without election. Since the last boundary changes in 2004, 60 councillors have been elected from 20 wards.
Michael Copeland is a former unionist MLA from Northern Ireland. He is a member of the Ulster Unionist Party.
Redcar and Cleveland is a unitary authority in North Yorkshire, England. Until 1 April 1996 it was a non-metropolitan district in Cleveland.
The 2003 Barnsley Metropolitan Borough Council election took place on 1 May 2003 to elect members of Barnsley Metropolitan Borough Council in South Yorkshire, England. One third of the council was up for election and the Labour party stayed in overall control of the council.
The 2003 Basingstoke and Deane Council election took place on 1 May 2003 to elect members of Basingstoke and Deane Borough Council in Hampshire, England. One third of the council was up for election and the council stayed under no overall control.
The 1999 Copeland Borough Council election took place on 6 May 1999 to elect members of Copeland Borough Council in Cumbria, England. The whole council was up for election with boundary changes since the last election in 1995. The Labour party stayed in overall control of the council.
The 2007 Copeland Borough Council election took place on 3 May 2007 to elect members of Copeland Borough Council in Cumbria, England. The whole council was up for election and the Labour party stayed in overall control of the council.
The 2011 Copeland Borough Council election took place on 5 May 2011 to elect members of Copeland Borough Council in Cumbria, England. The whole council was up for election and the Labour party stayed in overall control of the council.
The 2007 Gedling Borough Council election took place on 3 May 2007 to elect members of Gedling Borough Council in Nottinghamshire, England. The whole council was up for election and the Conservative party gained overall control of the council from no overall control.
The 2015 Copeland Borough Council election took place on 7 May 2015 to elect members of the Copeland Borough Council in England. They were held on the same day as other local elections.
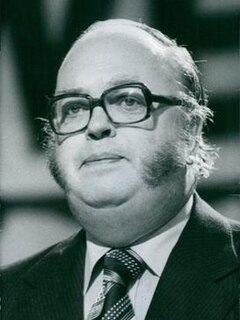
The 1973 Wirral Metropolitan Borough Council election took place on 10 May 1973 to elect members of Wirral Metropolitan Borough Council in England. This was on the same day as other local elections.
The 1975 Wirral Metropolitan Borough Council election took place on 1 May 1975 to elect members of Wirral Metropolitan Borough Council in England. This election was held on the same day as other local elections.
The 1976 Wirral Metropolitan Borough Council election took place on 6 May 1976 to elect members of Wirral Metropolitan Borough Council in England. This election was held on the same day as other local elections.